Estimated zip code population in 2022: 2,414 Zip code population in 2010: 2,076 Zip code population in 2000: 2,050
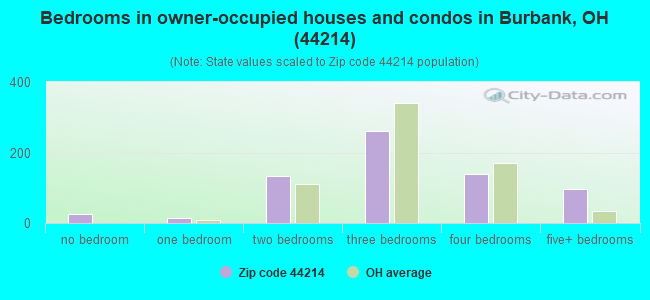
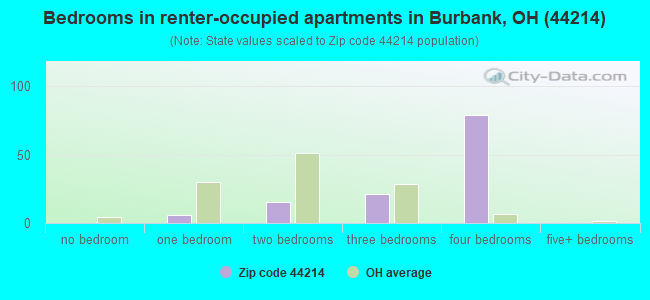
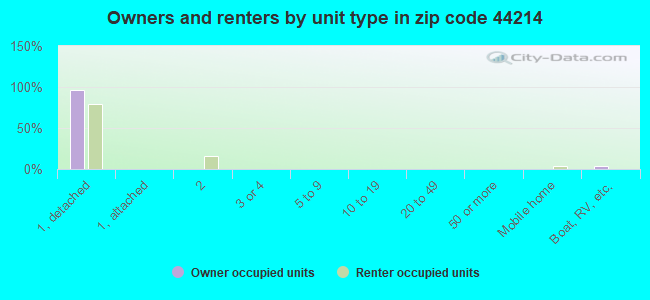
Houses and condos: 828 Renter-occupied apartments: 124
% of renters here:
16%
State:
33%
March 2022 cost of living index in zip code 44214: 82.3 (low, U.S. average is 100)
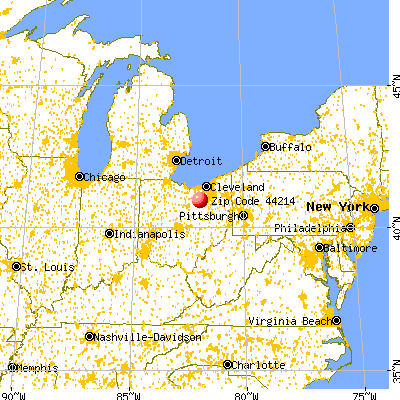
Land area: 27.4 sq. mi. Water area: 0.1 sq. mi.
Population density: 88 people per square mile
(very low).
OSM Map
General Map
Google Map
MSN Map
OSM Map
General Map
Google Map
MSN Map
OSM Map
General Map
Google Map
MSN Map
OSM Map
General Map
Google Map
MSN Map
Please wait while loading the map...
Real estate property taxes paid for housing units in 2022:
This zip code:
1.2% ($2,596)
Ohio:
1.3% ($2,639)
Median real estate property taxes paid for housing units with mortgages in 2022: $2,713 (1.1%) Median real estate property taxes paid for housing units with no mortgage in 2022: $2,308 (1.1%)
Business Search- 14 Million verified businesses
Males: 1,397
(57.9%)
Females: 1,016
(42.1%)
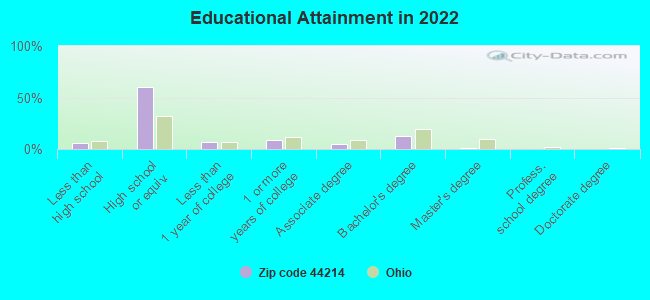
For population 25 years and over in 44214:
High school or higher: 92.6%
Bachelor's degree or higher: 13.9%
Graduate or professional degree: 1.4%
Unemployed: 1.8%
Mean travel time to work (commute): 22.0 minutes
For population 15 years and over in 44214:
Never married: 33.3%
Now married: 57.3%
Separated: 0.1%
Widowed: 3.8%
Divorced: 5.5%
Zip code 44214 compared to state average:
Unemployed percentage below state average.
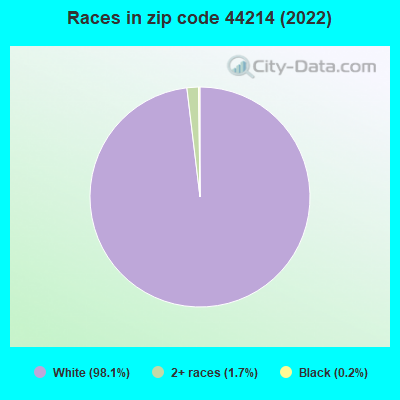
Black race population percentage significantly below state average.
Hispanic race population percentage significantly below state average.
Median age below state average.
Foreign-born population percentage significantly below state average.
Renting percentage below state average.
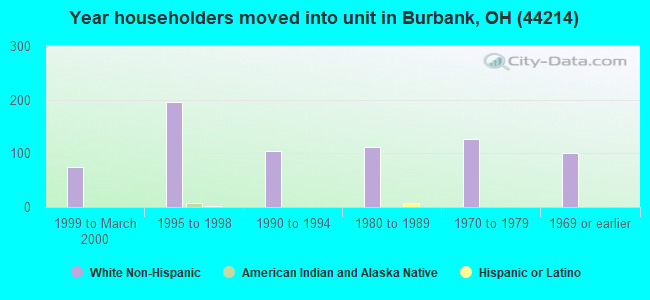
Length of stay since moving in significantly above state average.
Number of college students below state average.
Percentage of population with a bachelor's degree or higher significantly below state average.
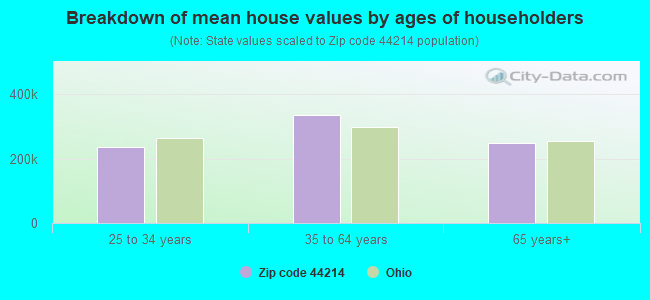
Estimated median house/condo value in 2022: $224,588
44214:
$224,588
Ohio:
$204,100
According to our research of Ohio and other state lists, there were 2 registered sex offenders living in 44214 zip code as of May 28, 2024. The ratio of all residents to sex offenders in zip code 44214 is 1,141 to 1. The ratio of registered sex offenders to all residents in this zip code is lower than the state average.
Median resident age:
This zip code:
34.5 years
Ohio median age:
39.9 years
Average household size:
This zip code:
3.0 people
Ohio:
2.4 people
Averages for the 2020 tax year for zip code 44214, filed in 2021:
Average Adjusted Gross Income (AGI) in 2020: $63,473 (Individual Income Tax Returns)
Here:
$63,473
State:
$67,288
Salary/wage: $54,541 (reported on 86.0% of returns)
Here:
$54,541
State:
$55,628
(% of AGI for various income ranges: 1358.2% for AGIs below $25k, 3715.6% for AGIs $25k-50k, 7018.3% for AGIs $50k-75k, 9026.0% for AGIs $75k-100k, 20958.2% for AGIs $100k-200k)
Taxable interest for individuals: $406 (reported on 29.0% of returns)
This zip code:
$406
Ohio:
$1,518
(% of AGI for various income ranges: 3.6% for AGIs below $25k, 12.2% for AGIs $25k-50k, 27.5% for AGIs $50k-75k, 14.0% for AGIs $75k-100k, 44.5% for AGIs $100k-200k)
Ordinary dividends: $1,606 (reported on 15.0% of returns)
Here:
$1,606
State:
$7,167
(% of AGI for various income ranges: 12.7% for AGIs below $25k, 5.0% for AGIs $25k-50k, 35.0% for AGIs $50k-75k, 22.0% for AGIs $75k-100k, 141.8% for AGIs $100k-200k)
Net capital gain/loss in AGI: +$8,129 (reported on 13.1% of returns)
Here:
+$8,129
State:
+$18,919
(% of AGI for various income ranges: 7.7% for AGIs below $25k, 53.3% for AGIs $50k-75k, 75.0% for AGIs $75k-100k, 892.7% for AGIs $100k-200k)
Profit/loss from business: +$13,067 (reported on 14.0% of returns)
Here:
+$13,067
State:
+$13,744
(% of AGI for various income ranges: 176.8% for AGIs below $25k, 167.2% for AGIs $25k-50k, 374.2% for AGIs $50k-75k, 345.0% for AGIs $75k-100k, 432.7% for AGIs $100k-200k)
Taxable individual retirement arrangement distribution: $15,586 (reported on 6.5% of returns)
44214:
$15,586
Ohio:
$18,876
(% of AGI for various income ranges: 227.2% for AGIs $25k-50k, 682.0% for AGIs $75k-100k)
Total itemized deductions: $28,250 (reported on 3.7% of returns)
Here:
$28,250
State:
$33,869
(% of AGI for various income ranges: 1027.3% for AGIs $100k-200k)
Charity contributions: $10,233 (reported on 2.8% of returns)
Here:
$10,233
State:
$14,577
(% of AGI for various income ranges: 279.1% for AGIs $100k-200k)
Taxes paid: $8,075 (reported on 3.7% of returns)
44214:
$8,075
State:
$7,681
(% of AGI for various income ranges: 293.6% for AGIs $100k-200k)
Earned income credit: $2,182 (reported on 10.3% of returns)
Here:
$2,182
State:
$2,304
(% of AGI for various income ranges: 61.8% for AGIs below $25k, 57.8% for AGIs $25k-50k)
Percentage of individuals using paid preparers for their 2020 taxes: 92.5%
Here:
93%
State:
94%
(% for various income ranges: 91.2% for AGIs below $25k, 95.8% for AGIs $25k-50k, 94.1% for AGIs $50k-75k, 92.3% for AGIs $75k-100k, 89.5% for AGIs $100k-200k)
Averages for the 2012 tax year for zip code 44214, filed in 2013:
Average Adjusted Gross Income (AGI) in 2012: $46,568 (Individual Income Tax Returns)
Here:
$46,568
State:
$54,926
Salary/wage: $41,780 (reported on 86.0% of returns)
Here:
$41,780
State:
$45,869
(% of AGI for various income ranges: 70.0% for AGIs below $25k, 79.4% for AGIs $25k-50k, 78.0% for AGIs $50k-75k, 84.9% for AGIs $75k-100k, 72.3% for AGIs $100k-200k)
Taxable interest for individuals: $771 (reported on 31.0% of returns)
This zip code:
$771
Ohio:
$1,297
(% of AGI for various income ranges: 1.2% for AGIs below $25k, 1.0% for AGIs $25k-50k, 0.2% for AGIs $50k-75k, 0.5% for AGIs $100k-200k)
Ordinary dividends: $1,194 (reported on 17.0% of returns)
Here:
$1,194
State:
$5,821
(% of AGI for various income ranges: 0.5% for AGIs below $25k, 0.1% for AGIs $25k-50k, 0.7% for AGIs $50k-75k, 0.3% for AGIs $75k-100k, 0.5% for AGIs $100k-200k)
Net capital gain/loss in AGI: +$3,025 (reported on 12.0% of returns)
Here:
+$3,025
State:
+$11,232
(% of AGI for various income ranges: 2.8% for AGIs $50k-75k, 0.5% for AGIs $100k-200k)
Profit/loss from business: +$9,571 (reported on 14.0% of returns)
Here:
+$9,571
State:
+$12,773
(% of AGI for various income ranges: 9.0% for AGIs below $25k, 2.4% for AGIs $25k-50k, 3.5% for AGIs $50k-75k, 3.5% for AGIs $75k-100k)
Taxable individual retirement arrangement distribution: $10,450 (reported on 8.0% of returns)
44214:
$10,450
Ohio:
$14,511
(% of AGI for various income ranges: 2.9% for AGIs below $25k, 2.9% for AGIs $25k-50k, 4.7% for AGIs $75k-100k)
Total itemized deductions: $17,294 (22% of AGI, reported on 31.0% of returns)
Here:
$17,294
State:
$21,278
Here:
22.2% of AGI
State:
18.8% of AGI
(% of AGI for various income ranges: 6.8% for AGIs below $25k, 9.0% for AGIs $25k-50k, 11.8% for AGIs $50k-75k, 10.6% for AGIs $75k-100k, 15.4% for AGIs $100k-200k)
Charity contributions: $3,295 (reported on 19.0% of returns)
Here:
$3,295
State:
$3,943
(% of AGI for various income ranges: 1.2% for AGIs $25k-50k, 1.2% for AGIs $50k-75k, 1.4% for AGIs $75k-100k, 2.0% for AGIs $100k-200k)
Taxes paid: $6,255 (reported on 31.0% of returns)
44214:
$6,255
State:
$9,568
(% of AGI for various income ranges: 1.3% for AGIs below $25k, 2.5% for AGIs $25k-50k, 3.9% for AGIs $50k-75k, 4.1% for AGIs $75k-100k, 6.6% for AGIs $100k-200k)
Earned income credit: $2,280 (reported on 15.0% of returns)
Here:
$2,280
State:
$2,285
(% of AGI for various income ranges: 4.9% for AGIs below $25k, 1.1% for AGIs $25k-50k)
Percentage of individuals using paid preparers for their 2012 taxes: 59.0%
Here:
59%
State:
51%
(% for various income ranges: 51.3% for AGIs below $25k, 60.0% for AGIs $25k-50k, 64.7% for AGIs $50k-75k, 70.0% for AGIs $75k-100k, 66.7% for AGIs $100k-200k)
Averages for the 2004 tax year for zip code 44214, filed in 2005:
Average Adjusted Gross Income (AGI) in 2004: $40,347 (Individual Income Tax Returns)
Here:
$40,347
State:
$44,480
Salary/wage: $36,167 (reported on 86.9% of returns)
Here:
$36,167
State:
$39,198
(% of AGI for various income ranges: 88.5% for AGIs below $10k, 73.5% for AGIs $10k-25k, 80.3% for AGIs $25k-50k, 86.8% for AGIs $50k-75k, 87.0% for AGIs $75k-100k, 58.6% for AGIs over 100k)
Taxable interest for individuals: $1,016 (reported on 45.0% of returns)
This zip code:
$1,016
Ohio:
$1,532
(% of AGI for various income ranges: 3.3% for AGIs below $10k, 2.1% for AGIs $10k-25k, 1.3% for AGIs $25k-50k, 0.5% for AGIs $50k-75k, 0.3% for AGIs $75k-100k, 1.5% for AGIs over 100k)
Taxable dividends: $842 (reported on 21.2% of returns)
Here:
$842
State:
$3,496
(% of AGI for various income ranges: 2.0% for AGIs below $10k, 0.7% for AGIs $10k-25k, 0.5% for AGIs $25k-50k, 0.2% for AGIs $50k-75k, 0.4% for AGIs $75k-100k, 0.4% for AGIs over 100k)
Net capital gain/loss: +$8,503 (reported on 14.7% of returns)
Here:
+$8,503
State:
+$8,582
(% of AGI for various income ranges: 2.0% for AGIs below $10k, 0.4% for AGIs $10k-25k, 1.2% for AGIs $25k-50k, 2.1% for AGIs $50k-75k, 0.1% for AGIs $75k-100k, 10.3% for AGIs over 100k)
Profit/loss from business: +$7,564 (reported on 16.8% of returns)
Here:
+$7,564
State:
+$10,813
(% of AGI for various income ranges: 1.7% for AGIs below $10k, 5.2% for AGIs $10k-25k, 4.1% for AGIs $25k-50k, 2.7% for AGIs $50k-75k, 3.6% for AGIs over 100k)
IRA payment deduction: $3,000 (reported on 2.1% of returns)
44214:
$3,000
Ohio:
$2,794
Total itemized deductions: $14,598 (22% of AGI, reported on 32.8% of returns)
Here:
$14,598
State:
$17,503
Here:
21.8% of AGI
State:
20.8% of AGI
(% of AGI for various income ranges: 5.6% for AGIs $10k-25k, 10.2% for AGIs $25k-50k, 13.7% for AGIs $50k-75k, 15.3% for AGIs $75k-100k, 13.6% for AGIs over 100k)
Charity contributions deductions: $2,748 (4% of AGI, reported on 23.4% of returns)
Here:
$2,748
State:
$3,087
Here:
3.8% of AGI
State:
3.4% of AGI
(% of AGI for various income ranges: 0.4% for AGIs $10k-25k, 0.7% for AGIs $25k-50k, 1.4% for AGIs $50k-75k, 2.1% for AGIs $75k-100k, 3.4% for AGIs over 100k)
Total tax: $4,732 (reported on 79.6% of returns)
44214:
$4,732
State:
$6,781
(% of AGI for various income ranges: 3.0% for AGIs below $10k, 4.8% for AGIs $10k-25k, 7.2% for AGIs $25k-50k, 8.3% for AGIs $50k-75k, 10.1% for AGIs $75k-100k, 15.7% for AGIs over 100k)
Earned income credit: $1,479 (reported on 9.8% of returns)
Here:
$1,479
State:
$1,696
Percentage of individuals using paid preparers for their 2004 taxes: 60.1%
Here:
60%
State:
55%
(% for various income ranges: 45.7% for AGIs below $10k, 58.7% for AGIs $10k-25k, 67.5% for AGIs $25k-50k, 61.8% for AGIs $50k-75k, 57.8% for AGIs $75k-100k, 67.3% for AGIs over 100k)
Household received Food Stamps/SNAP in the past 12 months: 48 Household did not receive Food Stamps/SNAP in the past 12 months: 732
Women who had a birth in the past 12 months: 34 (34 now married, 0 unmarried) Women who did not have a birth in the past 12 months: 323 (193 now married, 130 unmarried)
Housing units in zip code 44214 with a mortgage: 471 (70 second mortgage, 64 both second mortgage and home equity loan) Houses without a mortgage: 34
Median monthly owner costs for units with a mortgage: $1,547 Median monthly owner costs for units without a mortgage: $426
Residents with income below the poverty level in 2022:
This zip code:
12.8%
Whole state:
13.4%
Residents with income below 50% of the poverty level in 2022:
This zip code:
12.2%
Whole state:
7.0%
Median number of rooms in houses and condos:
Here:
6.8
State:
6.7
Median number of rooms in apartments:
Here:
5.1
State:
4.4
Notable locations in this zip code not listed on our city pages
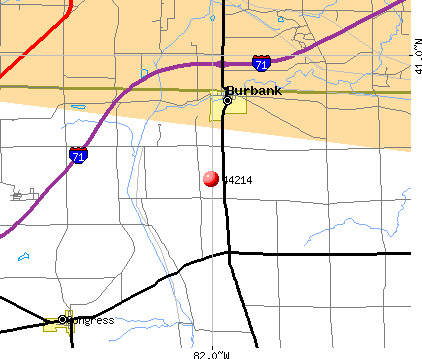
Notable locations in zip code 44214: Burbank Station (A), Wolf Spring Run Farm (B), Canaan Township Fire Department Station 2 (C). Display/hide their locations on the map
Cemeteries: Bald Knob Cemetery (1), Burbank Cemetery (2), Ewing Cemetery (3), Repp Cemetery (4), Clark Cemetery (5), Saint Josephs Cemetery (6). Display/hide their locations on the map
In group quarters: 85 (-1 institutionalized population)
Size of family households: 217 2-persons, 113 3-persons, 153 4-persons, 107 5-persons, 19 6-persons, 26 7-or-more-persons
Size of nonfamily households: 128 1-person, 6 2-persons
494 married couples with children.
58 single-parent households (42 men, 16 women).
99.1% of residents of 44214 zip code speak English at home.
0.3% of residents speak Spanish at home (100% very well).
0.1% of residents speak other Indo-European language at home (100% very well).
Foreign born population: 0 (0.0%)
:
0.0%
Whole state:
5.0%
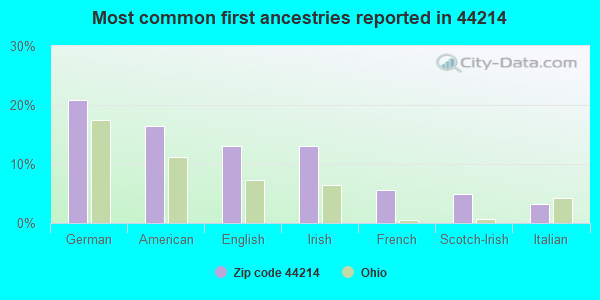
21%German
16%American
13%English
13%Irish
6%French
5%Scotch-Irish
3%Italian
Facilities with environmental interests located in this zip code:
BAKER SAND INC (7800 WHITE ROAD in BURBANK, OH)
AIR MINOR (AIRS/AFS) STATE MASTER (Ohio general info) - AIR MAJOR Business SIC classification: CONSTRUCTION SAND AND GRAVEL
BP OIL CO SITE 05134 * (10134 AVON LAKE RD in BURBANK, OH)
STATE MASTER (Ohio general info) - RCRA-OHD987024544, HAZARDOUS WASTE PROGRAM Conditionally Exempt Small Quantity Generators, less than 100 kg/month of hazardous waste (Resource Conservation and Recovery Act (tracking hazardous waste)) - notification Organizations: BP OIL COMPANY (CONTACT/OWNER)
BAKER SAND INC (9857 FRIENDSVILLE RD in BURBANK, OH)
(Resource Conservation and Recovery Act (tracking hazardous waste))
Housing units lacking complete plumbing facilities: 4.2% Housing units lacking complete kitchen facilities: 4.0%
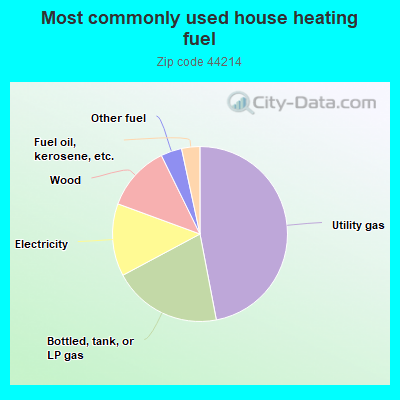
47.3%Utility gas
20.3%Bottled, tank, or LP gas
13.5%Electricity
12.2%Wood
3.9%Other fuel
3.4%Fuel oil, kerosene, etc.
Population in 1990: 1,298. Population change in the 1990s: +752 (+57.9%).
Place of birth for U.S.-born residents:
This state: 2,220
Northeast: 41
Midwest: 20
South: 122
West: 4
57% of the 44214 zip code residents lived in the same house 5 years ago. Out of people who lived in different houses, 69% lived in this county. Out of people who lived in different counties, 50% lived in Ohio.
90% of the 44214 zip code residents lived in the same house 1 year ago. Out of people who lived in different houses, 83% moved from this county. Out of people who lived in different houses, 11% moved from different county within same state.
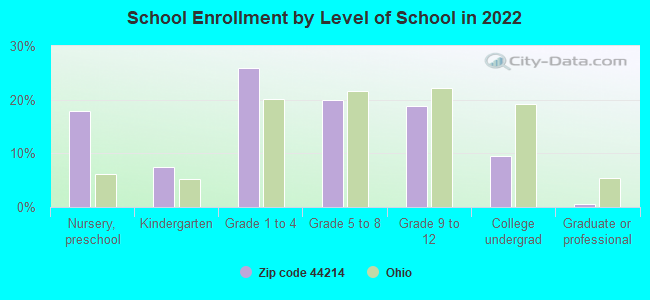
Private vs. public school enrollment:
Students in private schools in grades 1 to 8 (elementary and middle school): 90
Here:
39.1%
Ohio:
16.0%
Students in private schools in grades 9 to 12 (high school): 8
Here:
8.7%
Ohio:
13.1%
Students in private undergraduate colleges: 9
Here:
19.1%
Ohio:
22.3%
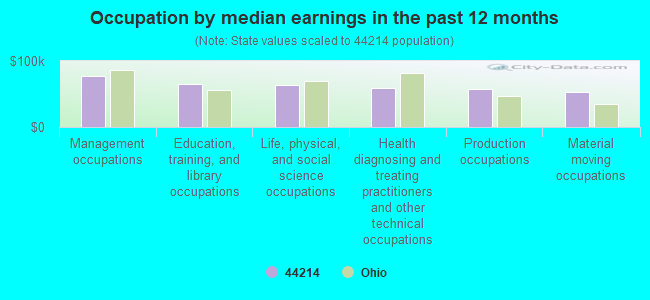
Occupation by median earnings in the past 12 months ($)
77,860Management occupations
64,518Education, training, and library occupations
64,017Life, physical, and social science occupations
58,398Health diagnosing and treating practitioners and other technical occupations
58,165Production occupations
53,683Material moving occupations
Top industries in this zip code by the number of employees in 2005:
Accommodation and Food Services: Full-Service Restaurants (50-99 employees: 1 establishment)
Real Estate and Rental and Leasing: Lessors of Nonresidential Buildings (except Miniwarehouses) (20-49: 2)
People in group quarters in 2010:
6 people in group homes intended for adults
Fatal accident statistics in 2013:
Fatal accident count: 1
Vehicles involved in fatal accidents: 2
Fatal accidents caused by drunken drivers: 0
Fatalities: 1
Persons involved in fatal accidents: 2
Pedestrians involved in fatal accidents: 0
Fatal accident statistics in 2012:
Fatal accident count: 2
Vehicles involved in fatal accidents: 5
Fatal accidents caused by drunken drivers: 1
Fatalities: 2
Persons involved in fatal accidents: 10
Pedestrians involved in fatal accidents: 0
Home Mortgage Disclosure Act Aggregated Statistics For Year 2009 (Based on 2 partial tracts)
A) FHA, FSA/RHS & VA Home Purchase Loans
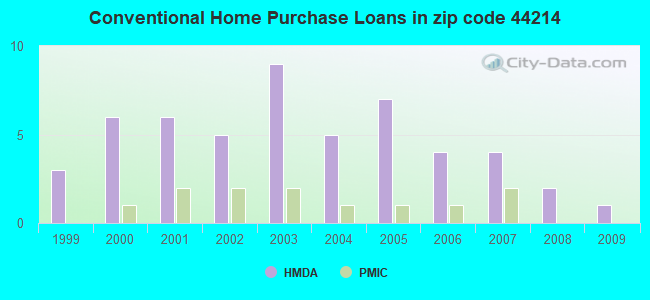
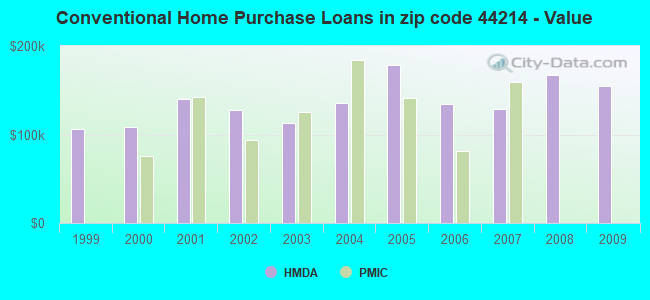
B) Conventional Home Purchase Loans
C) Refinancings
D) Home Improvement Loans
G) Loans On Manufactured Home Dwelling (A B C & D)
Number
Average Value
Number
Average Value
Number
Average Value
Number
Average Value
Number
Average Value
LOANS ORIGINATED
1
$141,930
1
$155,160
9
$131,124
0
$0
1
$85,710
APPLICATIONS APPROVED, NOT ACCEPTED
0
$0
0
$0
1
$88,470
0
$0
0
$0
APPLICATIONS DENIED
0
$0
0
$0
3
$185,110
1
$11,580
0
$0
APPLICATIONS WITHDRAWN
0
$0
0
$0
2
$140,005
0
$0
0
$0
FILES CLOSED FOR INCOMPLETENESS
0
$0
0
$0
0
$0
0
$0
0
$0
Aggregated Statistics For Year 2008 (Based on 2 partial tracts)
A) FHA, FSA/RHS & VA Home Purchase Loans
B) Conventional Home Purchase Loans
C) Refinancings
D) Home Improvement Loans
F) Non-occupant Loans on < 5 Family Dwellings (A B C & D)
Number
Average Value
Number
Average Value
Number
Average Value
Number
Average Value
Number
Average Value
LOANS ORIGINATED
1
$108,860
2
$167,015
6
$130,543
1
$6,610
1
$65,870
APPLICATIONS APPROVED, NOT ACCEPTED
0
$0
0
$0
1
$134,490
0
$0
0
$0
APPLICATIONS DENIED
0
$0
0
$0
5
$167,178
0
$0
0
$0
APPLICATIONS WITHDRAWN
1
$38,860
0
$0
2
$153,510
0
$0
0
$0
FILES CLOSED FOR INCOMPLETENESS
0
$0
0
$0
0
$0
0
$0
0
$0
Aggregated Statistics For Year 2007 (Based on 2 partial tracts)
A) FHA, FSA/RHS & VA Home Purchase Loans
B) Conventional Home Purchase Loans
C) Refinancings
D) Home Improvement Loans
F) Non-occupant Loans on < 5 Family Dwellings (A B C & D)
Number
Average Value
Number
Average Value
Number
Average Value
Number
Average Value
Number
Average Value
LOANS ORIGINATED
1
$69,450
4
$128,705
10
$160,234
1
$24,800
1
$86,810
APPLICATIONS APPROVED, NOT ACCEPTED
0
$0
1
$49,610
1
$103,350
1
$57,050
0
$0
APPLICATIONS DENIED
0
$0
1
$225,440
7
$134,257
1
$80,200
0
$0
APPLICATIONS WITHDRAWN
0
$0
1
$40,240
3
$145,150
0
$0
0
$0
FILES CLOSED FOR INCOMPLETENESS
0
$0
0
$0
1
$175,560
0
$0
0
$0
Aggregated Statistics For Year 2006 (Based on 2 partial tracts)
A) FHA, FSA/RHS & VA Home Purchase Loans
B) Conventional Home Purchase Loans
C) Refinancings
D) Home Improvement Loans
F) Non-occupant Loans on < 5 Family Dwellings (A B C & D)
G) Loans On Manufactured Home Dwelling (A B C & D)
Number
Average Value
Number
Average Value
Number
Average Value
Number
Average Value
Number
Average Value
Number
Average Value
LOANS ORIGINATED
1
$82,400
4
$134,975
9
$112,322
2
$36,795
1
$51,810
0
$0
APPLICATIONS APPROVED, NOT ACCEPTED
0
$0
2
$64,630
4
$79,305
1
$15,980
0
$0
0
$0
APPLICATIONS DENIED
0
$0
2
$79,925
10
$141,934
1
$81,300
1
$98,660
1
$55,120
APPLICATIONS WITHDRAWN
0
$0
1
$92,600
3
$157,000
1
$77,990
0
$0
0
$0
FILES CLOSED FOR INCOMPLETENESS
0
$0
0
$0
2
$73,585
0
$0
0
$0
0
$0
Aggregated Statistics For Year 2005 (Based on 2 partial tracts)
A) FHA, FSA/RHS & VA Home Purchase Loans
B) Conventional Home Purchase Loans
C) Refinancings
D) Home Improvement Loans
F) Non-occupant Loans on < 5 Family Dwellings (A B C & D)
G) Loans On Manufactured Home Dwelling (A B C & D)
Number
Average Value
Number
Average Value
Number
Average Value
Number
Average Value
Number
Average Value
Number
Average Value
LOANS ORIGINATED
1
$130,910
7
$178,470
11
$136,673
3
$35,553
1
$194,570
2
$98,390
APPLICATIONS APPROVED, NOT ACCEPTED
0
$0
1
$146,070
2
$118,095
1
$6,890
0
$0
0
$0
APPLICATIONS DENIED
0
$0
2
$63,940
10
$169,963
2
$53,190
0
$0
0
$0
APPLICATIONS WITHDRAWN
0
$0
1
$199,530
7
$170,990
1
$84,880
0
$0
0
$0
FILES CLOSED FOR INCOMPLETENESS
0
$0
0
$0
2
$132,425
1
$25,360
0
$0
0
$0
Aggregated Statistics For Year 2004 (Based on 2 partial tracts)
B) Conventional Home Purchase Loans
C) Refinancings
D) Home Improvement Loans
G) Loans On Manufactured Home Dwelling (A B C & D)
Number
Average Value
Number
Average Value
Number
Average Value
Number
Average Value
LOANS ORIGINATED
5
$135,044
15
$119,573
1
$76,340
0
$0
APPLICATIONS APPROVED, NOT ACCEPTED
0
$0
4
$152,200
0
$0
0
$0
APPLICATIONS DENIED
3
$116,397
9
$163,431
2
$39,685
1
$9,650
APPLICATIONS WITHDRAWN
0
$0
7
$138,706
1
$13,780
0
$0
FILES CLOSED FOR INCOMPLETENESS
0
$0
2
$142,900
0
$0
0
$0
Aggregated Statistics For Year 2003 (Based on 2 partial tracts)
A) FHA, FSA/RHS & VA Home Purchase Loans
B) Conventional Home Purchase Loans
C) Refinancings
D) Home Improvement Loans
F) Non-occupant Loans on < 5 Family Dwellings (A B C & D)
Number
Average Value
Number
Average Value
Number
Average Value
Number
Average Value
Number
Average Value
LOANS ORIGINATED
1
$100,320
9
$112,568
32
$108,147
1
$21,770
1
$148,820
APPLICATIONS APPROVED, NOT ACCEPTED
0
$0
1
$80,200
3
$129,807
0
$0
0
$0
APPLICATIONS DENIED
0
$0
1
$164,530
7
$160,360
1
$35,550
0
$0
APPLICATIONS WITHDRAWN
0
$0
1
$84,610
8
$132,391
0
$0
0
$0
FILES CLOSED FOR INCOMPLETENESS
0
$0
1
$73,860
1
$144,140
0
$0
0
$0
Aggregated Statistics For Year 2002 (Based on 2 partial tracts)
B) Conventional Home Purchase Loans
C) Refinancings
D) Home Improvement Loans
F) Non-occupant Loans on < 5 Family Dwellings (A B C & D)
Number
Average Value
Number
Average Value
Number
Average Value
Number
Average Value
LOANS ORIGINATED
5
$127,602
22
$119,748
1
$29,210
1
$43,820
APPLICATIONS APPROVED, NOT ACCEPTED
1
$93,150
4
$126,088
0
$0
0
$0
APPLICATIONS DENIED
0
$0
8
$157,230
1
$15,160
0
$0
APPLICATIONS WITHDRAWN
0
$0
3
$100,960
0
$0
0
$0
FILES CLOSED FOR INCOMPLETENESS
0
$0
1
$187,680
0
$0
0
$0
Aggregated Statistics For Year 2001 (Based on 2 partial tracts)
A) FHA, FSA/RHS & VA Home Purchase Loans
B) Conventional Home Purchase Loans
C) Refinancings
D) Home Improvement Loans
Number
Average Value
Number
Average Value
Number
Average Value
Number
Average Value
LOANS ORIGINATED
1
$69,730
6
$140,463
25
$110,868
1
$11,300
APPLICATIONS APPROVED, NOT ACCEPTED
0
$0
0
$0
3
$136,790
0
$0
APPLICATIONS DENIED
0
$0
1
$144,970
7
$104,453
1
$15,430
APPLICATIONS WITHDRAWN
0
$0
1
$110,520
6
$109,275
1
$7,440
FILES CLOSED FOR INCOMPLETENESS
0
$0
0
$0
2
$81,025
0
$0
Aggregated Statistics For Year 2000 (Based on 2 partial tracts)
A) FHA, FSA/RHS & VA Home Purchase Loans
B) Conventional Home Purchase Loans
C) Refinancings
D) Home Improvement Loans
Number
Average Value
Number
Average Value
Number
Average Value
Number
Average Value
LOANS ORIGINATED
1
$109,140
6
$109,000
8
$92,326
2
$26,180
APPLICATIONS APPROVED, NOT ACCEPTED
0
$0
0
$0
3
$122,827
1
$2,760
APPLICATIONS DENIED
0
$0
1
$162,880
3
$162,420
1
$4,960
APPLICATIONS WITHDRAWN
0
$0
0
$0
3
$77,993
0
$0
FILES CLOSED FOR INCOMPLETENESS
0
$0
0
$0
1
$66,420
0
$0
Aggregated Statistics For Year 1999 (Based on 1 partial tract)
Detailed PMIC statistics for the following Tracts:4110.01
2002 - 2018 National Fire Incident Reporting System (NFIRS) incidents
Based on the data from the years 2002 - 2018 the average number of fires per year is 8. The highest number of fire incidents - 22 took place in 2015, and the least - 1 in 2007. The data has a declining trend.
When looking into fire subcategories, the most reports belonged to: Structure Fires (54.5%), and Outside Fires (31.8%).
Fire incident types reported to NFIRS in Zip Code 44214


 Nearest zip codes: 44217, 44254, 44287, 44251, 44235, 44273.


 Based on the data from the years 2002 - 2018 the average number of fires per year is 8. The highest number of fire incidents - 22 took place in 2015, and the least - 1 in 2007. The data has a declining trend.
 When looking into fire subcategories, the most reports belonged to: Structure Fires (54.5%), and Outside Fires (31.8%).