Estimated zip code population in 2022: 4,976 Zip code population in 2010: 4,833 Zip code population in 2000: 5,142
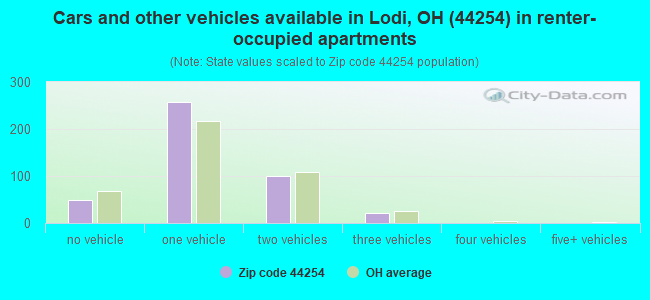
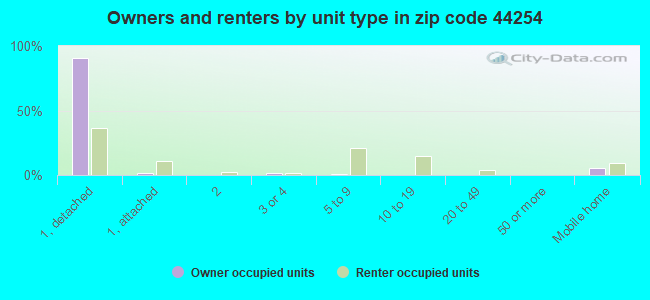
Houses and condos: 2,214 Renter-occupied apartments: 426
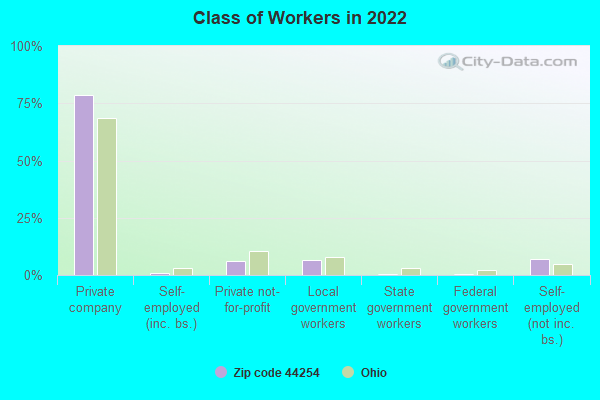
% of renters here:
20%
State:
33%
March 2022 cost of living index in zip code 44254: 95.1 (less than average, U.S. average is 100)
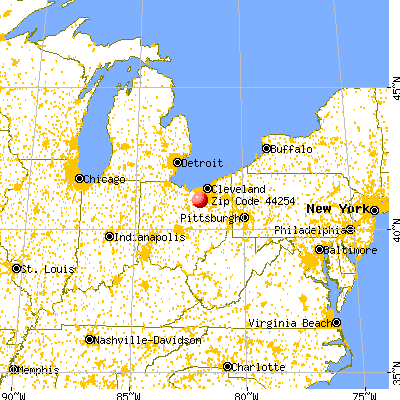
Land area: 26.3 sq. mi. Water area: 0.0 sq. mi.
Population density: 189 people per square mile
(very low).
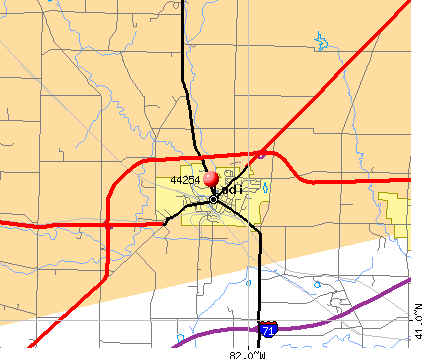
OSM Map
General Map
Google Map
MSN Map
OSM Map
General Map
Google Map
MSN Map
OSM Map
General Map
Google Map
MSN Map
OSM Map
General Map
Google Map
MSN Map
Please wait while loading the map...
Real estate property taxes paid for housing units in 2022:
This zip code:
1.3% ($2,541)
Ohio:
1.3% ($2,639)
Median real estate property taxes paid for housing units with mortgages in 2022: $2,665 (1.3%) Median real estate property taxes paid for housing units with no mortgage in 2022: $2,413 (1.2%)
Averages for the 2020 tax year for zip code 44254, filed in 2021:
Average Adjusted Gross Income (AGI) in 2020: $51,743 (Individual Income Tax Returns)
Here:
$51,743
State:
$67,288
Salary/wage: $45,804 (reported on 82.4% of returns)
Here:
$45,804
State:
$55,628
(% of AGI for various income ranges: 1153.6% for AGIs below $25k, 3465.1% for AGIs $25k-50k, 6409.7% for AGIs $50k-75k, 9972.5% for AGIs $75k-100k, 15679.4% for AGIs $100k-200k)
Taxable interest for individuals: $692 (reported on 24.9% of returns)
This zip code:
$692
Ohio:
$1,518
(% of AGI for various income ranges: 17.8% for AGIs below $25k, 8.8% for AGIs $25k-50k, 24.5% for AGIs $50k-75k, 28.7% for AGIs $75k-100k, 56.2% for AGIs $100k-200k)
Ordinary dividends: $2,586 (reported on 14.7% of returns)
Here:
$2,586
State:
$7,167
(% of AGI for various income ranges: 16.9% for AGIs below $25k, 30.0% for AGIs $25k-50k, 74.5% for AGIs $50k-75k, 23.8% for AGIs $75k-100k, 215.0% for AGIs $100k-200k)
Net capital gain/loss in AGI: +$3,359 (reported on 13.1% of returns)
Here:
+$3,359
State:
+$18,919
(% of AGI for various income ranges: 8.8% for AGIs below $25k, 27.7% for AGIs $25k-50k, 67.6% for AGIs $50k-75k, 43.8% for AGIs $75k-100k, 374.4% for AGIs $100k-200k)
Profit/loss from business: +$9,734 (reported on 11.8% of returns)
Here:
+$9,734
State:
+$13,744
(% of AGI for various income ranges: 80.0% for AGIs below $25k, 123.0% for AGIs $25k-50k, 183.8% for AGIs $50k-75k, 297.5% for AGIs $75k-100k, 400.6% for AGIs $100k-200k)
Taxable individual retirement arrangement distribution: $14,408 (reported on 9.8% of returns)
44254:
$14,408
Ohio:
$18,876
(% of AGI for various income ranges: 66.6% for AGIs below $25k, 110.4% for AGIs $25k-50k, 231.4% for AGIs $50k-75k, 343.8% for AGIs $75k-100k, 759.4% for AGIs $100k-200k)
Total itemized deductions: $24,525 (reported on 3.3% of returns)
Here:
$24,525
State:
$33,869
(% of AGI for various income ranges: 388.3% for AGIs $50k-75k, 522.5% for AGIs $100k-200k)
Charity contributions: $4,280 (reported on 2.0% of returns)
Here:
$4,280
State:
$14,577
(% of AGI for various income ranges: 14.7% for AGIs below $25k, 79.4% for AGIs $75k-100k)
Taxes paid: $7,038 (reported on 3.3% of returns)
44254:
$7,038
State:
$7,681
(% of AGI for various income ranges: 100.0% for AGIs $50k-75k, 170.6% for AGIs $100k-200k)
Earned income credit: $2,053 (reported on 14.7% of returns)
Here:
$2,053
State:
$2,304
(% of AGI for various income ranges: 64.9% for AGIs below $25k, 62.5% for AGIs $25k-50k)
Percentage of individuals using paid preparers for their 2020 taxes: 94.3%
Here:
94%
State:
94%
(% for various income ranges: 92.7% for AGIs below $25k, 95.7% for AGIs $25k-50k, 92.7% for AGIs $50k-75k, 95.8% for AGIs $75k-100k, 96.0% for AGIs $100k-200k, 100.0% for AGIs over 200k)
Averages for the 2012 tax year for zip code 44254, filed in 2013:
Average Adjusted Gross Income (AGI) in 2012: $41,102 (Individual Income Tax Returns)
Here:
$41,102
State:
$54,926
Salary/wage: $36,170 (reported on 85.8% of returns)
Here:
$36,170
State:
$45,869
(% of AGI for various income ranges: 73.2% for AGIs below $25k, 80.6% for AGIs $25k-50k, 79.9% for AGIs $50k-75k, 75.8% for AGIs $75k-100k, 91.4% for AGIs $100k-200k)
Taxable interest for individuals: $651 (reported on 30.1% of returns)
This zip code:
$651
Ohio:
$1,297
(% of AGI for various income ranges: 0.8% for AGIs below $25k, 0.5% for AGIs $25k-50k, 0.6% for AGIs $50k-75k, 0.2% for AGIs $75k-100k, 0.6% for AGIs $100k-200k)
Ordinary dividends: $2,097 (reported on 13.8% of returns)
Here:
$2,097
State:
$5,821
(% of AGI for various income ranges: 1.1% for AGIs below $25k, 0.4% for AGIs $25k-50k, 0.8% for AGIs $50k-75k, 0.3% for AGIs $75k-100k, 1.4% for AGIs $100k-200k)
Net capital gain/loss in AGI: +$3,400 (reported on 9.8% of returns)
Here:
+$3,400
State:
+$11,232
(% of AGI for various income ranges: 0.6% for AGIs $50k-75k, 0.4% for AGIs $75k-100k, 3.7% for AGIs $100k-200k)
Profit/loss from business: +$6,811 (reported on 11.0% of returns)
Here:
+$6,811
State:
+$12,773
(% of AGI for various income ranges: 5.0% for AGIs below $25k, 1.7% for AGIs $25k-50k, 0.2% for AGIs $50k-75k, 1.5% for AGIs $75k-100k, 2.4% for AGIs $100k-200k)
Taxable individual retirement arrangement distribution: $11,470 (reported on 9.3% of returns)
44254:
$11,470
Ohio:
$14,511
(% of AGI for various income ranges: 3.4% for AGIs below $25k, 1.8% for AGIs $25k-50k, 2.1% for AGIs $50k-75k, 2.9% for AGIs $75k-100k, 4.5% for AGIs $100k-200k)
Total itemized deductions: $15,658 (21% of AGI, reported on 25.2% of returns)
Here:
$15,658
State:
$21,278
Here:
20.9% of AGI
State:
18.8% of AGI
(% of AGI for various income ranges: 5.5% for AGIs below $25k, 6.9% for AGIs $25k-50k, 11.4% for AGIs $50k-75k, 11.1% for AGIs $75k-100k, 13.2% for AGIs $100k-200k, 10.1% for AGIs over 200k)
Charity contributions: $2,605 (reported on 17.1% of returns)
Here:
$2,605
State:
$3,943
(% of AGI for various income ranges: 0.5% for AGIs below $25k, 0.6% for AGIs $25k-50k, 1.3% for AGIs $50k-75k, 1.4% for AGIs $75k-100k, 2.1% for AGIs $100k-200k)
Taxes paid: $5,610 (reported on 25.2% of returns)
44254:
$5,610
State:
$9,568
(% of AGI for various income ranges: 1.0% for AGIs below $25k, 2.0% for AGIs $25k-50k, 3.6% for AGIs $50k-75k, 3.9% for AGIs $75k-100k, 8.0% for AGIs $100k-200k)
Earned income credit: $2,056 (reported on 17.5% of returns)
Here:
$2,056
State:
$2,285
(% of AGI for various income ranges: 5.1% for AGIs below $25k, 0.7% for AGIs $25k-50k)
Percentage of individuals using paid preparers for their 2012 taxes: 55.3%
Here:
55%
State:
51%
(% for various income ranges: 48.1% for AGIs below $25k, 57.5% for AGIs $25k-50k, 63.6% for AGIs $50k-75k, 61.1% for AGIs $75k-100k, 78.6% for AGIs $100k-200k, 0.0% for AGIs over 200k)
Averages for the 2004 tax year for zip code 44254, filed in 2005:
Average Adjusted Gross Income (AGI) in 2004: $36,117 (Individual Income Tax Returns)
Here:
$36,117
State:
$44,480
Salary/wage: $33,181 (reported on 88.3% of returns)
Here:
$33,181
State:
$39,198
(% of AGI for various income ranges: 102.5% for AGIs below $10k, 77.2% for AGIs $10k-25k, 83.6% for AGIs $25k-50k, 84.9% for AGIs $50k-75k, 82.9% for AGIs $75k-100k, 69.3% for AGIs over 100k)
Taxable interest for individuals: $1,338 (reported on 40.6% of returns)
This zip code:
$1,338
Ohio:
$1,532
(% of AGI for various income ranges: 1.6% for AGIs below $10k, 2.1% for AGIs $10k-25k, 1.4% for AGIs $25k-50k, 1.1% for AGIs $50k-75k, 1.5% for AGIs $75k-100k, 1.8% for AGIs over 100k)
Taxable dividends: $1,549 (reported on 17.9% of returns)
Here:
$1,549
State:
$3,496
(% of AGI for various income ranges: 1.6% for AGIs below $10k, 1.2% for AGIs $10k-25k, 0.6% for AGIs $25k-50k, 0.7% for AGIs $50k-75k, 0.5% for AGIs $75k-100k, 1.0% for AGIs over 100k)
Net capital gain/loss: +$4,956 (reported on 11.7% of returns)
Here:
+$4,956
State:
+$8,582
(% of AGI for various income ranges: 1.3% for AGIs below $10k, 0.3% for AGIs $10k-25k, 0.2% for AGIs $25k-50k, 1.2% for AGIs $50k-75k, 2.9% for AGIs $75k-100k, 5.0% for AGIs over 100k)
Profit/loss from business: +$4,222 (reported on 10.8% of returns)
Here:
+$4,222
State:
+$10,813
(% of AGI for various income ranges: 4.5% for AGIs below $10k, 3.2% for AGIs $10k-25k, 1.6% for AGIs $25k-50k, 0.7% for AGIs $50k-75k, 0.4% for AGIs $75k-100k, 0.2% for AGIs over 100k)
IRA payment deduction: $3,170 (reported on 1.8% of returns)
44254:
$3,170
Ohio:
$2,794
(% of AGI for various income ranges: 0.3% for AGIs $10k-25k, 0.2% for AGIs $25k-50k, 0.1% for AGIs $50k-75k, 0.3% for AGIs $75k-100k)
Total itemized deductions: $13,894 (23% of AGI, reported on 30.3% of returns)
Here:
$13,894
State:
$17,503
Here:
22.7% of AGI
State:
20.8% of AGI
(% of AGI for various income ranges: 8.5% for AGIs $10k-25k, 9.9% for AGIs $25k-50k, 13.8% for AGIs $50k-75k, 14.0% for AGIs $75k-100k, 13.7% for AGIs over 100k)
Charity contributions deductions: $1,983 (3% of AGI, reported on 22.7% of returns)
Here:
$1,983
State:
$3,087
Here:
3.0% of AGI
State:
3.4% of AGI
(% of AGI for various income ranges: 0.7% for AGIs $10k-25k, 1.0% for AGIs $25k-50k, 1.6% for AGIs $50k-75k, 1.5% for AGIs $75k-100k, 1.6% for AGIs over 100k)
Total tax: $4,133 (reported on 77.9% of returns)
44254:
$4,133
State:
$6,781
(% of AGI for various income ranges: 2.4% for AGIs below $10k, 4.4% for AGIs $10k-25k, 7.2% for AGIs $25k-50k, 8.7% for AGIs $50k-75k, 10.3% for AGIs $75k-100k, 16.1% for AGIs over 100k)
Earned income credit: $1,516 (reported on 13.4% of returns)
Here:
$1,516
State:
$1,696
Percentage of individuals using paid preparers for their 2004 taxes: 54.5%
Here:
54%
State:
55%
(% for various income ranges: 42.1% for AGIs below $10k, 54.5% for AGIs $10k-25k, 56.5% for AGIs $25k-50k, 58.4% for AGIs $50k-75k, 63.6% for AGIs $75k-100k, 66.7% for AGIs over 100k)
Household received Food Stamps/SNAP in the past 12 months: 198 Household did not receive Food Stamps/SNAP in the past 12 months: 1,881
Women who had a birth in the past 12 months: 57 (50 now married, 7 unmarried) Women who did not have a birth in the past 12 months: 990 (435 now married, 554 unmarried)
Housing units in zip code 44254 with a mortgage: 1,037 (121 second mortgage, 107 both second mortgage and home equity loan) Houses without a mortgage: 66
Median monthly owner costs for units with a mortgage: $1,215 Median monthly owner costs for units without a mortgage: $494
Residents with income below the poverty level in 2022:
This zip code:
13.6%
Whole state:
13.4%
Residents with income below 50% of the poverty level in 2022:
This zip code:
8.2%
Whole state:
7.0%
Median number of rooms in houses and condos:
Here:
6.6
State:
6.7
Median number of rooms in apartments:
Here:
4.3
State:
4.4
Notable locations in this zip code not listed on our city pages
Notable locations in zip code 44254: Knollbrook Golf Course (A), Richman Farms (B), Turning Point Farm (C), Bayridge Farm (D), Wilderness Ridge Farm (E), Double R Farm (F), A J Vegatable Farm (G), Scenic Ridge Farm (H), Lodi Fire Department (I), Lodi Branch Medina County District Library (J). Display/hide their locations on the map
In group quarters: 30 (-1 institutionalized population)
Size of family households: 702 2-persons, 158 3-persons, 323 4-persons, 92 5-persons, 28 6-persons, 39 7-or-more-persons
Size of nonfamily households: 586 1-person, 134 2-persons, 13 4-persons
760 married couples with children.
199 single-parent households (61 men, 138 women).
93.4% of residents of 44254 zip code speak English at home.
2.8% of residents speak Spanish at home (40% very well, 47% not well, 13% not at all).
2.5% of residents speak other Indo-European language at home (66% very well, 23% well, 10% not at all).
0.9% of residents speak Asian or Pacific Island language at home (28% very well, 26% well, 28% not well, 19% not at all).
0.2% of residents speak other language at home (100% well).
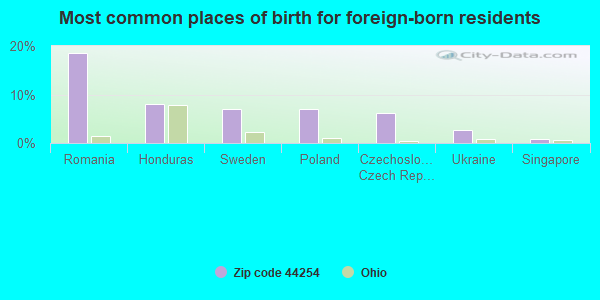
Foreign born population: 113 (2.3%) (68.9% of them are naturalized citizens)
This zip code:
2.3%
Whole state:
5.0%
19%Romania
8%Honduras
7%Sweden
7%Poland
6%Czechoslovakia (includes Czech Republic and Slovakia)
3%Ukraine
1%Singapore
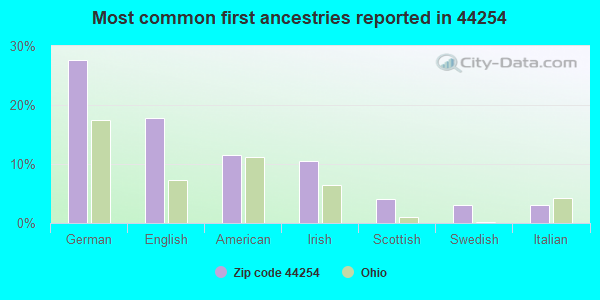
28%German
18%English
12%American
11%Irish
4%Scottish
3%Swedish
3%Italian
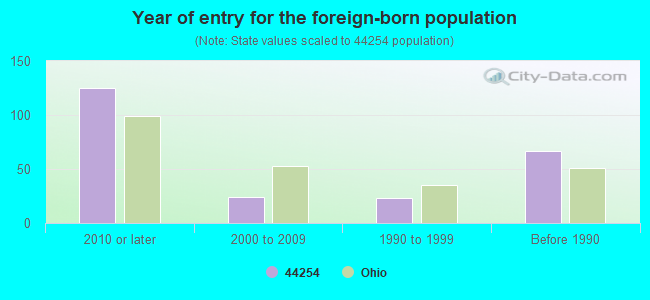
Year of entry for the foreign-born population
1252010 or later
242000 to 2009
231990 to 1999
67Before 1990
Facilities with environmental interests located in this zip code:
ADVANCE BRONZE INC FOUNDRY * (151 BILLMAN ST. in LODI, OH)
CRITERIA AND HAZARDOUS AIR POLLUTANT INVENTORY (Inventory of air pollution sources) STATE MASTER (Ohio general info) - TRIS-44252DVNCB1390H, TRI REPORTER STATE MASTER (Ohio general info) - AIR MAJOR, EPCRA, TRIS-44254DVNCB151BI, TRI REPORTER (Resource Conservation and Recovery Act (tracking hazardous waste)) TRI REPORTER (Tracking of toxic chemicals releasing facilities) Business SIC and NAICS classification: COPPER FOUNDRIES
BAILEY MFG CO (118 LEE STREET in LODI, OH)
AIR MINOR (AIRS/AFS) STATE MASTER (Ohio general info) - RCRA-OHD986993012, HAZARDOUS WASTE PROGRAM, AIR MAJOR Small Quantity Generators, between 100 kg and 1000 kg of hazardous waste/month (Resource Conservation and Recovery Act (tracking hazardous waste)) - notification Business SIC classification: WOOD PRODUCTS Organizations: BAILEY MFG CORP (CONTACT/OWNER)
BEST READY MIX, INC. (106 S. PROSPECT ST. in LODI, OH)
AIR MINOR (AIRS/AFS) Business SIC classification: READY-MIXED CONCRETE
Housing units lacking complete plumbing facilities: 3.9% Housing units lacking complete kitchen facilities: 4.1%
55.7%Utility gas
22.4%Electricity
12.7%Bottled, tank, or LP gas
5.3%Wood
3.3%Fuel oil, kerosene, etc.
0.5%Other fuel
Population in 1990: 4,776. Population change in the 1990s: +366 (+7.7%).
Place of birth for U.S.-born residents:
This state: 4,047
Northeast: 290
Midwest: 178
South: 202
West: 21
66% of the 44254 zip code residents lived in the same house 5 years ago. Out of people who lived in different houses, 63% lived in this county. Out of people who lived in different counties, 50% lived in Ohio.
94% of the 44254 zip code residents lived in the same house 1 year ago. Out of people who lived in different houses, 36% moved from this county. Out of people who lived in different houses, 60% moved from different county within same state. Out of people who lived in different houses, 10% moved from different state.
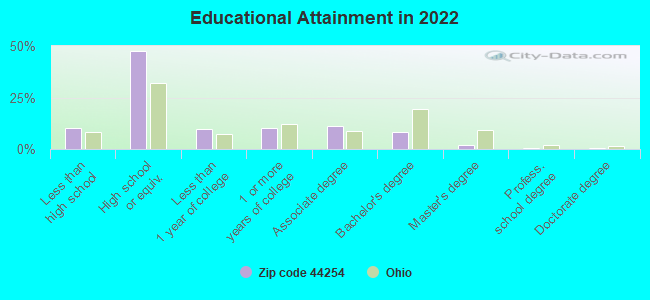
Private vs. public school enrollment:
Students in private schools in grades 1 to 8 (elementary and middle school): 141
Here:
35.8%
Ohio:
16.0%
Students in private schools in grades 9 to 12 (high school): 17
Here:
6.0%
Ohio:
13.1%
Students in private undergraduate colleges:
Here:
0.0%
Ohio:
22.3%
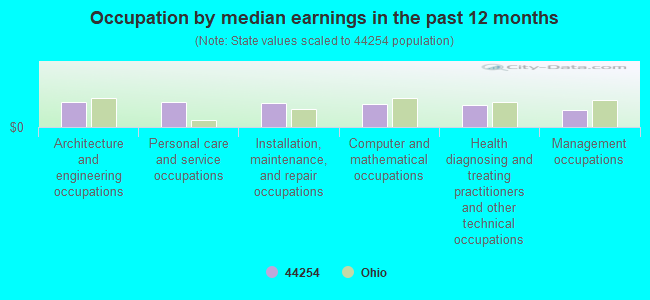
Occupation by median earnings in the past 12 months ($)
74,082Architecture and engineering occupations
73,273Personal care and service occupations
69,468Installation, maintenance, and repair occupations
66,015Computer and mathematical occupations
64,015Health diagnosing and treating practitioners and other technical occupations
49,533Management occupations
Companies with federal contracts located in this zip code:
MAGNACO INDUSTRIES INC (140 WEST DRIVE in LODI, OH; small business) : $2,690,143 in 22 contractsfrom 1999 to 2004
Contracts for Space and Water Heating Equipment, Switches, Valves, Nonpowered, Vehicular Furniture and Accessories by Defense Logistics Agency Signed by year:2000: $404,457; 2001: $437,657; 2002: $140,978; 2003: $146,740; 2004: $1,272,178; 2005: $0; 2006: $0.
Biggest contracts:
$574,680 with Defense Logistics Agency for Space and Water Heating Equipment. Signed on 2004-01-15. Completion date: 2004-10-11.
$287,340, same as above.Signed on 2004-01-22. Completion date: 2004-10-11.
$247,332 with Defense Logistics Agency for Switches. Signed on 2004-12-01. Completion date: 2005-07-09.
$162,826, same as above.Signed on 2004-11-08. Completion date: 2005-06-16.
Top industries in this zip code by the number of employees in 2005:
Health Care and Social Assistance: General Medical and Surgical Hospitals (100-249 employees: 1 establishment)
Accommodation and Food Services: Limited-Service Restaurants (20-49: 1, 5-9: 2)
Wholesale Trade: Plastics Materials and Basic Forms and Shapes Merchant Wholesalers (20-49: 1)
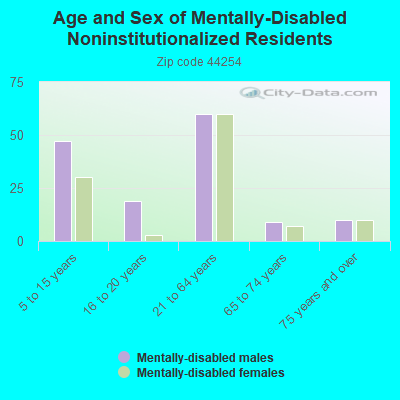
People in group quarters in 2010:
23 people in group homes intended for adults
People in group quarters in 2000:
8 people in homes for the mentally retarded
7 people in orthopedic wards and institutions for the physically handicapped
Fatal accident statistics in 2014:
Fatal accident count: 1
Vehicles involved in fatal accidents: 2
Fatal accidents caused by drunken drivers: 0
Fatalities: 1
Persons involved in fatal accidents: 2
Pedestrians involved in fatal accidents: 0
Fatal accident statistics in 2011:
Fatal accident count: 3
Vehicles involved in fatal accidents: 5
Fatal accidents caused by drunken drivers: 2
Fatalities: 3
Persons involved in fatal accidents: 10
Pedestrians involved in fatal accidents: 0
Home Mortgage Disclosure Act Aggregated Statistics For Year 2009 (Based on 1 full and 4 partial tracts)
A) FHA, FSA/RHS & VA Home Purchase Loans
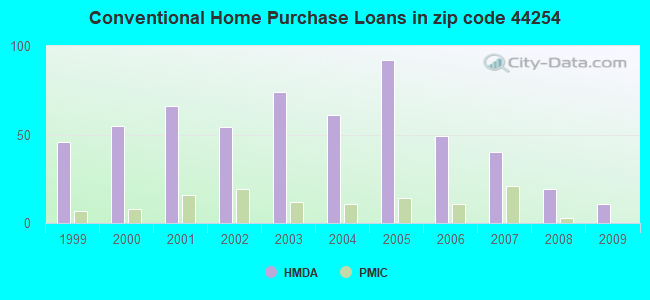
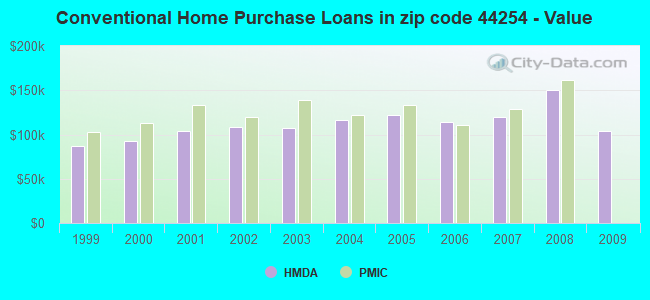
B) Conventional Home Purchase Loans
C) Refinancings
D) Home Improvement Loans
F) Non-occupant Loans on < 5 Family Dwellings (A B C & D)
G) Loans On Manufactured Home Dwelling (A B C & D)
Number
Average Value
Number
Average Value
Number
Average Value
Number
Average Value
Number
Average Value
Number
Average Value
LOANS ORIGINATED
20
$87,038
11
$103,818
59
$137,236
3
$22,433
2
$73,445
6
$65,055
APPLICATIONS APPROVED, NOT ACCEPTED
0
$0
1
$60,000
6
$131,085
2
$7,630
0
$0
0
$0
APPLICATIONS DENIED
5
$111,288
1
$45,420
21
$167,725
8
$13,615
2
$47,500
3
$18,820
APPLICATIONS WITHDRAWN
0
$0
2
$163,340
11
$152,327
0
$0
0
$0
0
$0
FILES CLOSED FOR INCOMPLETENESS
1
$182,880
0
$0
1
$233,500
0
$0
0
$0
0
$0
Aggregated Statistics For Year 2008 (Based on 1 full and 4 partial tracts)
A) FHA, FSA/RHS & VA Home Purchase Loans
B) Conventional Home Purchase Loans
C) Refinancings
D) Home Improvement Loans
F) Non-occupant Loans on < 5 Family Dwellings (A B C & D)
G) Loans On Manufactured Home Dwelling (A B C & D)
Number
Average Value
Number
Average Value
Number
Average Value
Number
Average Value
Number
Average Value
Number
Average Value
LOANS ORIGINATED
15
$117,582
19
$149,776
47
$130,003
10
$40,283
3
$98,157
4
$48,930
APPLICATIONS APPROVED, NOT ACCEPTED
3
$78,000
1
$118,520
11
$111,577
2
$18,705
1
$68,000
1
$20,000
APPLICATIONS DENIED
1
$148,280
3
$116,023
61
$152,078
7
$57,636
4
$332,945
2
$39,000
APPLICATIONS WITHDRAWN
3
$69,877
1
$22,000
25
$125,536
1
$36,880
2
$75,500
2
$42,460
FILES CLOSED FOR INCOMPLETENESS
0
$0
0
$0
2
$245,475
1
$99,000
0
$0
0
$0
Aggregated Statistics For Year 2007 (Based on 1 full and 4 partial tracts)
A) FHA, FSA/RHS & VA Home Purchase Loans
B) Conventional Home Purchase Loans
C) Refinancings
D) Home Improvement Loans
E) Loans on Dwellings For 5+ Families
F) Non-occupant Loans on < 5 Family Dwellings (A B C & D)
G) Loans On Manufactured Home Dwelling (A B C & D)
Number
Average Value
Number
Average Value
Number
Average Value
Number
Average Value
Number
Average Value
Number
Average Value
Number
Average Value
LOANS ORIGINATED
7
$108,539
40
$119,854
74
$137,313
15
$36,058
1
$5,000
7
$128,953
2
$27,270
APPLICATIONS APPROVED, NOT ACCEPTED
0
$0
5
$118,414
13
$106,105
6
$57,772
0
$0
0
$0
0
$0
APPLICATIONS DENIED
2
$82,000
17
$102,304
97
$126,572
26
$49,443
0
$0
1
$20,000
5
$25,412
APPLICATIONS WITHDRAWN
0
$0
5
$95,530
30
$124,829
2
$80,340
0
$0
0
$0
0
$0
FILES CLOSED FOR INCOMPLETENESS
0
$0
1
$173,000
7
$189,797
0
$0
0
$0
0
$0
0
$0
Aggregated Statistics For Year 2006 (Based on 1 full and 4 partial tracts)
A) FHA, FSA/RHS & VA Home Purchase Loans
B) Conventional Home Purchase Loans
C) Refinancings
D) Home Improvement Loans
F) Non-occupant Loans on < 5 Family Dwellings (A B C & D)
G) Loans On Manufactured Home Dwelling (A B C & D)
Number
Average Value
Number
Average Value
Number
Average Value
Number
Average Value
Number
Average Value
Number
Average Value
LOANS ORIGINATED
7
$127,976
49
$114,044
98
$106,190
15
$38,653
8
$105,408
3
$108,450
APPLICATIONS APPROVED, NOT ACCEPTED
0
$0
11
$88,423
26
$88,463
6
$41,960
1
$40,000
0
$0
APPLICATIONS DENIED
1
$159,280
19
$75,667
104
$121,029
16
$48,694
7
$94,141
7
$43,663
APPLICATIONS WITHDRAWN
0
$0
5
$140,392
45
$132,886
5
$72,102
2
$80,500
1
$139,000
FILES CLOSED FOR INCOMPLETENESS
0
$0
2
$112,500
14
$118,505
0
$0
1
$132,730
0
$0
Aggregated Statistics For Year 2005 (Based on 1 full and 4 partial tracts)
A) FHA, FSA/RHS & VA Home Purchase Loans
B) Conventional Home Purchase Loans
C) Refinancings
D) Home Improvement Loans
E) Loans on Dwellings For 5+ Families
F) Non-occupant Loans on < 5 Family Dwellings (A B C & D)
G) Loans On Manufactured Home Dwelling (A B C & D)
Number
Average Value
Number
Average Value
Number
Average Value
Number
Average Value
Number
Average Value
Number
Average Value
Number
Average Value
LOANS ORIGINATED
10
$126,933
92
$122,110
116
$115,266
25
$46,034
0
$0
18
$132,687
12
$74,720
APPLICATIONS APPROVED, NOT ACCEPTED
0
$0
8
$99,671
24
$105,052
7
$29,507
1
$134,000
1
$100,750
4
$36,190
APPLICATIONS DENIED
1
$206,470
35
$70,883
116
$131,154
25
$43,328
1
$169,000
5
$71,336
14
$41,996
APPLICATIONS WITHDRAWN
1
$118,800
9
$142,921
80
$134,651
9
$121,350
0
$0
2
$86,330
0
$0
FILES CLOSED FOR INCOMPLETENESS
0
$0
2
$91,820
11
$118,122
3
$30,150
0
$0
1
$79,640
0
$0
Aggregated Statistics For Year 2004 (Based on 1 full and 4 partial tracts)
A) FHA, FSA/RHS & VA Home Purchase Loans
B) Conventional Home Purchase Loans
C) Refinancings
D) Home Improvement Loans
F) Non-occupant Loans on < 5 Family Dwellings (A B C & D)
G) Loans On Manufactured Home Dwelling (A B C & D)
Number
Average Value
Number
Average Value
Number
Average Value
Number
Average Value
Number
Average Value
Number
Average Value
LOANS ORIGINATED
10
$107,360
61
$116,576
136
$111,242
15
$61,283
11
$90,778
9
$46,917
APPLICATIONS APPROVED, NOT ACCEPTED
1
$150,000
5
$110,526
30
$126,453
3
$67,267
1
$118,710
2
$75,150
APPLICATIONS DENIED
2
$122,000
33
$92,682
109
$130,387
19
$44,756
9
$89,091
6
$30,452
APPLICATIONS WITHDRAWN
0
$0
5
$102,980
78
$126,803
7
$31,247
1
$115,000
1
$155,390
FILES CLOSED FOR INCOMPLETENESS
0
$0
5
$121,106
19
$131,356
0
$0
0
$0
0
$0
Aggregated Statistics For Year 2003 (Based on 1 full and 4 partial tracts)
A) FHA, FSA/RHS & VA Home Purchase Loans
B) Conventional Home Purchase Loans
C) Refinancings
D) Home Improvement Loans
F) Non-occupant Loans on < 5 Family Dwellings (A B C & D)
Number
Average Value
Number
Average Value
Number
Average Value
Number
Average Value
Number
Average Value
LOANS ORIGINATED
8
$131,068
74
$106,914
275
$102,744
18
$11,880
20
$86,177
APPLICATIONS APPROVED, NOT ACCEPTED
0
$0
7
$113,556
46
$111,591
3
$19,833
3
$70,000
APPLICATIONS DENIED
1
$79,000
16
$91,178
96
$116,726
16
$19,723
4
$50,698
APPLICATIONS WITHDRAWN
0
$0
8
$88,682
78
$123,717
0
$0
3
$46,830
FILES CLOSED FOR INCOMPLETENESS
0
$0
5
$96,234
13
$117,769
0
$0
0
$0
Aggregated Statistics For Year 2002 (Based on 1 full and 4 partial tracts)
A) FHA, FSA/RHS & VA Home Purchase Loans
B) Conventional Home Purchase Loans
C) Refinancings
D) Home Improvement Loans
F) Non-occupant Loans on < 5 Family Dwellings (A B C & D)
Number
Average Value
Number
Average Value
Number
Average Value
Number
Average Value
Number
Average Value
LOANS ORIGINATED
4
$117,945
54
$108,111
195
$111,730
18
$24,000
14
$75,024
APPLICATIONS APPROVED, NOT ACCEPTED
0
$0
11
$79,765
38
$122,549
3
$90,313
0
$0
APPLICATIONS DENIED
0
$0
21
$50,108
99
$109,976
7
$16,549
1
$57,000
APPLICATIONS WITHDRAWN
1
$80,000
4
$78,905
45
$114,756
1
$45,120
0
$0
FILES CLOSED FOR INCOMPLETENESS
0
$0
2
$82,445
21
$128,824
1
$24,580
0
$0
Aggregated Statistics For Year 2001 (Based on 1 full and 4 partial tracts)
A) FHA, FSA/RHS & VA Home Purchase Loans
B) Conventional Home Purchase Loans
C) Refinancings
D) Home Improvement Loans
F) Non-occupant Loans on < 5 Family Dwellings (A B C & D)
Number
Average Value
Number
Average Value
Number
Average Value
Number
Average Value
Number
Average Value
LOANS ORIGINATED
8
$110,972
66
$104,422
205
$101,661
10
$13,693
8
$67,795
APPLICATIONS APPROVED, NOT ACCEPTED
0
$0
6
$47,127
42
$101,898
3
$42,393
1
$133,320
APPLICATIONS DENIED
1
$47,000
25
$57,812
114
$93,258
18
$21,441
3
$75,667
APPLICATIONS WITHDRAWN
3
$82,000
8
$130,990
83
$92,803
7
$16,731
2
$68,370
FILES CLOSED FOR INCOMPLETENESS
0
$0
3
$106,770
13
$105,705
0
$0
0
$0
Aggregated Statistics For Year 2000 (Based on 1 full and 4 partial tracts)
A) FHA, FSA/RHS & VA Home Purchase Loans
B) Conventional Home Purchase Loans
C) Refinancings
D) Home Improvement Loans
F) Non-occupant Loans on < 5 Family Dwellings (A B C & D)
Number
Average Value
Number
Average Value
Number
Average Value
Number
Average Value
Number
Average Value
LOANS ORIGINATED
10
$113,980
55
$92,346
83
$85,251
14
$25,373
3
$66,507
APPLICATIONS APPROVED, NOT ACCEPTED
1
$121,920
13
$84,378
34
$87,786
9
$9,432
0
$0
APPLICATIONS DENIED
0
$0
32
$59,169
71
$88,659
13
$10,585
2
$65,875
APPLICATIONS WITHDRAWN
1
$94,000
4
$130,195
42
$78,254
4
$11,468
1
$198,380
FILES CLOSED FOR INCOMPLETENESS
0
$0
0
$0
7
$102,911
0
$0
0
$0
Aggregated Statistics For Year 1999 (Based on 1 full and 2 partial tracts)
A) FHA, FSA/RHS & VA Home Purchase Loans
B) Conventional Home Purchase Loans
C) Refinancings
D) Home Improvement Loans
E) Loans on Dwellings For 5+ Families
F) Non-occupant Loans on < 5 Family Dwellings (A B C & D)
2002 - 2018 National Fire Incident Reporting System (NFIRS) incidents
According to the data from the years 2002 - 2018 the average number of fires per year is 30. The highest number of fire incidents - 47 took place in 2015, and the least - 10 in 2002. The data has an increasing trend.
When looking into fire subcategories, the most incidents belonged to: Structure Fires (54.8%), and Outside Fires (26.4%).
Fire incident types reported to NFIRS in Zip Code 44254


 Nearest zip codes: 44251, 44214, 44235, 44275, 44215, 44253.


 According to the data from the years 2002 - 2018 the average number of fires per year is 30. The highest number of fire incidents - 47 took place in 2015, and the least - 10 in 2002. The data has an increasing trend.
 When looking into fire subcategories, the most incidents belonged to: Structure Fires (54.8%), and Outside Fires (26.4%).