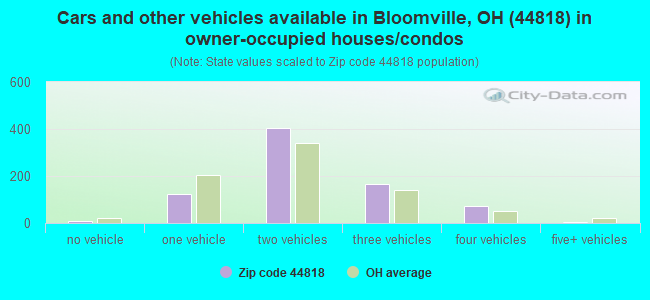
Estimated zip code population in 2022: 2,275 Zip code population in 2010: 2,644 Zip code population in 2000: 2,713
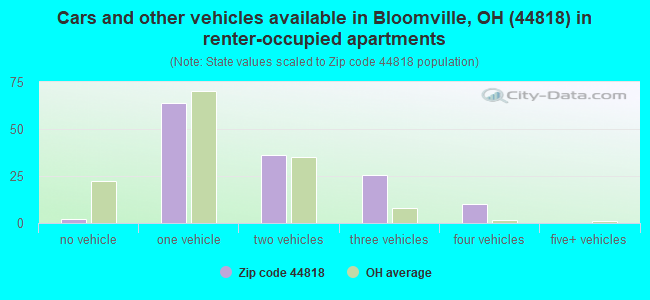
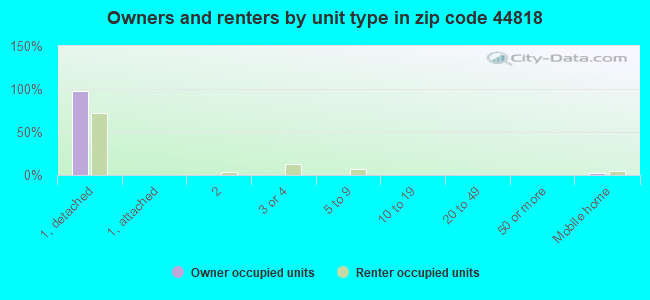
Houses and condos: 956 Renter-occupied apartments: 139
% of renters here:
15%
State:
33%
March 2022 cost of living index in zip code 44818: 82.1 (low, U.S. average is 100)
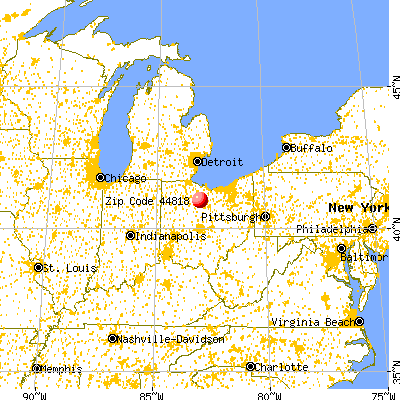
Land area: 73.1 sq. mi. Water area: 0.1 sq. mi.
Population density: 31 people per square mile
(very low).
OSM Map
General Map
Google Map
MSN Map
OSM Map
General Map
Google Map
MSN Map
OSM Map
General Map
Google Map
MSN Map
OSM Map
General Map
Google Map
MSN Map
Please wait while loading the map...
Real estate property taxes paid for housing units in 2022:
This zip code:
0.9% ($1,298)
Ohio:
1.3% ($2,639)
Median real estate property taxes paid for housing units with mortgages in 2022: $1,379 (1.1%) Median real estate property taxes paid for housing units with no mortgage in 2022: $1,249 (0.7%)
Business Search- 14 Million verified businesses
Males: 1,087
(47.8%)
Females: 1,188
(52.2%)
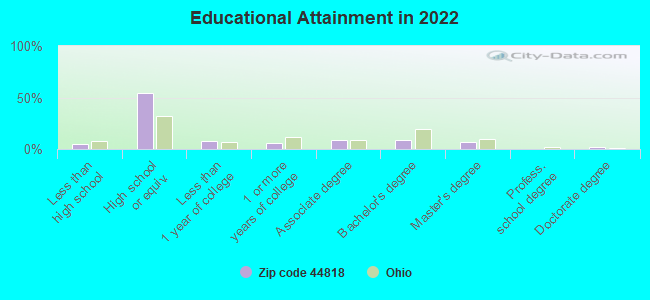
For population 25 years and over in 44818:
High school or higher: 94.4%
Bachelor's degree or higher: 17.6%
Graduate or professional degree: 9.3%
Unemployed: 4.3%
Mean travel time to work (commute): 27.9 minutes
For population 15 years and over in 44818:
Never married: 24.6%
Now married: 53.9%
Separated: 0.8%
Widowed: 9.3%
Divorced: 11.3%
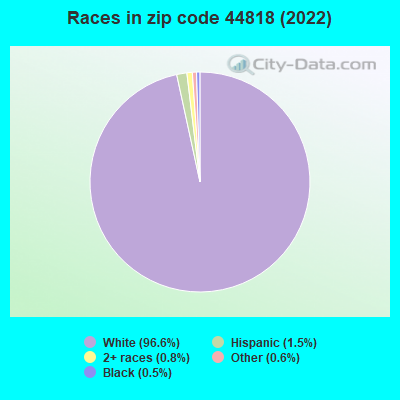
Zip code 44818 compared to state average:
Black race population percentage significantly below state average.
Hispanic race population percentage below state average.
Median age above state average.
Foreign-born population percentage significantly below state average.
Renting percentage below state average.
Length of stay since moving in significantly above state average.
House age above state average.
Number of college students below state average.
Percentage of population with a bachelor's degree or higher below state average.
Estimated median house/condo value in 2022: $146,979
44818:
$146,979
Ohio:
$204,100
According to our research of Ohio and other state lists, there were 5 registered sex offenders living in 44818 zip code as of May 28, 2024. The ratio of all residents to sex offenders in zip code 44818 is 509 to 1. The ratio of registered sex offenders to all residents in this zip code is near the state average.
Median resident age:
This zip code:
45.5 years
Ohio median age:
39.9 years
Average household size:
This zip code:
2.4 people
Ohio:
2.4 people
Averages for the 2020 tax year for zip code 44818, filed in 2021:
Average Adjusted Gross Income (AGI) in 2020: $51,074 (Individual Income Tax Returns)
Here:
$51,074
State:
$67,288
Salary/wage: $43,157 (reported on 83.2% of returns)
Here:
$43,157
State:
$55,628
(% of AGI for various income ranges: 1306.7% for AGIs below $25k, 3708.2% for AGIs $25k-50k, 6616.9% for AGIs $50k-75k, 10540.0% for AGIs $75k-100k, 17075.7% for AGIs $100k-200k)
Taxable interest for individuals: $679 (reported on 30.4% of returns)
This zip code:
$679
Ohio:
$1,518
(% of AGI for various income ranges: 18.9% for AGIs below $25k, 18.2% for AGIs $25k-50k, 23.1% for AGIs $50k-75k, 77.5% for AGIs $75k-100k, 81.4% for AGIs $100k-200k)
Ordinary dividends: $2,088 (reported on 19.2% of returns)
Here:
$2,088
State:
$7,167
(% of AGI for various income ranges: 25.9% for AGIs below $25k, 14.6% for AGIs $25k-50k, 51.9% for AGIs $50k-75k, 107.5% for AGIs $75k-100k, 315.7% for AGIs $100k-200k)
Net capital gain/loss in AGI: +$9,705 (reported on 16.8% of returns)
Here:
+$9,705
State:
+$18,919
(% of AGI for various income ranges: 17.4% for AGIs below $25k, 8.2% for AGIs $25k-50k, 85.0% for AGIs $50k-75k, 226.3% for AGIs $75k-100k, 2358.6% for AGIs $100k-200k)
Profit/loss from business: +$10,171 (reported on 11.2% of returns)
Here:
+$10,171
State:
+$13,744
(% of AGI for various income ranges: 69.3% for AGIs below $25k, 106.1% for AGIs $25k-50k, 340.6% for AGIs $50k-75k, 564.3% for AGIs $100k-200k)
Taxable individual retirement arrangement distribution: $10,838 (reported on 10.4% of returns)
44818:
$10,838
Ohio:
$18,876
(% of AGI for various income ranges: 56.7% for AGIs below $25k, 92.5% for AGIs $25k-50k, 288.8% for AGIs $50k-75k, 668.8% for AGIs $75k-100k)
Earned income credit: $2,347 (reported on 13.6% of returns)
Here:
$2,347
State:
$2,304
(% of AGI for various income ranges: 89.3% for AGIs below $25k, 56.4% for AGIs $25k-50k)
Percentage of individuals using paid preparers for their 2020 taxes: 96.0%
Here:
96%
State:
94%
(% for various income ranges: 95.0% for AGIs below $25k, 97.1% for AGIs $25k-50k, 95.7% for AGIs $50k-75k, 100.0% for AGIs $75k-100k, 92.9% for AGIs $100k-200k)
Averages for the 2012 tax year for zip code 44818, filed in 2013:
Average Adjusted Gross Income (AGI) in 2012: $44,114 (Individual Income Tax Returns)
Here:
$44,114
State:
$54,926
Salary/wage: $38,527 (reported on 84.0% of returns)
Here:
$38,527
State:
$45,869
(% of AGI for various income ranges: 72.8% for AGIs below $25k, 81.6% for AGIs $25k-50k, 73.3% for AGIs $50k-75k, 80.5% for AGIs $75k-100k, 58.8% for AGIs $100k-200k)
Taxable interest for individuals: $690 (reported on 32.8% of returns)
This zip code:
$690
Ohio:
$1,297
(% of AGI for various income ranges: 1.2% for AGIs below $25k, 0.4% for AGIs $25k-50k, 0.8% for AGIs $50k-75k, 0.2% for AGIs $75k-100k, 0.4% for AGIs $100k-200k)
Ordinary dividends: $1,425 (reported on 20.2% of returns)
Here:
$1,425
State:
$5,821
(% of AGI for various income ranges: 0.6% for AGIs below $25k, 0.1% for AGIs $25k-50k, 0.9% for AGIs $50k-75k, 0.3% for AGIs $75k-100k, 1.2% for AGIs $100k-200k)
Net capital gain/loss in AGI: +$2,079 (reported on 11.8% of returns)
Here:
+$2,079
State:
+$11,232
(% of AGI for various income ranges: 0.2% for AGIs below $25k, 0.7% for AGIs $75k-100k, 1.8% for AGIs $100k-200k)
Profit/loss from business: +$9,813 (reported on 12.6% of returns)
Here:
+$9,813
State:
+$12,773
(% of AGI for various income ranges: 4.0% for AGIs below $25k, 1.7% for AGIs $25k-50k, 3.1% for AGIs $50k-75k, 6.5% for AGIs $75k-100k)
Taxable individual retirement arrangement distribution: $7,955 (reported on 9.2% of returns)
44818:
$7,955
Ohio:
$14,511
(% of AGI for various income ranges: 3.0% for AGIs below $25k, 3.3% for AGIs $25k-50k, 2.8% for AGIs $75k-100k)
Total itemized deductions: $15,923 (21% of AGI, reported on 18.5% of returns)
Here:
$15,923
State:
$21,278
Here:
21.1% of AGI
State:
18.8% of AGI
(% of AGI for various income ranges: 6.7% for AGIs below $25k, 4.4% for AGIs $25k-50k, 6.2% for AGIs $50k-75k, 7.0% for AGIs $75k-100k, 9.2% for AGIs $100k-200k)
Charity contributions: $3,114 (reported on 11.8% of returns)
Here:
$3,114
State:
$3,943
(% of AGI for various income ranges: 0.6% for AGIs $25k-50k, 0.7% for AGIs $50k-75k, 0.5% for AGIs $75k-100k, 1.9% for AGIs $100k-200k)
Taxes paid: $5,659 (reported on 18.5% of returns)
44818:
$5,659
State:
$9,568
(% of AGI for various income ranges: 0.7% for AGIs below $25k, 1.3% for AGIs $25k-50k, 2.0% for AGIs $50k-75k, 2.7% for AGIs $75k-100k, 4.3% for AGIs $100k-200k)
Earned income credit: $2,125 (reported on 13.4% of returns)
Here:
$2,125
State:
$2,285
(% of AGI for various income ranges: 4.4% for AGIs below $25k, 0.9% for AGIs $25k-50k)
Percentage of individuals using paid preparers for their 2012 taxes: 66.4%
Here:
66%
State:
51%
(% for various income ranges: 56.8% for AGIs below $25k, 68.6% for AGIs $25k-50k, 73.7% for AGIs $50k-75k, 75.0% for AGIs $75k-100k, 77.8% for AGIs $100k-200k)
Averages for the 2004 tax year for zip code 44818, filed in 2005:
Average Adjusted Gross Income (AGI) in 2004: $31,622 (Individual Income Tax Returns)
Here:
$31,622
State:
$44,480
Salary/wage: $30,543 (reported on 85.7% of returns)
Here:
$30,543
State:
$39,198
(% of AGI for various income ranges: 118.2% for AGIs below $10k, 76.2% for AGIs $10k-25k, 84.1% for AGIs $25k-50k, 85.3% for AGIs $50k-75k, 79.5% for AGIs $75k-100k, 74.5% for AGIs over 100k)
Taxable interest for individuals: $760 (reported on 42.3% of returns)
This zip code:
$760
Ohio:
$1,532
(% of AGI for various income ranges: 5.9% for AGIs below $10k, 2.0% for AGIs $10k-25k, 1.1% for AGIs $25k-50k, 0.6% for AGIs $50k-75k, 0.4% for AGIs $75k-100k)
Taxable dividends: $974 (reported on 21.4% of returns)
Here:
$974
State:
$3,496
(% of AGI for various income ranges: 1.7% for AGIs below $10k, 1.0% for AGIs $10k-25k, 0.5% for AGIs $25k-50k, 0.8% for AGIs $50k-75k, 0.3% for AGIs $75k-100k, 0.5% for AGIs over 100k)
Net capital gain/loss: +$2,299 (reported on 16.2% of returns)
Here:
+$2,299
State:
+$8,582
(% of AGI for various income ranges: -2.1% for AGIs below $10k, 0.4% for AGIs $10k-25k, 0.6% for AGIs $25k-50k, 0.3% for AGIs $50k-75k, 2.9% for AGIs $75k-100k, 8.0% for AGIs over 100k)
Profit/loss from business: +$5,822 (reported on 12.0% of returns)
Here:
+$5,822
State:
+$10,813
(% of AGI for various income ranges: -10.3% for AGIs below $10k, 4.3% for AGIs $10k-25k, 2.0% for AGIs $25k-50k, 1.6% for AGIs $50k-75k, 4.8% for AGIs $75k-100k)
Profit/loss from farming: +$2,107 (reported on 9.7% of returns)
Here:
+$2,107
State:
-$3,706
(% of AGI for various income ranges: -15.6% for AGIs below $10k, 1.4% for AGIs $10k-25k, 1.2% for AGIs $25k-50k, 1.0% for AGIs $50k-75k)
IRA payment deduction: $2,000 (reported on 1.5% of returns)
44818:
$2,000
Ohio:
$2,794
Total itemized deductions: $11,679 (22% of AGI, reported on 19.0% of returns)
Here:
$11,679
State:
$17,503
Here:
21.6% of AGI
State:
20.8% of AGI
(% of AGI for various income ranges: 4.3% for AGIs $10k-25k, 6.3% for AGIs $25k-50k, 8.0% for AGIs $50k-75k, 10.7% for AGIs $75k-100k, 9.2% for AGIs over 100k)
Charity contributions deductions: $1,868 (3% of AGI, reported on 13.2% of returns)
Here:
$1,868
State:
$3,087
Here:
3.3% of AGI
State:
3.4% of AGI
(% of AGI for various income ranges: 0.4% for AGIs $10k-25k, 0.6% for AGIs $25k-50k, 0.9% for AGIs $50k-75k, 1.7% for AGIs $75k-100k, 0.4% for AGIs over 100k)
Total tax: $3,335 (reported on 73.9% of returns)
44818:
$3,335
State:
$6,781
(% of AGI for various income ranges: 4.1% for AGIs below $10k, 4.1% for AGIs $10k-25k, 6.7% for AGIs $25k-50k, 8.5% for AGIs $50k-75k, 10.6% for AGIs $75k-100k, 16.2% for AGIs over 100k)
Earned income credit: $1,565 (reported on 15.1% of returns)
Here:
$1,565
State:
$1,696
Percentage of individuals using paid preparers for their 2004 taxes: 63.2%
Here:
63%
State:
55%
(% for various income ranges: 55.4% for AGIs below $10k, 63.7% for AGIs $10k-25k, 64.6% for AGIs $25k-50k, 65.0% for AGIs $50k-75k, 71.9% for AGIs $75k-100k, 78.9% for AGIs over 100k)
Household received Food Stamps/SNAP in the past 12 months: 85 Household did not receive Food Stamps/SNAP in the past 12 months: 830
Women who had a birth in the past 12 months: 18 (16 now married, 2 unmarried) Women who did not have a birth in the past 12 months: 406 (222 now married, 183 unmarried)
Housing units in zip code 44818 with a mortgage: 341 (32 second mortgage, 31 both second mortgage and home equity loan) Houses without a mortgage: 4
Median monthly owner costs for units with a mortgage: $1,020 Median monthly owner costs for units without a mortgage: $394
Residents with income below the poverty level in 2022:
This zip code:
6.1%
Whole state:
13.4%
Residents with income below 50% of the poverty level in 2022:
This zip code:
4.5%
Whole state:
7.0%
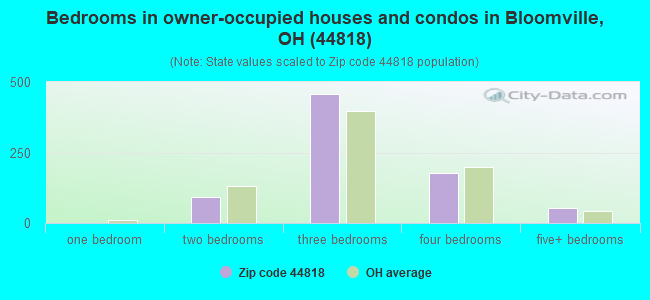
Median number of rooms in houses and condos:
Here:
6.8
State:
6.7
Median number of rooms in apartments:
Here:
6.7
State:
4.4
Notable locations in this zip code not listed on our city pages
Notable locations in zip code 44818: Bloom Township Fire and Emergency Medical Services Department (A), Chatfield Volunteer Fire Department (B), Lykens Township Fire Department (C), Bliss Memorial Public Library (D). Display/hide their locations on the map
Churches in zip code 44818 include: Nazareth Church (A), Pietist Church (B), Honey Creek Church (C), Saint Johns Church (D), College Hill Church (E), Bloomville United Methodist Church (F). Display/hide their locations on the map
Cemeteries: Saint Stephens Cemetery (1), Bloomville Cemetery (2), Buchman Cemetery (3), Dunkard Cemetery (4), Freewill Cemetery (5), Scipio Township Cemetery (6), Reformed Cemetery (7). Display/hide their locations on the map
In group quarters: 23 (-1 institutionalized population)
Size of family households: 427 2-persons, 117 3-persons, 80 4-persons, 39 5-persons, 32 6-persons, 17 7-or-more-persons
Size of nonfamily households: 152 1-person, 48 2-persons, 1 3-persons
345 married couples with children.
69 single-parent households (35 men, 34 women).
97.9% of residents of 44818 zip code speak English at home.
1.9% of residents speak Spanish at home (41% very well, 51% well, 7% not well).
0.2% of residents speak other Indo-European language at home (100% very well).
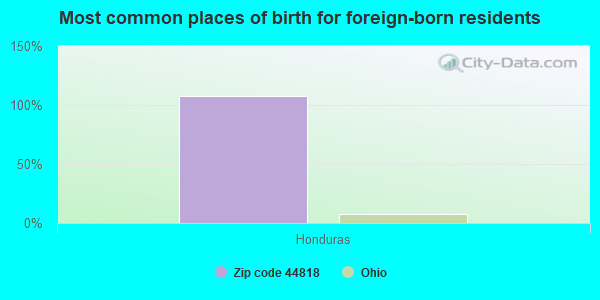
Foreign born population: 13 (0.6%) (23.4% of them are naturalized citizens)
This zip code:
0.6%
Whole state:
5.0%
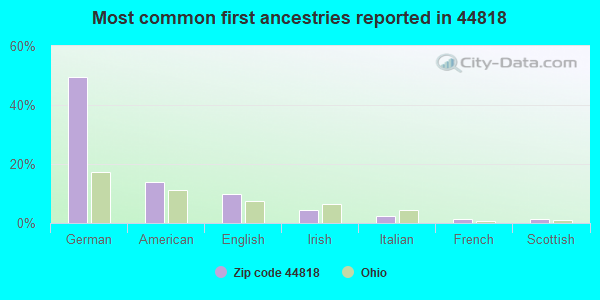
108%Honduras
49%German
14%American
10%English
5%Irish
2%Italian
1%French
1%Scottish
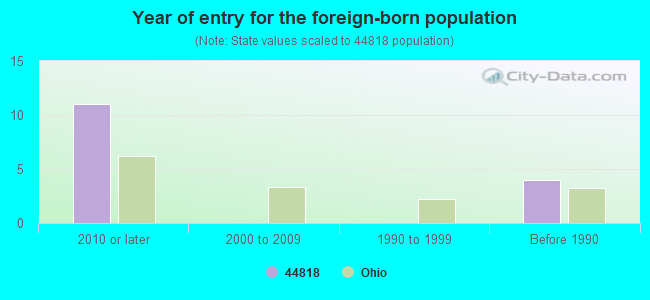
Year of entry for the foreign-born population
112010 or later
02000 to 2009
01990 to 1999
4Before 1990
Facilities with environmental interests located in this zip code:
BLOOMVILLE ELEMENTARY SCHOOL (69 S MARION ST in BLOOMVILLE, OH)
(National Center for Education Statistics) - STATE ID-002881 (National Center for Education Statistics) - STATE ID-146936 Organizations: TIFFIN CITY SD (SCHOOL DISTRICT)
, BUCKEYE CENTRAL (SCHOOL DISTRICT)
BLOOMVILLE STP (NORTH DOUGLAS STREET in BLOOMVILLE, OH)
STATE MASTER (Ohio general info) - PCS-OH0021032, National Pollutant Discharge Elimination System Permit National Pollutant Discharge Elimination System NON-MAJOR (Tracking pollutant discharge elimination systems) - permit Business SIC classification: SEWERAGE SYSTEMS Organizations: VILLAGE OF BLOOMVILLE (CONTACT/OWNER)
Alternative names: BLOOMVILLE, VILLAGE OF, BLOOMVILLE WWTP, VILLAGE OF BLOOMVILLE
Housing units lacking complete plumbing facilities: 2.0% Housing units lacking complete kitchen facilities: 1.6%
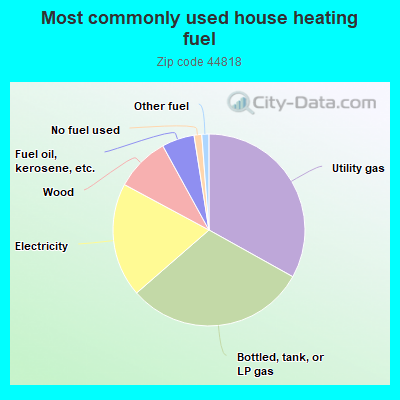
33.2%Utility gas
30.6%Bottled, tank, or LP gas
19.3%Electricity
9.2%Wood
5.5%Fuel oil, kerosene, etc.
1.3%No fuel used
1.2%Other fuel
Population in 1990: 2,572. Population change in the 1990s: +141 (+5.5%).
Place of birth for U.S.-born residents:
This state: 1,982
Northeast: 33
Midwest: 36
South: 96
West: 110
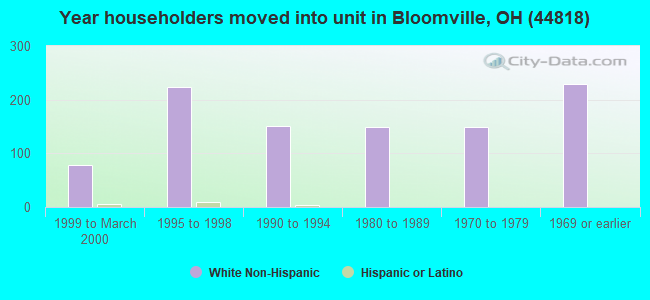
68% of the 44818 zip code residents lived in the same house 5 years ago. Out of people who lived in different houses, 63% lived in this county. Out of people who lived in different counties, 50% lived in Ohio.
95% of the 44818 zip code residents lived in the same house 1 year ago. Out of people who lived in different houses, 45% moved from this county. Out of people who lived in different houses, 51% moved from different county within same state. Out of people who lived in different houses, 13% moved from different state.
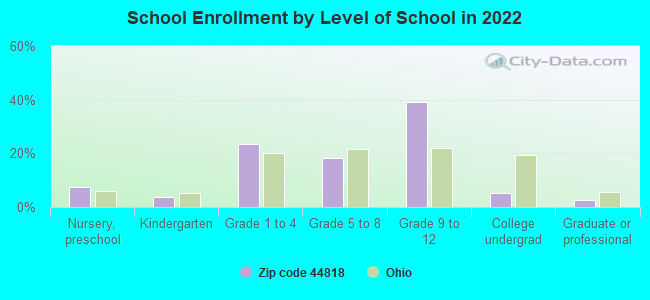
Private vs. public school enrollment:
Students in private schools in grades 1 to 8 (elementary and middle school): 10
Here:
5.3%
Ohio:
16.0%
Students in private schools in grades 9 to 12 (high school): 23
Here:
12.7%
Ohio:
13.1%
Students in private undergraduate colleges:
Here:
0.0%
Ohio:
22.3%
Occupation by median earnings in the past 12 months ($)
78,205Education, training, and library occupations
66,036Transportation occupations
55,629Management occupations
55,494Construction and extraction occupations
54,225Health diagnosing and treating practitioners and other technical occupations
52,488Installation, maintenance, and repair occupations
Companies with federal contracts located in this zip code:
GERICO ENVIRONMENTAL, INC. (4809 EAST TOWNSHIP ROAD 58 in BLOOMVILLE, OH; small business) : $80,621 in 17 contractsfrom 1999 to 2000
Contracts for Maintenance, Repair or Alteration of Real Property -- Other Industrial Buildings by Navy Signed by year:2000: $60,689; 2001: $0; 2002: $0; 2003: $0; 2004: $0; 2005: $0; 2006: $0.
Biggest contracts:
$46,346 with Navy for Maintenance, Repair or Alteration of Real Property -- Other Industrial Buildings. Taking place in NC. Signed on 2000-03-14. Completion date: 2000-04-03.
$8,117, same as above.Signed on 1999-12-02. Completion date: 1999-12-30.
$6,600, same as above.Signed on 1999-12-29. Completion date: 2000-01-24.
$6,403, same as above.Signed on 2000-03-27. Completion date: 2000-04-03.
Top industries in this zip code by the number of employees in 2005:
Health Care and Social Assistance: Nursing Care Facilities (20-49 employees: 1 establishment)
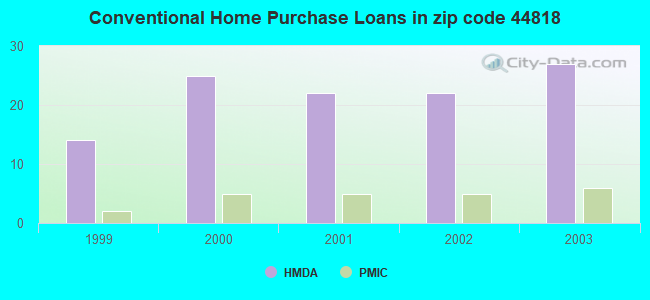
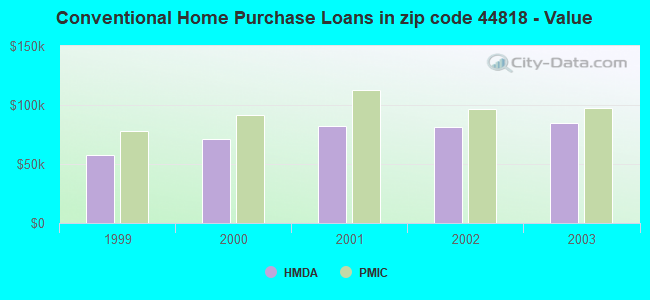
Detailed PMIC statistics for the following Tracts:9741.00
, 9742.00
2002 - 2018 National Fire Incident Reporting System (NFIRS) incidents
According to the data from the years 2002 - 2018 the average number of fire incidents per year is 12. The highest number of reported fire incidents - 18 took place in 2007, and the least - 5 in 2013. The data has a declining trend.
When looking into fire subcategories, the most reports belonged to: Structure Fires (47.1%), and Outside Fires (37.0%).
Fire incident types reported to NFIRS in Zip Code 44818


+$2,107
-$3,706
(% of AGI for various income ranges: -15.6% for AGIs below $10k, 1.4% for AGIs $10k-25k, 1.2% for AGIs $25k-50k, 1.0% for AGIs $50k-75k) Nearest zip codes: 44825, 44807, 44854, 44867, 44882, 44881.
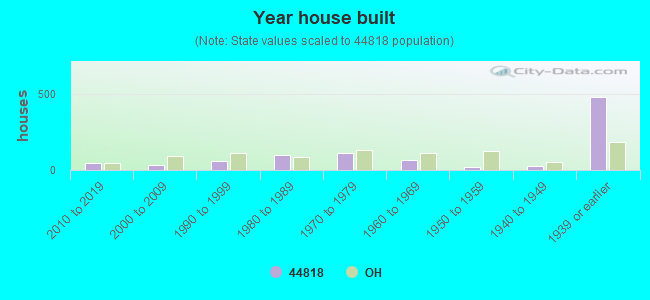


 According to the data from the years 2002 - 2018 the average number of fire incidents per year is 12. The highest number of reported fire incidents - 18 took place in 2007, and the least - 5 in 2013. The data has a declining trend.
 When looking into fire subcategories, the most reports belonged to: Structure Fires (47.1%), and Outside Fires (37.0%).