Estimated zip code population in 2022: 1,498 Zip code population in 2010: 1,749 Zip code population in 2000: 1,923
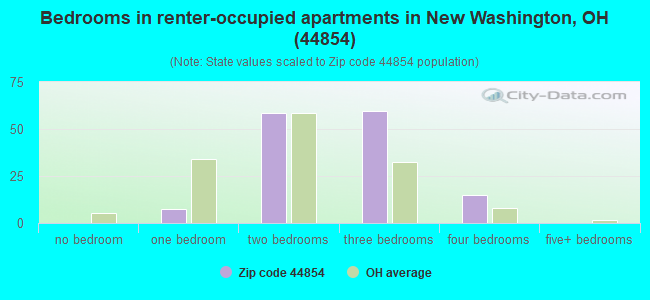
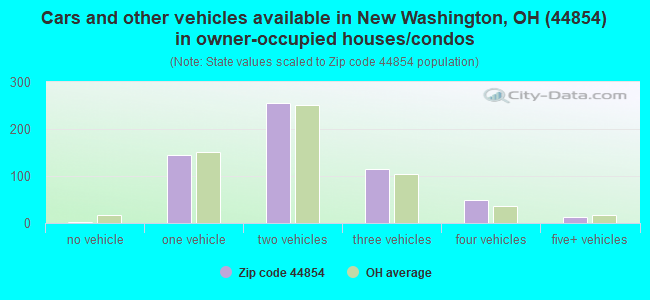
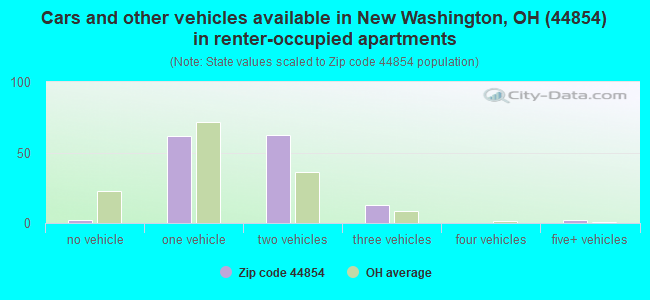
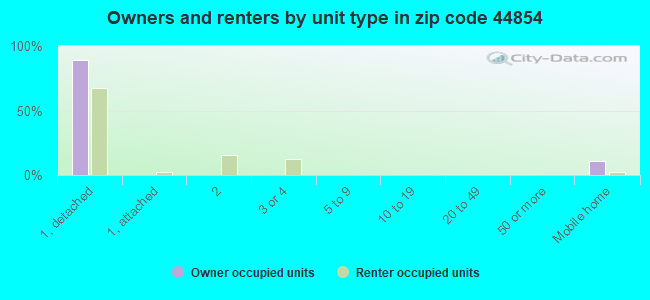
Houses and condos: 751 Renter-occupied apartments: 141
% of renters here:
20%
State:
33%
March 2022 cost of living index in zip code 44854: 83.4 (less than average, U.S. average is 100)
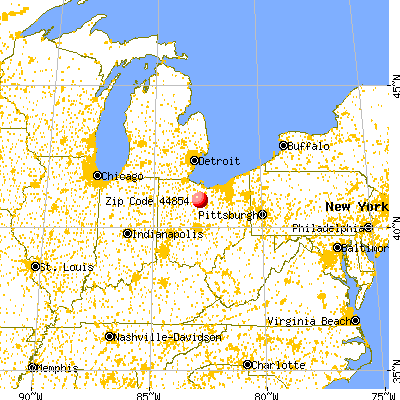
Land area: 38.9 sq. mi. Water area: 0.0 sq. mi.
Population density: 38 people per square mile
(very low).
OSM Map
General Map
Google Map
MSN Map
OSM Map
General Map
Google Map
MSN Map
OSM Map
General Map
Google Map
MSN Map
OSM Map
General Map
Google Map
MSN Map
Please wait while loading the map...
Real estate property taxes paid for housing units in 2022:
This zip code:
1.0% ($1,411)
Ohio:
1.3% ($2,639)
Median real estate property taxes paid for housing units with mortgages in 2022: $1,509 (1.1%) Median real estate property taxes paid for housing units with no mortgage in 2022: $1,329 (1.0%)
Business Search- 14 Million verified businesses
Males: 833
(55.6%)
Females: 665
(44.4%)
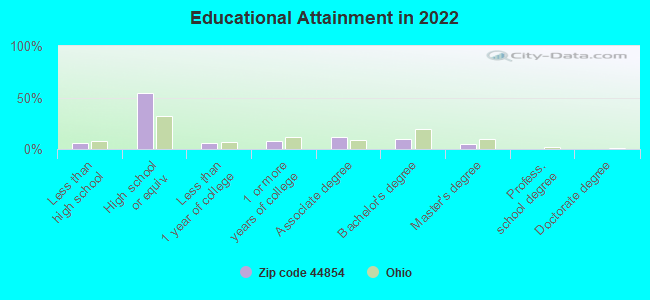
For population 25 years and over in 44854:
High school or higher: 92.2%
Bachelor's degree or higher: 14.2%
Graduate or professional degree: 4.7%
Unemployed: 0.4%
Mean travel time to work (commute): 25.7 minutes
For population 15 years and over in 44854:
Never married: 24.9%
Now married: 57.5%
Separated: 1.6%
Widowed: 3.4%
Divorced: 12.6%
Zip code 44854 compared to state average:
Unemployed percentage significantly below state average.
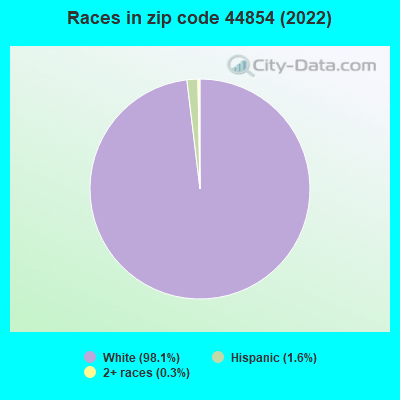
Black race population percentage significantly below state average.
Hispanic race population percentage below state average.
Foreign-born population percentage significantly below state average.
Renting percentage below state average.
Length of stay since moving in significantly above state average.
Percentage of population with a bachelor's degree or higher below state average.
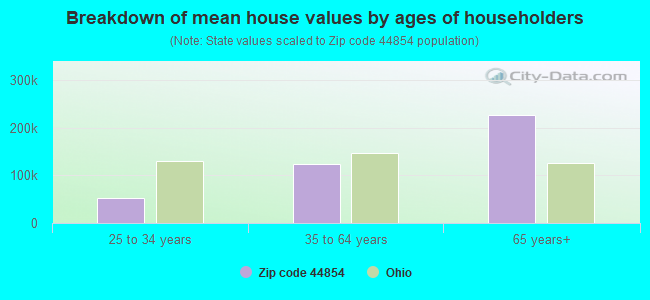
Estimated median house/condo value in 2022: $140,075
44854:
$140,075
Ohio:
$204,100
Median resident age:
This zip code:
42.8 years
Ohio median age:
39.9 years
Average household size:
This zip code:
2.1 people
Ohio:
2.4 people
Averages for the 2020 tax year for zip code 44854, filed in 2021:
Average Adjusted Gross Income (AGI) in 2020: $57,541 (Individual Income Tax Returns)
Here:
$57,541
State:
$67,288
Salary/wage: $47,012 (reported on 80.2% of returns)
Here:
$47,012
State:
$55,628
(% of AGI for various income ranges: 1125.6% for AGIs below $25k, 3878.9% for AGIs $25k-50k, 5920.9% for AGIs $50k-75k, 11452.0% for AGIs $75k-100k, 21515.0% for AGIs $100k-200k)
Taxable interest for individuals: $1,009 (reported on 37.4% of returns)
This zip code:
$1,009
Ohio:
$1,518
(% of AGI for various income ranges: 23.8% for AGIs below $25k, 28.4% for AGIs $25k-50k, 35.5% for AGIs $50k-75k, 122.0% for AGIs $75k-100k, 251.7% for AGIs $100k-200k)
Ordinary dividends: $3,614 (reported on 24.2% of returns)
Here:
$3,614
State:
$7,167
(% of AGI for various income ranges: 33.1% for AGIs below $25k, 36.3% for AGIs $25k-50k, 125.5% for AGIs $50k-75k, 152.0% for AGIs $75k-100k, 765.0% for AGIs $100k-200k)
Net capital gain/loss in AGI: +$6,860 (reported on 22.0% of returns)
Here:
+$6,860
State:
+$18,919
(% of AGI for various income ranges: 12.5% for AGIs below $25k, 86.3% for AGIs $25k-50k, 190.0% for AGIs $50k-75k, 1631.7% for AGIs $100k-200k)
Profit/loss from business: +$6,833 (reported on 9.9% of returns)
Here:
+$6,833
State:
+$13,744
(% of AGI for various income ranges: 101.9% for AGIs below $25k, 77.3% for AGIs $50k-75k, 611.7% for AGIs $100k-200k)
Taxable individual retirement arrangement distribution: $12,650 (reported on 15.4% of returns)
44854:
$12,650
Ohio:
$18,876
(% of AGI for various income ranges: 201.9% for AGIs below $25k, 172.1% for AGIs $25k-50k, 400.9% for AGIs $50k-75k, 1133.3% for AGIs $100k-200k)
Earned income credit: $1,957 (reported on 7.7% of returns)
Here:
$1,957
State:
$2,304
(% of AGI for various income ranges: 49.4% for AGIs below $25k, 30.5% for AGIs $25k-50k)
Percentage of individuals using paid preparers for their 2020 taxes: 96.7%
Here:
97%
State:
94%
(% for various income ranges: 92.9% for AGIs below $25k, 96.2% for AGIs $25k-50k, 100.0% for AGIs $50k-75k, 100.0% for AGIs $75k-100k, 100.0% for AGIs $100k-200k)
Averages for the 2012 tax year for zip code 44854, filed in 2013:
Average Adjusted Gross Income (AGI) in 2012: $46,598 (Individual Income Tax Returns)
Here:
$46,598
State:
$54,926
Salary/wage: $38,232 (reported on 79.1% of returns)
Here:
$38,232
State:
$45,869
(% of AGI for various income ranges: 66.1% for AGIs below $25k, 75.7% for AGIs $25k-50k, 78.0% for AGIs $50k-75k, 66.6% for AGIs $75k-100k, 47.2% for AGIs $100k-200k)
Taxable interest for individuals: $826 (reported on 42.9% of returns)
This zip code:
$826
Ohio:
$1,297
(% of AGI for various income ranges: 2.6% for AGIs below $25k, 0.7% for AGIs $25k-50k, 0.6% for AGIs $50k-75k, 0.4% for AGIs $75k-100k, 0.5% for AGIs $100k-200k)
Ordinary dividends: $2,188 (reported on 28.6% of returns)
Here:
$2,188
State:
$5,821
(% of AGI for various income ranges: 2.7% for AGIs below $25k, 1.0% for AGIs $25k-50k, 1.5% for AGIs $50k-75k, 0.7% for AGIs $75k-100k, 1.5% for AGIs $100k-200k)
Net capital gain/loss in AGI: +$5,300 (reported on 18.7% of returns)
Here:
+$5,300
State:
+$11,232
(% of AGI for various income ranges: 0.2% for AGIs $25k-50k, 0.1% for AGIs $50k-75k, 0.2% for AGIs $75k-100k, 6.6% for AGIs $100k-200k)
Profit/loss from business: +$6,036 (reported on 12.1% of returns)
Here:
+$6,036
State:
+$12,773
(% of AGI for various income ranges: 2.4% for AGIs below $25k, 2.6% for AGIs $25k-50k, 4.3% for AGIs $75k-100k)
Taxable individual retirement arrangement distribution: $7,550 (reported on 15.4% of returns)
44854:
$7,550
Ohio:
$14,511
(% of AGI for various income ranges: 5.6% for AGIs below $25k, 4.5% for AGIs $25k-50k, 5.5% for AGIs $75k-100k)
Total itemized deductions: $17,395 (20% of AGI, reported on 22.0% of returns)
Here:
$17,395
State:
$21,278
Here:
20.0% of AGI
State:
18.8% of AGI
(% of AGI for various income ranges: 8.5% for AGIs below $25k, 6.5% for AGIs $25k-50k, 9.9% for AGIs $50k-75k, 7.5% for AGIs $75k-100k, 8.8% for AGIs $100k-200k)
Charity contributions: $3,120 (reported on 16.5% of returns)
Here:
$3,120
State:
$3,943
(% of AGI for various income ranges: 1.0% for AGIs $25k-50k, 1.1% for AGIs $50k-75k, 1.0% for AGIs $75k-100k, 1.6% for AGIs $100k-200k)
Taxes paid: $6,305 (reported on 22.0% of returns)
44854:
$6,305
State:
$9,568
(% of AGI for various income ranges: 0.8% for AGIs below $25k, 1.4% for AGIs $25k-50k, 2.9% for AGIs $50k-75k, 2.8% for AGIs $75k-100k, 5.0% for AGIs $100k-200k)
Earned income credit: $1,908 (reported on 13.2% of returns)
Here:
$1,908
State:
$2,285
(% of AGI for various income ranges: 4.0% for AGIs below $25k, 0.8% for AGIs $25k-50k)
Percentage of individuals using paid preparers for their 2012 taxes: 71.4%
Here:
71%
State:
51%
(% for various income ranges: 64.7% for AGIs below $25k, 74.1% for AGIs $25k-50k, 71.4% for AGIs $50k-75k, 87.5% for AGIs $75k-100k, 75.0% for AGIs $100k-200k)
Averages for the 2004 tax year for zip code 44854, filed in 2005:
Average Adjusted Gross Income (AGI) in 2004: $36,502 (Individual Income Tax Returns)
Here:
$36,502
State:
$44,480
Salary/wage: $33,316 (reported on 82.9% of returns)
Here:
$33,316
State:
$39,198
(% of AGI for various income ranges: 73.1% for AGIs below $10k, 71.1% for AGIs $10k-25k, 81.4% for AGIs $25k-50k, 80.1% for AGIs $50k-75k, 74.8% for AGIs $75k-100k, 56.2% for AGIs over 100k)
Taxable interest for individuals: $1,382 (reported on 57.7% of returns)
This zip code:
$1,382
Ohio:
$1,532
(% of AGI for various income ranges: 12.4% for AGIs below $10k, 4.5% for AGIs $10k-25k, 2.2% for AGIs $25k-50k, 1.2% for AGIs $50k-75k, 1.4% for AGIs $75k-100k, 0.9% for AGIs over 100k)
Taxable dividends: $2,490 (reported on 37.5% of returns)
Here:
$2,490
State:
$3,496
(% of AGI for various income ranges: 3.8% for AGIs below $10k, 3.2% for AGIs $10k-25k, 0.9% for AGIs $25k-50k, 0.8% for AGIs $50k-75k, 2.0% for AGIs $75k-100k, 10.7% for AGIs over 100k)
Net capital gain/loss: +$1,605 (reported on 27.5% of returns)
Here:
+$1,605
State:
+$8,582
(% of AGI for various income ranges: -1.4% for AGIs below $10k, 0.7% for AGIs $10k-25k, 0.5% for AGIs $25k-50k, 1.7% for AGIs $50k-75k, 1.0% for AGIs $75k-100k, 3.5% for AGIs over 100k)
Profit/loss from business: +$5,821 (reported on 14.4% of returns)
Here:
+$5,821
State:
+$10,813
(% of AGI for various income ranges: 2.8% for AGIs $10k-25k, 3.1% for AGIs $25k-50k, 0.3% for AGIs $50k-75k, 5.4% for AGIs $75k-100k)
Profit/loss from farming: +$1,886 (reported on 7.5% of returns)
Here:
+$1,886
State:
-$3,706
(% of AGI for various income ranges: 0.6% for AGIs $10k-25k, 0.7% for AGIs $25k-50k, 0.1% for AGIs $50k-75k, 0.5% for AGIs $75k-100k)
IRA payment deduction: $2,720 (reported on 2.7% of returns)
44854:
$2,720
Ohio:
$2,794
Total itemized deductions: $12,968 (21% of AGI, reported on 23.2% of returns)
Here:
$12,968
State:
$17,503
Here:
20.7% of AGI
State:
20.8% of AGI
(% of AGI for various income ranges: 5.9% for AGIs $10k-25k, 7.2% for AGIs $25k-50k, 7.5% for AGIs $50k-75k, 10.7% for AGIs $75k-100k, 13.6% for AGIs over 100k)
Charity contributions deductions: $2,608 (4% of AGI, reported on 18.4% of returns)
Here:
$2,608
State:
$3,087
Here:
3.9% of AGI
State:
3.4% of AGI
(% of AGI for various income ranges: 0.7% for AGIs $10k-25k, 1.1% for AGIs $25k-50k, 0.9% for AGIs $50k-75k, 1.9% for AGIs $75k-100k, 2.9% for AGIs over 100k)
Total tax: $4,049 (reported on 79.6% of returns)
44854:
$4,049
State:
$6,781
(% of AGI for various income ranges: 1.6% for AGIs below $10k, 5.0% for AGIs $10k-25k, 7.0% for AGIs $25k-50k, 8.8% for AGIs $50k-75k, 10.5% for AGIs $75k-100k, 17.4% for AGIs over 100k)
Earned income credit: $1,522 (reported on 7.4% of returns)
Here:
$1,522
State:
$1,696
Percentage of individuals using paid preparers for their 2004 taxes: 67.7%
Here:
68%
State:
55%
(% for various income ranges: 58.8% for AGIs below $10k, 64.8% for AGIs $10k-25k, 68.5% for AGIs $25k-50k, 73.3% for AGIs $50k-75k, 73.3% for AGIs $75k-100k, 96.0% for AGIs over 100k)
Likely homosexual households (counted as self-reported same-sex unmarried-partner households)
Lesbian couples: 0.0% of all households
Gay men: 0.6% of all households
Household received Food Stamps/SNAP in the past 12 months: 26 Household did not receive Food Stamps/SNAP in the past 12 months: 688
Women who had a birth in the past 12 months: 8 (3 now married, 5 unmarried) Women who did not have a birth in the past 12 months: 313 (163 now married, 150 unmarried)
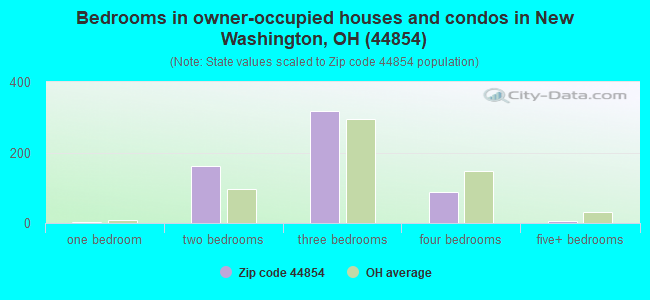
Housing units in zip code 44854 with a mortgage: 284 (19 second mortgage, 3 home equity loan, 16 both second mortgage and home equity loan) Houses without a mortgage: 101
Median monthly owner costs for units with a mortgage: $974 Median monthly owner costs for units without a mortgage: $511
Residents with income below the poverty level in 2022:
This zip code:
5.7%
Whole state:
13.4%
Residents with income below 50% of the poverty level in 2022:
This zip code:
5.0%
Whole state:
7.0%
Median number of rooms in houses and condos:
Here:
6.6
State:
6.7
Median number of rooms in apartments:
Here:
6.0
State:
4.4
Notable locations in this zip code not listed on our city pages
Notable locations in zip code 44854: Cranberry Hills Golf Course (A), Ackerman Farms (B), New Washington Fire Department (C). Display/hide their locations on the map
Cemeteries: Swaab Cemetery (1), Union Cemetery (2), Goodwill Cemetery (3), Brenner Cemetery (4), Lutheran Cemetery (5), Saint Bernard Cemetery (6). Display/hide their locations on the map
Size of family households: 219 2-persons, 115 3-persons, 55 4-persons, 17 5-persons, 2 6-persons, 21 7-or-more-persons
Size of nonfamily households: 243 1-person, 42 2-persons
203 married couples with children.
61 single-parent households (9 men, 52 women).
99.6% of residents of 44854 zip code speak English at home.
Foreign born population: 0 (0.0%)
:
0.0%
Whole state:
5.0%
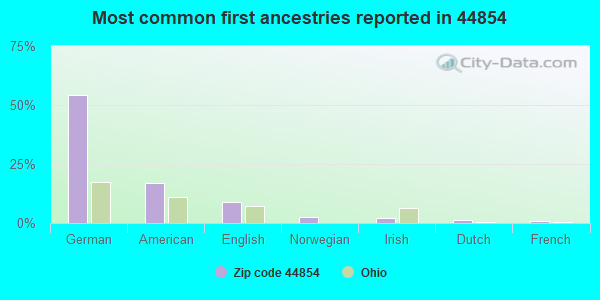
54%German
17%American
9%English
3%Norwegian
2%Irish
1%Dutch
1%French
Facilities with environmental interests located in this zip code:
BUCKEYE CENTRAL HIGH SCHOOL (306 S KIBLER ST in NEW WASHINGTON, OH)
(Geographic Names Information System) (National Center for Education Statistics) - STATE ID-004085 Organizations: BUCKEYE CENTRAL LOCAL SD (SCHOOL DISTRICT)
C E WHITE CO THE (417 N KIBLER ST in NEW WASHINGTON, OH)
(Resource Conservation and Recovery Act (tracking hazardous waste)) Organizations: WHITE CLAYTON E (CONTACT/OWNER)
BUCKEYE CENTRAL LOCAL SD (306 S KIBLER ST in NEW WASHINGTON, OH)
COMPLIANCE ACTIVITY (Tracking inspections of insecticide, fungicide, and rodenticide, and toxic substances)
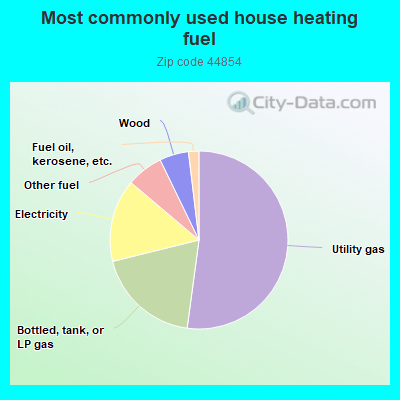
52.4%Utility gas
19.1%Bottled, tank, or LP gas
15.1%Electricity
6.7%Other fuel
5.3%Wood
1.9%Fuel oil, kerosene, etc.
Population in 1990: 1,679. Population change in the 1990s: +244 (+14.5%).
Place of birth for U.S.-born residents:
This state: 1,348
Northeast: 5
Midwest: 54
South: 68
West: 19
71% of the 44854 zip code residents lived in the same house 5 years ago. Out of people who lived in different houses, 45% lived in this county. Out of people who lived in different counties, 50% lived in Ohio.
91% of the 44854 zip code residents lived in the same house 1 year ago. Out of people who lived in different houses, 56% moved from this county. Out of people who lived in different houses, 43% moved from different county within same state.
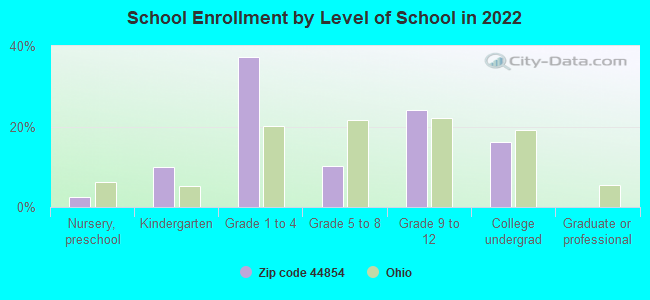
Private vs. public school enrollment:
Students in private schools in grades 1 to 8 (elementary and middle school):
Here:
0.0%
Ohio:
16.0%
Students in private schools in grades 9 to 12 (high school):
Here:
0.0%
Ohio:
13.1%
Students in private undergraduate colleges: 5
Here:
11.9%
Ohio:
22.3%
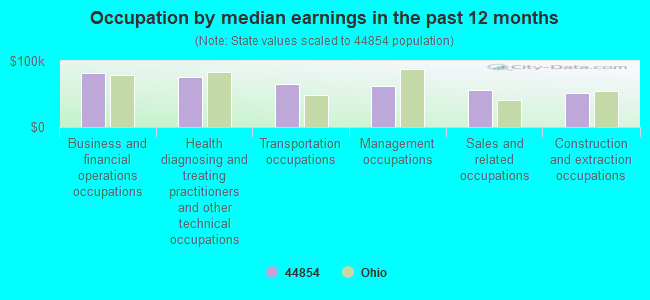
Occupation by median earnings in the past 12 months ($)
82,089Business and financial operations occupations
76,097Health diagnosing and treating practitioners and other technical occupations
65,476Transportation occupations
62,145Management occupations
56,581Sales and related occupations
51,907Construction and extraction occupations
Top industries in this zip code by the number of employees in 2005:
Other Services (except Public Administration): Religious Organizations (20-49 employees: 1 establishment, 10-19 employees: 1 establishment, 1-4 employees: 1 establishment)
Construction: Masonry Contractors (20-49: 1)
Finance and Insurance: Commercial Banking (20-49: 1)
Administrative and Support and Waste Management and Remediation Services: Landscaping Services (10-19: 1, 5-9: 1)
Accommodation and Food Services: Limited-Service Restaurants (10-19: 1, 1-4: 1)
People in group quarters in 2000:
35 people in nursing homes
25 people in other group homes
4 people in religious group quarters
Fatal accident statistics in 2014:
Fatal accident count: 1
Vehicles involved in fatal accidents: 1
Fatal accidents caused by drunken drivers: 0
Fatalities: 1
Persons involved in fatal accidents: 1
Pedestrians involved in fatal accidents: 1
Fatal accident statistics in 2010:
Fatal accident count: 1
Vehicles involved in fatal accidents: 1
Fatal accidents caused by drunken drivers: 0
Fatalities: 1
Persons involved in fatal accidents: 1
Pedestrians involved in fatal accidents: 0
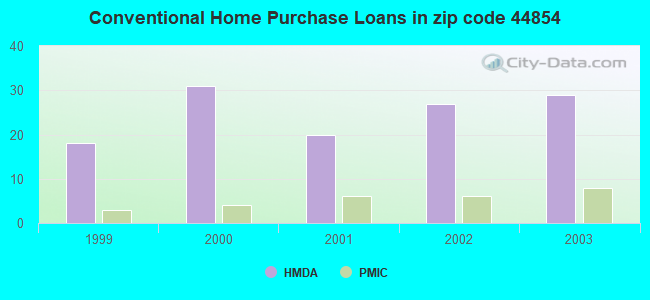
Home Mortgage Disclosure Act Aggregated Statistics For Year 2003 (Based on 2 partial tracts)
A) FHA, FSA/RHS & VA Home Purchase Loans
B) Conventional Home Purchase Loans
C) Refinancings
D) Home Improvement Loans
F) Non-occupant Loans on < 5 Family Dwellings (A B C & D)
Number
Average Value
Number
Average Value
Number
Average Value
Number
Average Value
Number
Average Value
LOANS ORIGINATED
4
$94,012
29
$72,693
97
$77,996
9
$32,291
7
$30,043
APPLICATIONS APPROVED, NOT ACCEPTED
1
$89,080
4
$89,815
13
$91,556
1
$43,080
1
$25,560
APPLICATIONS DENIED
0
$0
4
$67,178
50
$84,207
4
$9,858
2
$63,160
APPLICATIONS WITHDRAWN
1
$50,380
2
$69,735
19
$98,308
0
$0
1
$27,020
FILES CLOSED FOR INCOMPLETENESS
1
$57,690
1
$83,970
5
$80,176
0
$0
0
$0
Aggregated Statistics For Year 2002 (Based on 2 partial tracts)
B) Conventional Home Purchase Loans
C) Refinancings
D) Home Improvement Loans
F) Non-occupant Loans on < 5 Family Dwellings (A B C & D)
Number
Average Value
Number
Average Value
Number
Average Value
Number
Average Value
LOANS ORIGINATED
27
$74,967
74
$70,829
11
$24,561
5
$63,966
APPLICATIONS APPROVED, NOT ACCEPTED
1
$95,660
12
$79,835
5
$10,954
0
$0
APPLICATIONS DENIED
7
$54,139
41
$79,093
2
$79,590
1
$169,410
APPLICATIONS WITHDRAWN
2
$69,370
30
$83,218
1
$87,620
1
$36,510
FILES CLOSED FOR INCOMPLETENESS
0
$0
7
$97,326
0
$0
0
$0
Aggregated Statistics For Year 2001 (Based on 2 partial tracts)
A) FHA, FSA/RHS & VA Home Purchase Loans
B) Conventional Home Purchase Loans
C) Refinancings
D) Home Improvement Loans
F) Non-occupant Loans on < 5 Family Dwellings (A B C & D)
Number
Average Value
Number
Average Value
Number
Average Value
Number
Average Value
Number
Average Value
LOANS ORIGINATED
2
$99,670
20
$83,608
71
$66,469
15
$23,367
4
$34,320
APPLICATIONS APPROVED, NOT ACCEPTED
1
$105,880
1
$13,870
7
$71,351
2
$20,445
0
$0
APPLICATIONS DENIED
0
$0
6
$75,088
26
$82,962
5
$21,906
1
$100,040
APPLICATIONS WITHDRAWN
0
$0
1
$121,940
28
$82,512
3
$4,867
0
$0
FILES CLOSED FOR INCOMPLETENESS
0
$0
2
$59,875
4
$99,490
0
$0
0
$0
Aggregated Statistics For Year 2000 (Based on 2 partial tracts)
A) FHA, FSA/RHS & VA Home Purchase Loans
B) Conventional Home Purchase Loans
C) Refinancings
D) Home Improvement Loans
F) Non-occupant Loans on < 5 Family Dwellings (A B C & D)
Number
Average Value
Number
Average Value
Number
Average Value
Number
Average Value
Number
Average Value
LOANS ORIGINATED
4
$72,472
31
$70,641
30
$58,051
20
$15,882
3
$70,343
APPLICATIONS APPROVED, NOT ACCEPTED
1
$111,720
7
$62,380
8
$52,482
5
$11,684
0
$0
APPLICATIONS DENIED
0
$0
18
$38,619
25
$67,441
4
$15,518
0
$0
APPLICATIONS WITHDRAWN
0
$0
2
$109,530
12
$49,410
0
$0
0
$0
FILES CLOSED FOR INCOMPLETENESS
0
$0
1
$59,880
2
$73,020
0
$0
0
$0
Aggregated Statistics For Year 1999 (Based on 1 partial tract)
A) FHA, FSA/RHS & VA Home Purchase Loans
B) Conventional Home Purchase Loans
C) Refinancings
D) Home Improvement Loans
F) Non-occupant Loans on < 5 Family Dwellings (A B C & D)
Detailed PMIC statistics for the following Tracts:9741.00
2002 - 2018 National Fire Incident Reporting System (NFIRS) incidents
According to the data from the years 2002 - 2018 the average number of fires per year is 7. The highest number of fire incidents - 12 took place in 2016, and the least - 2 in 2006. The data has a dropping trend.
When looking into fire subcategories, the most incidents belonged to: Structure Fires (62.9%), and Outside Fires (29.8%).
Fire incident types reported to NFIRS in Zip Code 44854


+$1,886
-$3,706
(% of AGI for various income ranges: 0.6% for AGIs $10k-25k, 0.7% for AGIs $25k-50k, 0.1% for AGIs $50k-75k, 0.5% for AGIs $75k-100k) Nearest zip codes: 44881, 44825, 44887, 44807, 44818, 44856.


 According to the data from the years 2002 - 2018 the average number of fires per year is 7. The highest number of fire incidents - 12 took place in 2016, and the least - 2 in 2006. The data has a dropping trend.
 When looking into fire subcategories, the most incidents belonged to: Structure Fires (62.9%), and Outside Fires (29.8%).