Estimated zip code population in 2022: 3,251 Zip code population in 2010: 2,857 Zip code population in 2000: 2,705
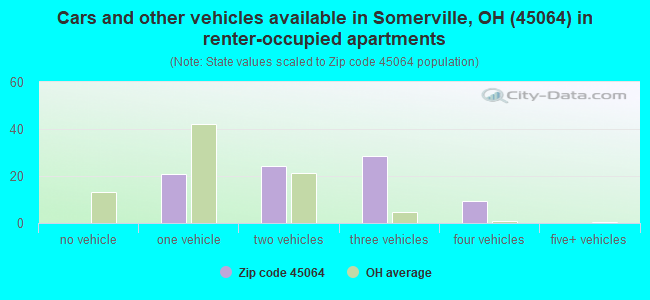
Houses and condos: 1,193 Renter-occupied apartments: 85
% of renters here:
7%
State:
33%
March 2022 cost of living index in zip code 45064: 81.7 (low, U.S. average is 100)
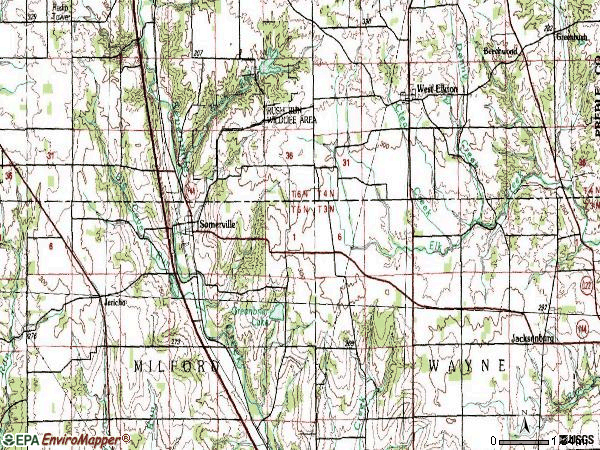
Land area: 31.6 sq. mi. Water area: 0.2 sq. mi.
Population density: 103 people per square mile
(very low).
OSM Map
General Map
Google Map
MSN Map
OSM Map
General Map
Google Map
MSN Map
OSM Map
General Map
Google Map
MSN Map
OSM Map
General Map
Google Map
MSN Map
Please wait while loading the map...
Real estate property taxes paid for housing units in 2022:
This zip code:
0.9% ($2,026)
Ohio:
1.3% ($2,639)
Median real estate property taxes paid for housing units with mortgages in 2022: $2,203 (0.9%) Median real estate property taxes paid for housing units with no mortgage in 2022: $1,876 (0.8%)
Business Search- 14 Million verified businesses
Males: 1,692
(52.1%)
Females: 1,559
(47.9%)
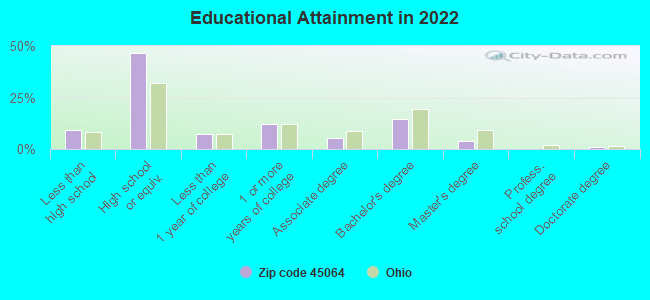
For population 25 years and over in 45064:
High school or higher: 89.9%
Bachelor's degree or higher: 18.8%
Graduate or professional degree: 4.6%
Unemployed: 1.2%
Mean travel time to work (commute): 34.0 minutes
For population 15 years and over in 45064:
Never married: 29.9%
Now married: 55.2%
Separated: 0.7%
Widowed: 6.7%
Divorced: 7.4%
Zip code 45064 compared to state average:
Unemployed percentage significantly below state average.
Black race population percentage significantly below state average.
Hispanic race population percentage significantly below state average.
Foreign-born population percentage significantly below state average.
Renting percentage significantly below state average.
Length of stay since moving in above state average.
Percentage of population with a bachelor's degree or higher below state average.
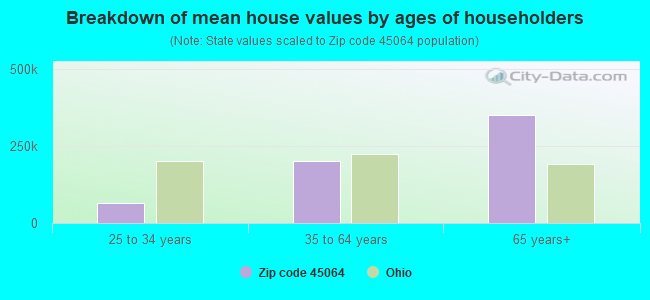
Estimated median house/condo value in 2022: $233,496
45064:
$233,496
Ohio:
$204,100
Median resident age:
This zip code:
43.4 years
Ohio median age:
39.9 years
Average household size:
This zip code:
2.7 people
Ohio:
2.4 people
Averages for the 2020 tax year for zip code 45064, filed in 2021:
Average Adjusted Gross Income (AGI) in 2020: $66,268 (Individual Income Tax Returns)
Here:
$66,268
State:
$67,288
Salary/wage: $56,485 (reported on 80.3% of returns)
Here:
$56,485
State:
$55,628
(% of AGI for various income ranges: 1072.1% for AGIs below $25k, 3180.4% for AGIs $25k-50k, 6666.1% for AGIs $50k-75k, 8809.3% for AGIs $75k-100k, 14990.7% for AGIs $100k-200k)
Taxable interest for individuals: $972 (reported on 26.3% of returns)
This zip code:
$972
Ohio:
$1,518
(% of AGI for various income ranges: 9.2% for AGIs below $25k, 9.6% for AGIs $25k-50k, 66.1% for AGIs $50k-75k, 20.0% for AGIs $75k-100k, 86.7% for AGIs $100k-200k)
Ordinary dividends: $3,158 (reported on 13.9% of returns)
Here:
$3,158
State:
$7,167
(% of AGI for various income ranges: 15.4% for AGIs below $25k, 6.7% for AGIs $25k-50k, 76.7% for AGIs $50k-75k, 78.6% for AGIs $75k-100k, 198.0% for AGIs $100k-200k)
Net capital gain/loss in AGI: +$3,950 (reported on 11.7% of returns)
Here:
+$3,950
State:
+$18,919
(% of AGI for various income ranges: 37.5% for AGIs below $25k, 39.4% for AGIs $50k-75k, 96.4% for AGIs $75k-100k, 224.0% for AGIs $100k-200k)
Profit/loss from business: +$10,006 (reported on 11.7% of returns)
Here:
+$10,006
State:
+$13,744
(% of AGI for various income ranges: 97.1% for AGIs below $25k, 183.0% for AGIs $25k-50k, 211.4% for AGIs $75k-100k, 385.3% for AGIs $100k-200k)
Taxable individual retirement arrangement distribution: $12,308 (reported on 9.5% of returns)
45064:
$12,308
Ohio:
$18,876
(% of AGI for various income ranges: 65.0% for AGIs below $25k, 73.3% for AGIs $25k-50k, 123.3% for AGIs $50k-75k, 274.3% for AGIs $75k-100k, 426.7% for AGIs $100k-200k)
Total itemized deductions: $31,900 (reported on 2.9% of returns)
Here:
$31,900
State:
$33,869
(% of AGI for various income ranges: 850.7% for AGIs $100k-200k)
Charity contributions: $8,133 (reported on 2.2% of returns)
Here:
$8,133
State:
$14,577
(% of AGI for various income ranges: 174.3% for AGIs $75k-100k)
Taxes paid: $7,350 (reported on 2.9% of returns)
45064:
$7,350
State:
$7,681
(% of AGI for various income ranges: 196.0% for AGIs $100k-200k)
Earned income credit: $2,229 (reported on 10.2% of returns)
Here:
$2,229
State:
$2,304
(% of AGI for various income ranges: 79.2% for AGIs below $25k, 45.2% for AGIs $25k-50k)
Percentage of individuals using paid preparers for their 2020 taxes: 94.2%
Here:
94%
State:
94%
(% for various income ranges: 91.2% for AGIs below $25k, 97.0% for AGIs $25k-50k, 92.3% for AGIs $50k-75k, 94.7% for AGIs $75k-100k, 95.5% for AGIs $100k-200k, 100.0% for AGIs over 200k)
Averages for the 2012 tax year for zip code 45064, filed in 2013:
Average Adjusted Gross Income (AGI) in 2012: $48,547 (Individual Income Tax Returns)
Here:
$48,547
State:
$54,926
Salary/wage: $42,897 (reported on 81.0% of returns)
Here:
$42,897
State:
$45,869
(% of AGI for various income ranges: 62.1% for AGIs below $25k, 73.5% for AGIs $25k-50k, 77.3% for AGIs $50k-75k, 81.9% for AGIs $75k-100k, 61.7% for AGIs $100k-200k)
Taxable interest for individuals: $890 (reported on 30.7% of returns)
This zip code:
$890
Ohio:
$1,297
(% of AGI for various income ranges: 0.8% for AGIs below $25k, 0.6% for AGIs $25k-50k, 0.5% for AGIs $50k-75k, 0.2% for AGIs $75k-100k, 0.8% for AGIs $100k-200k)
Ordinary dividends: $2,156 (reported on 13.1% of returns)
Here:
$2,156
State:
$5,821
(% of AGI for various income ranges: 0.5% for AGIs below $25k, 0.2% for AGIs $25k-50k, 0.6% for AGIs $50k-75k, 0.2% for AGIs $75k-100k, 1.2% for AGIs $100k-200k)
Net capital gain/loss in AGI: +$630 (reported on 7.3% of returns)
Here:
+$630
State:
+$11,232
(% of AGI for various income ranges: 0.3% for AGIs $75k-100k, 0.3% for AGIs $100k-200k)
Profit/loss from business: +$9,344 (reported on 13.1% of returns)
Here:
+$9,344
State:
+$12,773
(% of AGI for various income ranges: 9.4% for AGIs below $25k, 4.1% for AGIs $25k-50k, 2.0% for AGIs $50k-75k, 1.8% for AGIs $75k-100k)
Taxable individual retirement arrangement distribution: $13,462 (reported on 9.5% of returns)
45064:
$13,462
Ohio:
$14,511
(% of AGI for various income ranges: 2.5% for AGIs below $25k, 1.3% for AGIs $25k-50k, 4.9% for AGIs $50k-75k, 3.3% for AGIs $100k-200k)
Total itemized deductions: $16,721 (20% of AGI, reported on 30.7% of returns)
Here:
$16,721
State:
$21,278
Here:
20.5% of AGI
State:
18.8% of AGI
(% of AGI for various income ranges: 6.3% for AGIs below $25k, 8.4% for AGIs $25k-50k, 11.3% for AGIs $50k-75k, 12.9% for AGIs $75k-100k, 11.4% for AGIs $100k-200k)
Charity contributions: $2,419 (reported on 19.0% of returns)
Here:
$2,419
State:
$3,943
(% of AGI for various income ranges: 0.7% for AGIs $25k-50k, 0.9% for AGIs $50k-75k, 1.7% for AGIs $75k-100k, 1.0% for AGIs $100k-200k)
Taxes paid: $6,243 (reported on 30.7% of returns)
45064:
$6,243
State:
$9,568
(% of AGI for various income ranges: 1.0% for AGIs below $25k, 2.4% for AGIs $25k-50k, 4.0% for AGIs $50k-75k, 5.2% for AGIs $75k-100k, 5.1% for AGIs $100k-200k)
Earned income credit: $2,163 (reported on 13.9% of returns)
Here:
$2,163
State:
$2,285
(% of AGI for various income ranges: 4.9% for AGIs below $25k, 0.8% for AGIs $25k-50k)
Percentage of individuals using paid preparers for their 2012 taxes: 59.9%
Here:
60%
State:
51%
(% for various income ranges: 50.0% for AGIs below $25k, 61.1% for AGIs $25k-50k, 70.4% for AGIs $50k-75k, 64.3% for AGIs $75k-100k, 66.7% for AGIs $100k-200k)
Averages for the 2004 tax year for zip code 45064, filed in 2005:
Average Adjusted Gross Income (AGI) in 2004: $40,335 (Individual Income Tax Returns)
Here:
$40,335
State:
$44,480
Salary/wage: $37,337 (reported on 87.2% of returns)
Here:
$37,337
State:
$39,198
(% of AGI for various income ranges: 97.0% for AGIs below $10k, 71.6% for AGIs $10k-25k, 82.3% for AGIs $25k-50k, 86.2% for AGIs $50k-75k, 88.6% for AGIs $75k-100k, 62.8% for AGIs over 100k)
Taxable interest for individuals: $790 (reported on 40.6% of returns)
This zip code:
$790
Ohio:
$1,532
(% of AGI for various income ranges: 1.9% for AGIs below $10k, 2.5% for AGIs $10k-25k, 0.9% for AGIs $25k-50k, 0.7% for AGIs $50k-75k, 0.3% for AGIs $75k-100k, 0.3% for AGIs over 100k)
Taxable dividends: $959 (reported on 15.9% of returns)
Here:
$959
State:
$3,496
(% of AGI for various income ranges: 0.7% for AGIs below $10k, 0.2% for AGIs $10k-25k, 0.6% for AGIs $25k-50k, 0.5% for AGIs $50k-75k, 0.2% for AGIs $75k-100k, 0.2% for AGIs over 100k)
Net capital gain/loss: +$7,258 (reported on 11.7% of returns)
Here:
+$7,258
State:
+$8,582
(% of AGI for various income ranges: 0.0% for AGIs below $10k, -0.2% for AGIs $10k-25k, 0.5% for AGIs $25k-50k, 0.6% for AGIs $50k-75k, 1.4% for AGIs $75k-100k, 9.9% for AGIs over 100k)
Profit/loss from business: +$9,526 (reported on 13.6% of returns)
Here:
+$9,526
State:
+$10,813
(% of AGI for various income ranges: 9.6% for AGIs below $10k, 7.1% for AGIs $10k-25k, 2.6% for AGIs $25k-50k, 2.6% for AGIs $50k-75k, 1.1% for AGIs $75k-100k, 4.4% for AGIs over 100k)
IRA payment deduction: $3,750 (reported on 2.0% of returns)
45064:
$3,750
Ohio:
$2,794
Total itemized deductions: $14,484 (22% of AGI, reported on 35.6% of returns)
Here:
$14,484
State:
$17,503
Here:
22.3% of AGI
State:
20.8% of AGI
(% of AGI for various income ranges: 11.1% for AGIs $10k-25k, 10.9% for AGIs $25k-50k, 13.4% for AGIs $50k-75k, 15.3% for AGIs $75k-100k, 14.2% for AGIs over 100k)
Charity contributions deductions: $2,025 (3% of AGI, reported on 25.8% of returns)
Here:
$2,025
State:
$3,087
Here:
2.9% of AGI
State:
3.4% of AGI
(% of AGI for various income ranges: 0.8% for AGIs $10k-25k, 0.8% for AGIs $25k-50k, 1.5% for AGIs $50k-75k, 1.6% for AGIs $75k-100k, 1.6% for AGIs over 100k)
Total tax: $4,800 (reported on 79.2% of returns)
45064:
$4,800
State:
$6,781
(% of AGI for various income ranges: 4.8% for AGIs below $10k, 4.7% for AGIs $10k-25k, 7.0% for AGIs $25k-50k, 9.0% for AGIs $50k-75k, 10.1% for AGIs $75k-100k, 16.7% for AGIs over 100k)
Earned income credit: $1,686 (reported on 10.0% of returns)
Here:
$1,686
State:
$1,696
Percentage of individuals using paid preparers for their 2004 taxes: 59.8%
Here:
60%
State:
55%
(% for various income ranges: 46.9% for AGIs below $10k, 62.3% for AGIs $10k-25k, 61.5% for AGIs $25k-50k, 63.0% for AGIs $50k-75k, 64.3% for AGIs $75k-100k, 65.0% for AGIs over 100k)
Household received Food Stamps/SNAP in the past 12 months: 5 Household did not receive Food Stamps/SNAP in the past 12 months: 1,165
Women who had a birth in the past 12 months: 61 (36 now married, 24 unmarried) Women who did not have a birth in the past 12 months: 724 (301 now married, 423 unmarried)
Housing units in zip code 45064 with a mortgage: 683 (106 second mortgage, 102 both second mortgage and home equity loan) Houses without a mortgage: 14
Median monthly owner costs for units with a mortgage: $1,547 Median monthly owner costs for units without a mortgage: $583
Residents with income below the poverty level in 2022:
This zip code:
7.1%
Whole state:
13.4%
Residents with income below 50% of the poverty level in 2022:
This zip code:
0.3%
Whole state:
7.0%
Median number of rooms in houses and condos:
Here:
6.8
State:
6.7
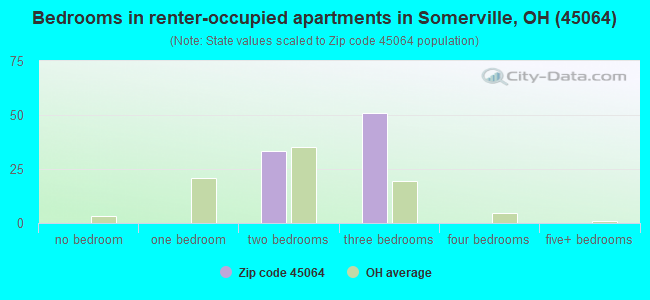
Median number of rooms in apartments:
Here:
5.0
State:
4.4
Notable locations in this zip code not listed on our city pages
In group quarters: 80 (-1 institutionalized population)
Size of family households: 492 2-persons, 160 3-persons, 93 4-persons, 97 5-persons, 89 6-persons
Size of nonfamily households: 171 1-person, 67 2-persons
334 married couples with children.
98 single-parent households (7 men, 91 women).
99.1% of residents of 45064 zip code speak English at home.
0.3% of residents speak Asian or Pacific Island language at home (100% very well).
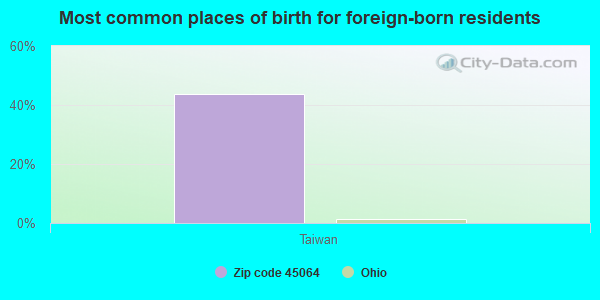
Foreign born population: 16 (0.5%) (0.0% of them are naturalized citizens)
:
0.5%
Whole state:
5.0%
44%Taiwan
29%English
23%German
18%American
6%Irish
2%Italian
1%Scottish
1%Norwegian
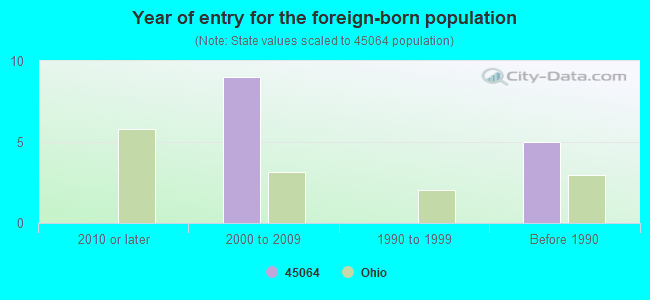
Year of entry for the foreign-born population
02010 or later
92000 to 2009
01990 to 1999
5Before 1990
Housing units lacking complete plumbing facilities: 1.4% Housing units lacking complete kitchen facilities: 2.0%
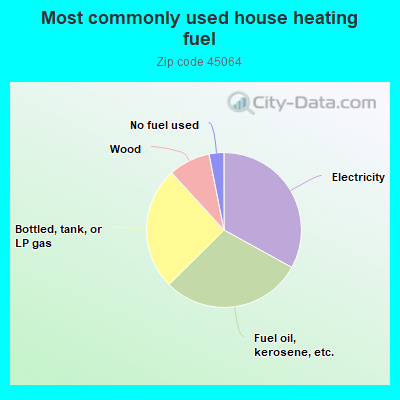
33.1%Electricity
29.6%Fuel oil, kerosene, etc.
25.7%Bottled, tank, or LP gas
8.7%Wood
3.1%No fuel used
Population in 1990: 902. Population change in the 1990s: +1,803 (+199.9%).
Place of birth for U.S.-born residents:
This state: 2,732
Northeast: 83
Midwest: 106
South: 304
63% of the 45064 zip code residents lived in the same house 5 years ago. Out of people who lived in different houses, 53% lived in this county. Out of people who lived in different counties, 50% lived in Ohio.
94% of the 45064 zip code residents lived in the same house 1 year ago. Out of people who lived in different houses, 33% moved from this county. Out of people who lived in different houses, 40% moved from different county within same state. Out of people who lived in different houses, 35% moved from different state.
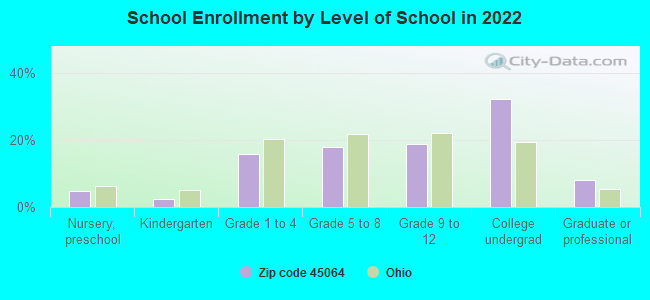
Private vs. public school enrollment:
Students in private schools in grades 1 to 8 (elementary and middle school):
Here:
0.0%
Ohio:
16.0%
Students in private schools in grades 9 to 12 (high school):
Here:
0.0%
Ohio:
13.1%
Students in private undergraduate colleges: 60
Here:
27.7%
Ohio:
22.3%
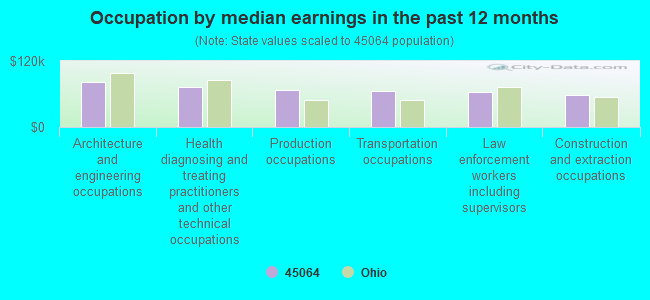
Occupation by median earnings in the past 12 months ($)
82,255Architecture and engineering occupations
73,181Health diagnosing and treating practitioners and other technical occupations
67,246Production occupations
65,948Transportation occupations
64,265Law enforcement workers including supervisors
57,432Construction and extraction occupations
Top industries in this zip code by the number of employees in 2005:
Other Services (except Public Administration): Beauty Salons (100-249 employees: 1 establishment)
Health Care and Social Assistance: Nursing Care Facilities (50-99: 1)
Construction: Plumbing, Heating, and Air-Conditioning Contractors (10-19: 1, 1-4: 1)
Finance and Insurance: Commercial Banking (10-19: 1)
Accommodation and Food Services: Limited-Service Restaurants (10-19: 1)
Administrative and Support and Waste Management and Remediation Services: Other Services to Buildings and Dwellings (10-19: 1)
Construction: Masonry Contractors (10-19: 1)
Construction: Poured Concrete Foundation and Structure Contractors (5-9: 1, 1-4: 1)
People in group quarters in 2010:
61 people in nursing facilities/skilled-nursing facilities
People in group quarters in 2000:
50 people in nursing homes
Fatal accident statistics in 2010:
Fatal accident count: 1
Vehicles involved in fatal accidents: 3
Fatal accidents caused by drunken drivers: 0
Fatalities: 1
Persons involved in fatal accidents: 4
Pedestrians involved in fatal accidents: 0
Home Mortgage Disclosure Act Aggregated Statistics For Year 2009 (Based on 6 partial tracts)
A) FHA, FSA/RHS & VA Home Purchase Loans
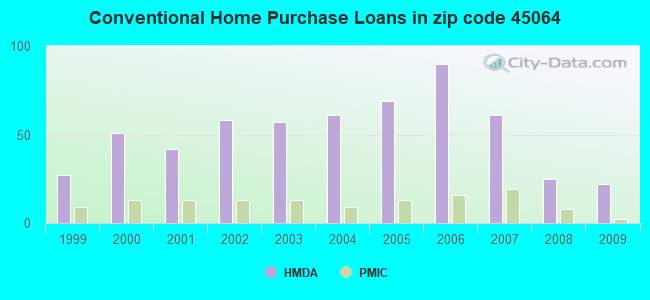
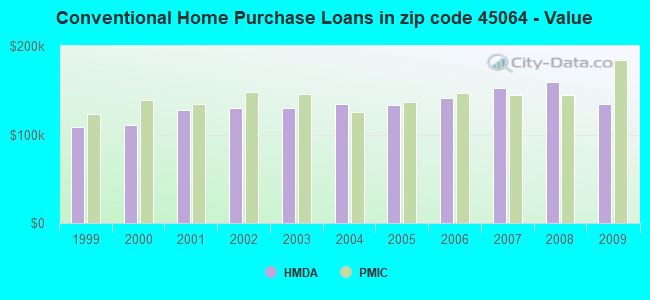
B) Conventional Home Purchase Loans
C) Refinancings
D) Home Improvement Loans
E) Loans on Dwellings For 5+ Families
F) Non-occupant Loans on < 5 Family Dwellings (A B C & D)
Number
Average Value
Number
Average Value
Number
Average Value
Number
Average Value
Number
Average Value
Number
Average Value
LOANS ORIGINATED
15
$148,058
22
$134,383
148
$166,260
5
$30,952
0
$0
6
$85,828
APPLICATIONS APPROVED, NOT ACCEPTED
2
$121,350
1
$37,070
11
$156,555
0
$0
0
$0
1
$38,610
APPLICATIONS DENIED
8
$174,744
4
$96,718
57
$171,714
5
$65,136
0
$0
3
$128,013
APPLICATIONS WITHDRAWN
2
$105,265
2
$125,260
18
$151,678
1
$42,570
0
$0
1
$71,820
FILES CLOSED FOR INCOMPLETENESS
0
$0
1
$25,740
8
$196,562
0
$0
1
$61,780
0
$0
Aggregated Statistics For Year 2008 (Based on 6 partial tracts)
A) FHA, FSA/RHS & VA Home Purchase Loans
B) Conventional Home Purchase Loans
C) Refinancings
D) Home Improvement Loans
F) Non-occupant Loans on < 5 Family Dwellings (A B C & D)
G) Loans On Manufactured Home Dwelling (A B C & D)
Number
Average Value
Number
Average Value
Number
Average Value
Number
Average Value
Number
Average Value
Number
Average Value
LOANS ORIGINATED
20
$138,304
25
$159,272
74
$165,898
8
$37,630
5
$77,862
0
$0
APPLICATIONS APPROVED, NOT ACCEPTED
2
$99,645
3
$204,960
11
$129,420
1
$44,000
0
$0
1
$39,290
APPLICATIONS DENIED
9
$155,964
5
$191,566
51
$145,012
6
$65,202
2
$131,580
1
$84,020
APPLICATIONS WITHDRAWN
2
$131,685
6
$183,413
20
$183,984
1
$25,740
2
$128,445
0
$0
FILES CLOSED FOR INCOMPLETENESS
1
$115,130
1
$211,070
1
$177,090
0
$0
0
$0
0
$0
Aggregated Statistics For Year 2007 (Based on 6 partial tracts)
A) FHA, FSA/RHS & VA Home Purchase Loans
B) Conventional Home Purchase Loans
C) Refinancings
D) Home Improvement Loans
E) Loans on Dwellings For 5+ Families
F) Non-occupant Loans on < 5 Family Dwellings (A B C & D)
G) Loans On Manufactured Home Dwelling (A B C & D)
Number
Average Value
Number
Average Value
Number
Average Value
Number
Average Value
Number
Average Value
Number
Average Value
Number
Average Value
LOANS ORIGINATED
7
$125,840
61
$152,084
93
$145,155
12
$40,067
1
$5,150
10
$114,511
3
$101,750
APPLICATIONS APPROVED, NOT ACCEPTED
0
$0
12
$141,199
14
$139,904
4
$50,235
0
$0
1
$50,450
1
$65,740
APPLICATIONS DENIED
3
$177,420
19
$129,126
60
$141,672
9
$50,356
0
$0
4
$66,780
4
$56,480
APPLICATIONS WITHDRAWN
0
$0
7
$152,187
23
$152,630
1
$114,630
0
$0
1
$59,690
0
$0
FILES CLOSED FOR INCOMPLETENESS
0
$0
2
$113,785
17
$198,227
0
$0
0
$0
1
$41,180
0
$0
Aggregated Statistics For Year 2006 (Based on 6 partial tracts)
A) FHA, FSA/RHS & VA Home Purchase Loans
B) Conventional Home Purchase Loans
C) Refinancings
D) Home Improvement Loans
F) Non-occupant Loans on < 5 Family Dwellings (A B C & D)
G) Loans On Manufactured Home Dwelling (A B C & D)
Number
Average Value
Number
Average Value
Number
Average Value
Number
Average Value
Number
Average Value
Number
Average Value
LOANS ORIGINATED
5
$88,674
90
$141,076
117
$129,301
15
$40,083
11
$84,199
2
$63,685
APPLICATIONS APPROVED, NOT ACCEPTED
0
$0
17
$97,418
17
$118,844
3
$90,173
3
$112,330
2
$82,730
APPLICATIONS DENIED
2
$149,765
21
$143,789
78
$140,880
10
$44,727
4
$153,750
1
$68,050
APPLICATIONS WITHDRAWN
1
$249,810
14
$118,163
40
$162,209
2
$83,940
3
$117,290
0
$0
FILES CLOSED FOR INCOMPLETENESS
0
$0
2
$97,490
14
$137,036
1
$102,960
1
$75,680
0
$0
Aggregated Statistics For Year 2005 (Based on 6 partial tracts)
A) FHA, FSA/RHS & VA Home Purchase Loans
B) Conventional Home Purchase Loans
C) Refinancings
D) Home Improvement Loans
E) Loans on Dwellings For 5+ Families
F) Non-occupant Loans on < 5 Family Dwellings (A B C & D)
G) Loans On Manufactured Home Dwelling (A B C & D)
Number
Average Value
Number
Average Value
Number
Average Value
Number
Average Value
Number
Average Value
Number
Average Value
Number
Average Value
LOANS ORIGINATED
5
$154,542
69
$133,267
133
$138,689
16
$48,645
1
$39,640
10
$128,549
2
$69,315
APPLICATIONS APPROVED, NOT ACCEPTED
0
$0
7
$148,697
23
$155,953
2
$27,805
0
$0
0
$0
1
$17,690
APPLICATIONS DENIED
1
$133,610
11
$84,874
98
$140,255
12
$51,667
0
$0
5
$47,126
4
$59,318
APPLICATIONS WITHDRAWN
0
$0
9
$113,416
65
$158,897
4
$103,878
0
$0
1
$79,790
0
$0
FILES CLOSED FOR INCOMPLETENESS
0
$0
5
$166,528
10
$119,377
0
$0
0
$0
2
$84,170
0
$0
Aggregated Statistics For Year 2004 (Based on 6 partial tracts)
A) FHA, FSA/RHS & VA Home Purchase Loans
B) Conventional Home Purchase Loans
C) Refinancings
D) Home Improvement Loans
F) Non-occupant Loans on < 5 Family Dwellings (A B C & D)
G) Loans On Manufactured Home Dwelling (A B C & D)
Number
Average Value
Number
Average Value
Number
Average Value
Number
Average Value
Number
Average Value
Number
Average Value
LOANS ORIGINATED
7
$139,344
61
$134,426
153
$131,331
20
$53,924
7
$86,029
3
$57,873
APPLICATIONS APPROVED, NOT ACCEPTED
0
$0
8
$124,959
27
$147,464
4
$38,170
1
$46,330
1
$22,510
APPLICATIONS DENIED
3
$110,943
10
$140,550
84
$150,560
10
$30,693
4
$70,210
3
$104,357
APPLICATIONS WITHDRAWN
1
$109,950
4
$97,348
62
$132,166
4
$43,902
2
$53,510
0
$0
FILES CLOSED FOR INCOMPLETENESS
0
$0
3
$97,600
10
$127,840
1
$32,990
1
$47,360
0
$0
Aggregated Statistics For Year 2003 (Based on 2 partial tracts)
A) FHA, FSA/RHS & VA Home Purchase Loans
B) Conventional Home Purchase Loans
C) Refinancings
D) Home Improvement Loans
F) Non-occupant Loans on < 5 Family Dwellings (A B C & D)
Number
Average Value
Number
Average Value
Number
Average Value
Number
Average Value
Number
Average Value
LOANS ORIGINATED
6
$122,180
57
$130,262
305
$134,449
7
$17,061
15
$106,221
APPLICATIONS APPROVED, NOT ACCEPTED
1
$54,050
6
$93,522
42
$129,546
0
$0
1
$39,120
APPLICATIONS DENIED
1
$41,700
7
$138,334
86
$138,481
7
$15,003
4
$61,390
APPLICATIONS WITHDRAWN
1
$132,300
7
$183,269
49
$144,438
1
$12,870
1
$28,310
FILES CLOSED FOR INCOMPLETENESS
0
$0
3
$92,837
18
$147,204
0
$0
1
$114,290
Aggregated Statistics For Year 2002 (Based on 2 partial tracts)
A) FHA, FSA/RHS & VA Home Purchase Loans
B) Conventional Home Purchase Loans
C) Refinancings
D) Home Improvement Loans
F) Non-occupant Loans on < 5 Family Dwellings (A B C & D)
Number
Average Value
Number
Average Value
Number
Average Value
Number
Average Value
Number
Average Value
LOANS ORIGINATED
5
$136,320
58
$130,023
254
$124,087
15
$27,902
6
$78,422
APPLICATIONS APPROVED, NOT ACCEPTED
1
$65,380
8
$84,234
35
$120,610
3
$65,207
1
$37,580
APPLICATIONS DENIED
2
$86,745
15
$103,372
56
$126,301
7
$15,370
4
$97,425
APPLICATIONS WITHDRAWN
1
$37,070
5
$130,142
57
$132,556
4
$23,165
0
$0
FILES CLOSED FOR INCOMPLETENESS
1
$70,530
2
$103,215
16
$116,023
1
$10,300
0
$0
Aggregated Statistics For Year 2001 (Based on 2 partial tracts)
A) FHA, FSA/RHS & VA Home Purchase Loans
B) Conventional Home Purchase Loans
C) Refinancings
D) Home Improvement Loans
F) Non-occupant Loans on < 5 Family Dwellings (A B C & D)
Number
Average Value
Number
Average Value
Number
Average Value
Number
Average Value
Number
Average Value
LOANS ORIGINATED
10
$96,216
42
$127,462
204
$119,151
25
$18,059
12
$98,069
APPLICATIONS APPROVED, NOT ACCEPTED
1
$58,170
8
$89,254
38
$103,353
3
$40,840
1
$61,780
APPLICATIONS DENIED
1
$77,730
18
$83,912
73
$112,205
15
$17,572
2
$44,530
APPLICATIONS WITHDRAWN
1
$124,580
3
$154,097
52
$109,623
2
$6,435
0
$0
FILES CLOSED FOR INCOMPLETENESS
0
$0
2
$88,030
11
$126,968
2
$25,225
0
$0
Aggregated Statistics For Year 2000 (Based on 2 partial tracts)
A) FHA, FSA/RHS & VA Home Purchase Loans
B) Conventional Home Purchase Loans
C) Refinancings
D) Home Improvement Loans
F) Non-occupant Loans on < 5 Family Dwellings (A B C & D)
Number
Average Value
Number
Average Value
Number
Average Value
Number
Average Value
Number
Average Value
LOANS ORIGINATED
12
$117,589
51
$110,884
60
$94,672
24
$13,599
7
$52,877
APPLICATIONS APPROVED, NOT ACCEPTED
1
$50,970
10
$85,354
18
$104,590
6
$23,680
1
$67,440
APPLICATIONS DENIED
2
$84,685
16
$75,000
42
$84,109
14
$16,584
2
$53,795
APPLICATIONS WITHDRAWN
1
$49,420
9
$113,313
23
$97,409
2
$14,155
0
$0
FILES CLOSED FOR INCOMPLETENESS
0
$0
0
$0
10
$100,437
0
$0
0
$0
Aggregated Statistics For Year 1999 (Based on 1 partial tract)
A) FHA, FSA/RHS & VA Home Purchase Loans
B) Conventional Home Purchase Loans
C) Refinancings
D) Home Improvement Loans
F) Non-occupant Loans on < 5 Family Dwellings (A B C & D)
Detailed PMIC statistics for the following Tracts:0103.00
, 4801.00
2002 - 2018 National Fire Incident Reporting System (NFIRS) incidents
According to the data from the years 2002 - 2018 the average number of fires per year is 24. The highest number of reported fire incidents - 39 took place in 2008, and the least - 12 in 2002. The data has an increasing trend.
When looking into fire subcategories, the most reports belonged to: Structure Fires (54.8%), and Outside Fires (32.2%).
Fire incident types reported to NFIRS in Zip Code 45064

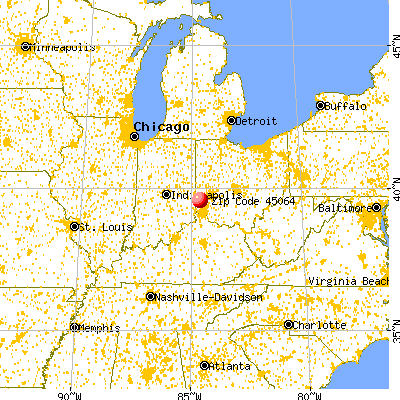


 Nearest zip codes: 45070, 45062, 45330, 45311, 45067, 45013.


 According to the data from the years 2002 - 2018 the average number of fires per year is 24. The highest number of reported fire incidents - 39 took place in 2008, and the least - 12 in 2002. The data has an increasing trend.
 When looking into fire subcategories, the most reports belonged to: Structure Fires (54.8%), and Outside Fires (32.2%).