Estimated zip code population in 2022: 6,046 Zip code population in 2010: 6,367 Zip code population in 2000: 7,444
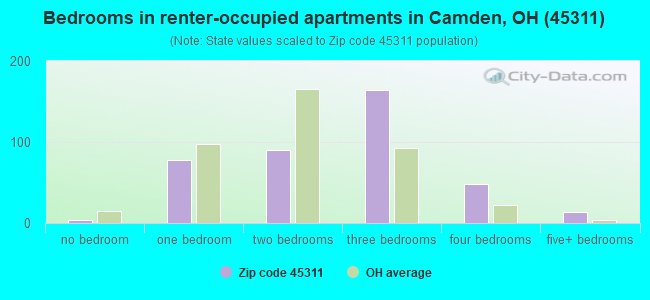
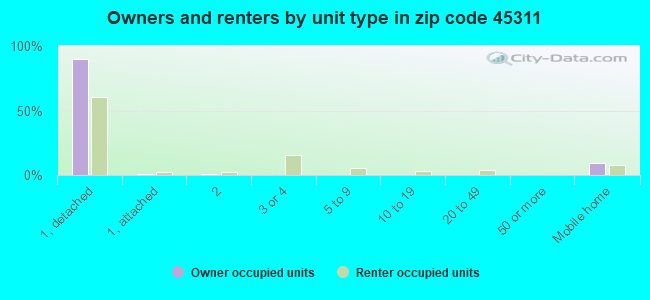
Houses and condos: 2,726 Renter-occupied apartments: 401
% of renters here:
17%
State:
33%
March 2022 cost of living index in zip code 45311: 82.9 (low, U.S. average is 100)
Land area: 91.4 sq. mi. Water area: 0.8 sq. mi.
Population density: 66 people per square mile
(very low).
OSM Map
General Map
Google Map
MSN Map
OSM Map
General Map
Google Map
MSN Map
OSM Map
General Map
Google Map
MSN Map
OSM Map
General Map
Google Map
MSN Map
Please wait while loading the map...
Real estate property taxes paid for housing units in 2022:
This zip code:
1.1% ($1,912)
Ohio:
1.3% ($2,639)
Median real estate property taxes paid for housing units with mortgages in 2022: $1,989 (0.9%) Median real estate property taxes paid for housing units with no mortgage in 2022: $1,657 (1.1%)
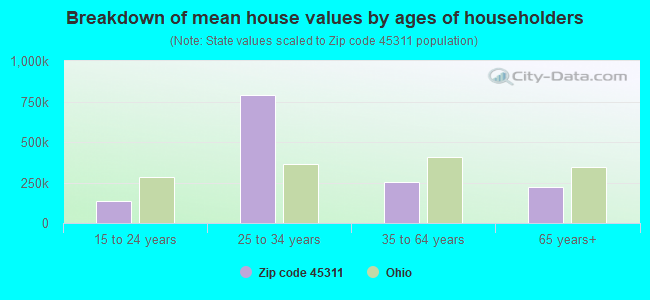
Estimated median house/condo value in 2022: $179,492
45311:
$179,492
Ohio:
$204,100
According to our research of Ohio and other state lists, there were 13 registered sex offenders living in 45311 zip code as of May 28, 2024. The ratio of all residents to sex offenders in zip code 45311 is 467 to 1. The ratio of registered sex offenders to all residents in this zip code is near the state average.
Median resident age:
This zip code:
46.7 years
Ohio median age:
39.9 years
Average household size:
This zip code:
2.6 people
Ohio:
2.4 people
Averages for the 2020 tax year for zip code 45311, filed in 2021:
Average Adjusted Gross Income (AGI) in 2020: $52,869 (Individual Income Tax Returns)
Here:
$52,869
State:
$67,288
Salary/wage: $46,238 (reported on 79.8% of returns)
Here:
$46,238
State:
$55,628
(% of AGI for various income ranges: 1214.3% for AGIs below $25k, 3539.3% for AGIs $25k-50k, 6819.3% for AGIs $50k-75k, 9683.9% for AGIs $75k-100k, 15905.9% for AGIs $100k-200k)
Taxable interest for individuals: $1,334 (reported on 22.5% of returns)
This zip code:
$1,334
Ohio:
$1,518
(% of AGI for various income ranges: 15.9% for AGIs below $25k, 16.1% for AGIs $25k-50k, 18.3% for AGIs $50k-75k, 16.7% for AGIs $75k-100k, 126.5% for AGIs $100k-200k)
Ordinary dividends: $3,000 (reported on 11.8% of returns)
Here:
$3,000
State:
$7,167
(% of AGI for various income ranges: 12.2% for AGIs below $25k, 22.8% for AGIs $25k-50k, 32.3% for AGIs $50k-75k, 30.0% for AGIs $75k-100k, 340.0% for AGIs $100k-200k)
Net capital gain/loss in AGI: +$8,715 (reported on 10.3% of returns)
Here:
+$8,715
State:
+$18,919
(% of AGI for various income ranges: 14.1% for AGIs below $25k, 27.9% for AGIs $25k-50k, 38.0% for AGIs $50k-75k, 187.8% for AGIs $75k-100k, 976.5% for AGIs $100k-200k)
Profit/loss from business: +$11,100 (reported on 13.4% of returns)
Here:
+$11,100
State:
+$13,744
(% of AGI for various income ranges: 132.9% for AGIs below $25k, 45.1% for AGIs $25k-50k, 227.0% for AGIs $50k-75k, 241.1% for AGIs $75k-100k, 1024.7% for AGIs $100k-200k)
Taxable individual retirement arrangement distribution: $13,353 (reported on 6.5% of returns)
45311:
$13,353
Ohio:
$18,876
(% of AGI for various income ranges: 43.8% for AGIs below $25k, 53.9% for AGIs $25k-50k, 92.0% for AGIs $50k-75k, 200.6% for AGIs $75k-100k, 630.6% for AGIs $100k-200k)
Total itemized deductions: $30,583 (reported on 2.3% of returns)
Here:
$30,583
State:
$33,869
(% of AGI for various income ranges: 269.7% for AGIs $50k-75k, 603.5% for AGIs $100k-200k)
Charity contributions: $9,375 (reported on 1.5% of returns)
Here:
$9,375
State:
$14,577
(% of AGI for various income ranges: 220.6% for AGIs $100k-200k)
Taxes paid: $6,267 (reported on 2.3% of returns)
45311:
$6,267
State:
$7,681
(% of AGI for various income ranges: 43.0% for AGIs $50k-75k, 145.3% for AGIs $100k-200k)
Earned income credit: $2,302 (reported on 15.6% of returns)
Here:
$2,302
State:
$2,304
(% of AGI for various income ranges: 101.7% for AGIs below $25k, 62.1% for AGIs $25k-50k)
Percentage of individuals using paid preparers for their 2020 taxes: 95.8%
Here:
96%
State:
94%
(% for various income ranges: 95.2% for AGIs below $25k, 96.1% for AGIs $25k-50k, 97.6% for AGIs $50k-75k, 96.2% for AGIs $75k-100k, 93.5% for AGIs $100k-200k, 100.0% for AGIs over 200k)
Averages for the 2012 tax year for zip code 45311, filed in 2013:
Average Adjusted Gross Income (AGI) in 2012: $43,092 (Individual Income Tax Returns)
Here:
$43,092
State:
$54,926
Salary/wage: $37,531 (reported on 82.4% of returns)
Here:
$37,531
State:
$45,869
(% of AGI for various income ranges: 71.4% for AGIs below $25k, 76.1% for AGIs $25k-50k, 78.9% for AGIs $50k-75k, 77.9% for AGIs $75k-100k, 55.3% for AGIs $100k-200k)
Taxable interest for individuals: $1,029 (reported on 26.7% of returns)
This zip code:
$1,029
Ohio:
$1,297
(% of AGI for various income ranges: 0.8% for AGIs below $25k, 0.4% for AGIs $25k-50k, 0.7% for AGIs $50k-75k, 0.2% for AGIs $75k-100k, 1.0% for AGIs $100k-200k)
Ordinary dividends: $2,223 (reported on 11.5% of returns)
Here:
$2,223
State:
$5,821
(% of AGI for various income ranges: 0.4% for AGIs below $25k, 0.3% for AGIs $25k-50k, 0.3% for AGIs $50k-75k, 0.4% for AGIs $75k-100k, 1.5% for AGIs $100k-200k)
Net capital gain/loss in AGI: +$6,610 (reported on 8.0% of returns)
Here:
+$6,610
State:
+$11,232
(% of AGI for various income ranges: 0.4% for AGIs below $25k, 1.1% for AGIs $50k-75k, 3.9% for AGIs $100k-200k)
Profit/loss from business: +$10,594 (reported on 12.2% of returns)
Here:
+$10,594
State:
+$12,773
(% of AGI for various income ranges: 6.2% for AGIs below $25k, 3.2% for AGIs $25k-50k, 2.6% for AGIs $50k-75k, 2.5% for AGIs $75k-100k, 2.0% for AGIs $100k-200k)
Taxable individual retirement arrangement distribution: $11,452 (reported on 8.0% of returns)
45311:
$11,452
Ohio:
$14,511
(% of AGI for various income ranges: 1.9% for AGIs below $25k, 1.7% for AGIs $25k-50k, 1.6% for AGIs $50k-75k, 2.2% for AGIs $75k-100k, 3.2% for AGIs $100k-200k)
Total itemized deductions: $15,486 (21% of AGI, reported on 26.7% of returns)
Here:
$15,486
State:
$21,278
Here:
21.1% of AGI
State:
18.8% of AGI
(% of AGI for various income ranges: 5.6% for AGIs below $25k, 7.1% for AGIs $25k-50k, 10.0% for AGIs $50k-75k, 12.3% for AGIs $75k-100k, 11.9% for AGIs $100k-200k)
Charity contributions: $2,737 (reported on 16.4% of returns)
Here:
$2,737
State:
$3,943
(% of AGI for various income ranges: 0.4% for AGIs below $25k, 0.5% for AGIs $25k-50k, 0.8% for AGIs $50k-75k, 1.3% for AGIs $75k-100k, 2.0% for AGIs $100k-200k)
Taxes paid: $6,072 (reported on 26.3% of returns)
45311:
$6,072
State:
$9,568
(% of AGI for various income ranges: 1.2% for AGIs below $25k, 1.9% for AGIs $25k-50k, 3.5% for AGIs $50k-75k, 4.8% for AGIs $75k-100k, 6.3% for AGIs $100k-200k)
Earned income credit: $2,331 (reported on 19.5% of returns)
Here:
$2,331
State:
$2,285
(% of AGI for various income ranges: 6.9% for AGIs below $25k, 1.0% for AGIs $25k-50k)
Percentage of individuals using paid preparers for their 2012 taxes: 59.5%
Here:
60%
State:
51%
(% for various income ranges: 52.4% for AGIs below $25k, 63.2% for AGIs $25k-50k, 66.7% for AGIs $50k-75k, 58.3% for AGIs $75k-100k, 70.6% for AGIs $100k-200k)
Averages for the 2004 tax year for zip code 45311, filed in 2005:
Average Adjusted Gross Income (AGI) in 2004: $35,361 (Individual Income Tax Returns)
Here:
$35,361
State:
$44,480
Salary/wage: $33,133 (reported on 86.8% of returns)
Here:
$33,133
State:
$39,198
(% of AGI for various income ranges: 102.4% for AGIs below $10k, 74.6% for AGIs $10k-25k, 81.0% for AGIs $25k-50k, 86.9% for AGIs $50k-75k, 83.1% for AGIs $75k-100k, 67.5% for AGIs over 100k)
Taxable interest for individuals: $1,028 (reported on 36.2% of returns)
This zip code:
$1,028
Ohio:
$1,532
(% of AGI for various income ranges: 5.5% for AGIs below $10k, 2.1% for AGIs $10k-25k, 1.0% for AGIs $25k-50k, 0.7% for AGIs $50k-75k, 0.3% for AGIs $75k-100k, 1.1% for AGIs over 100k)
Taxable dividends: $1,326 (reported on 14.5% of returns)
Here:
$1,326
State:
$3,496
(% of AGI for various income ranges: 1.0% for AGIs below $10k, 0.7% for AGIs $10k-25k, 0.3% for AGIs $25k-50k, 0.7% for AGIs $50k-75k, 0.5% for AGIs $75k-100k, 0.9% for AGIs over 100k)
Net capital gain/loss: +$3,144 (reported on 10.4% of returns)
Here:
+$3,144
State:
+$8,582
(% of AGI for various income ranges: 4.5% for AGIs below $10k, -0.1% for AGIs $10k-25k, 0.2% for AGIs $25k-50k, 0.9% for AGIs $50k-75k, 0.5% for AGIs $75k-100k, 4.4% for AGIs over 100k)
Profit/loss from business: +$9,723 (reported on 13.7% of returns)
Here:
+$9,723
State:
+$10,813
(% of AGI for various income ranges: 5.5% for AGIs below $10k, 5.9% for AGIs $10k-25k, 3.7% for AGIs $25k-50k, 1.4% for AGIs $50k-75k, 4.6% for AGIs $75k-100k, 6.1% for AGIs over 100k)
IRA payment deduction: $2,000 (reported on 1.4% of returns)
45311:
$2,000
Ohio:
$2,794
Total itemized deductions: $14,011 (24% of AGI, reported on 30.0% of returns)
Here:
$14,011
State:
$17,503
Here:
23.7% of AGI
State:
20.8% of AGI
(% of AGI for various income ranges: 5.4% for AGIs below $10k, 8.3% for AGIs $10k-25k, 9.9% for AGIs $25k-50k, 13.8% for AGIs $50k-75k, 15.0% for AGIs $75k-100k, 13.4% for AGIs over 100k)
Charity contributions deductions: $2,012 (3% of AGI, reported on 21.4% of returns)
Here:
$2,012
State:
$3,087
Here:
3.2% of AGI
State:
3.4% of AGI
(% of AGI for various income ranges: 0.9% for AGIs $10k-25k, 0.8% for AGIs $25k-50k, 1.4% for AGIs $50k-75k, 1.2% for AGIs $75k-100k, 2.6% for AGIs over 100k)
Total tax: $3,878 (reported on 76.0% of returns)
45311:
$3,878
State:
$6,781
(% of AGI for various income ranges: 2.7% for AGIs below $10k, 4.5% for AGIs $10k-25k, 6.7% for AGIs $25k-50k, 8.4% for AGIs $50k-75k, 10.9% for AGIs $75k-100k, 14.8% for AGIs over 100k)
Earned income credit: $1,735 (reported on 14.0% of returns)
Here:
$1,735
State:
$1,696
Percentage of individuals using paid preparers for their 2004 taxes: 59.3%
Here:
59%
State:
55%
(% for various income ranges: 46.6% for AGIs below $10k, 61.7% for AGIs $10k-25k, 59.6% for AGIs $25k-50k, 64.2% for AGIs $50k-75k, 66.5% for AGIs $75k-100k, 79.2% for AGIs over 100k)
Household received Food Stamps/SNAP in the past 12 months: 194 Household did not receive Food Stamps/SNAP in the past 12 months: 2,158
Women who had a birth in the past 12 months: 29 (11 now married, 18 unmarried) Women who did not have a birth in the past 12 months: 1,436 (626 now married, 809 unmarried)
Housing units in zip code 45311 with a mortgage: 1,095 (87 second mortgage, 10 home equity loan, 71 both second mortgage and home equity loan) Houses without a mortgage: 88
Median monthly owner costs for units with a mortgage: $1,345 Median monthly owner costs for units without a mortgage: $494
Residents with income below the poverty level in 2022:
This zip code:
12.6%
Whole state:
13.4%
Residents with income below 50% of the poverty level in 2022:
This zip code:
5.2%
Whole state:
7.0%
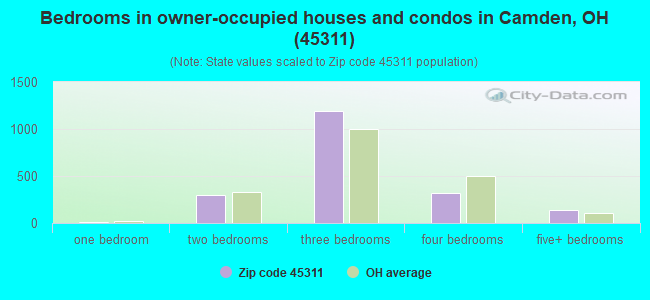
Median number of rooms in houses and condos:
Here:
6.6
State:
6.7
Median number of rooms in apartments:
Here:
5.8
State:
4.4
Notable locations in this zip code not listed on our city pages
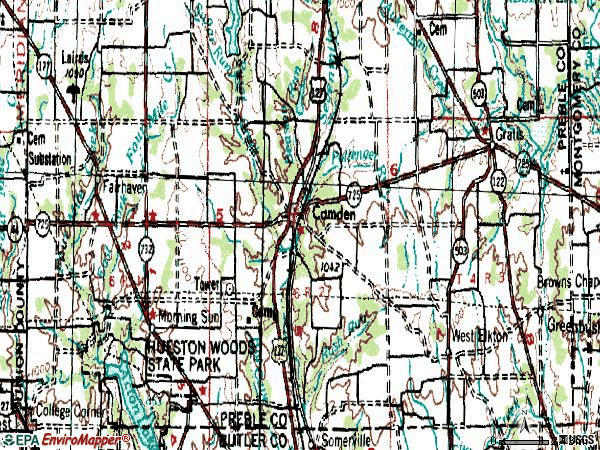
Notable locations in zip code 45311: Woodland Trails (A), Sycamore Grove Picnic Area (B), Camp Cartwright (C), Camp Myron Kahn (D), Eck Farm (E), Fliehman Farms (F), Bills Farm (G), M D M Farms (H), McQuiston Farms (I), Cimprich Farms (J), Stoney Hedgerow Farm (K), Right Place Farm (L), Lohrey Farms (M), Vest Farm (N), Dream Acres Farm (O), Future Manner Farms (P), Sugar Valley Farm (Q), Camden - Somers Township Fire and Rescue (R), Hueston Woods Lodge (S). Display/hide their locations on the map
Churches in zip code 45311 include: Camden United Methodist Church (A), Grace Brethren Church (B), First United Presbyterian Church (C), First Southern Baptist Church (D), Camden Pentecostal Church (E), First Church of God (F), Fairhaven United Presbyterian Church (G), Morning Sun Church (H), Saint Mary Church (I). Display/hide their locations on the map
Cemeteries: Beechwood Cemetery (1), Fairmount Cemetery (2), Gard Cemetery (3), Lowes Cemetery (4), Davis Cemetery (5), Friends Cemetery (6), John Ramsey Cemetery (7). Display/hide their locations on the map
Reservoirs: Acton Lake (A), Paradise Lakes-North Lake (B), Paradise Lakes-South Lake (C), Mystic Lake (D), Cross Pond (E). Display/hide their locations on the map
Streams, rivers, and creeks: Beasley Run (A), Opossum Run (B), Sugar Run (C), Trippetts Branch (D), Rush Run (E), Pottenger Run (F), Paint Creek (G). Display/hide their locations on the map
In group quarters: 15 (-1 institutionalized population)
Size of family households: 845 2-persons, 454 3-persons, 260 4-persons, 110 5-persons, 66 6-persons, 58 7-or-more-persons
Size of nonfamily households: 481 1-person, 50 2-persons, 27 6-persons
691 married couples with children.
248 single-parent households (93 men, 155 women).
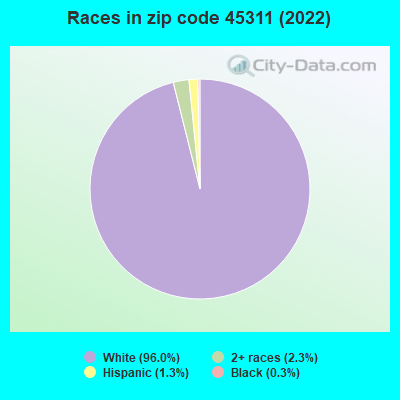
99.0% of residents of 45311 zip code speak English at home.
0.7% of residents speak other Indo-European language at home (100% very well).
Foreign born population: 0 (0.0%)
:
0.0%
Whole state:
5.0%
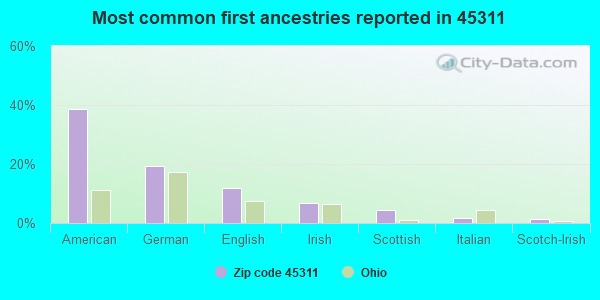
38%American
19%German
12%English
7%Irish
4%Scottish
2%Italian
1%Scotch-Irish
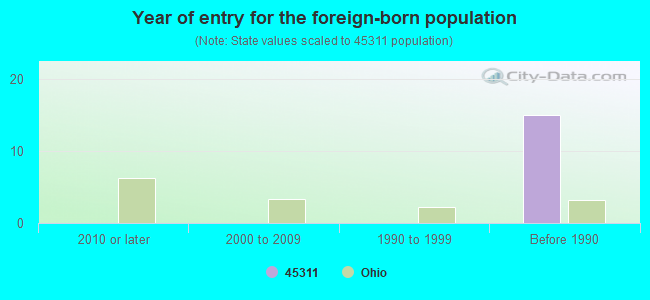
Year of entry for the foreign-born population
02010 or later
02000 to 2009
01990 to 1999
15Before 1990
Facilities with environmental interests located in this zip code:
CAMDEN ELEM SCHOOL (120 BLOOMFIELD ST in CAMDEN, OH)
(Geographic Names Information System) (National Center for Education Statistics) - STATE ID-004630 STATE MASTER (Ohio general info) - AIR MAJOR Organizations: PREBLE SHAWNEE LOCAL SD (SCHOOL DISTRICT)
Alternative names: CAMDEN ELEMENTARY SCHOOL
CAMDEN STP (300 S MAIN ST in CAMDEN, OH)
STATE MASTER (Ohio general info) - PCS-OH0024317, National Pollutant Discharge Elimination System Permit National Pollutant Discharge Elimination System NON-MAJOR (Tracking pollutant discharge elimination systems) - permit National Pollutant Discharge Elimination System NON-MAJOR (Tracking pollutant discharge elimination systems) - permit Business SIC classification: SEWERAGE SYSTEMS Organizations: VILLAGE OF CAMDEN (CONTACT/OWNER)
, CAMDEN WWTP (CONTACT/OWNER)
Alternative names: CAMDEN, VILLAGE OF, VILLAGE OF CAMDEN
CAMDEN READY MIX CO (478 CAMDEN COLLEGE CORNER RD in CAMDEN, OH)
AIR MINOR (AIRS/AFS) STATE MASTER (Ohio general info) - AIR MAJOR Business SIC classification: READY-MIXED CONCRETE
Housing units lacking complete plumbing facilities: 4.0% Housing units lacking complete kitchen facilities: 4.6%
31.6%Electricity
25.6%Utility gas
13.6%Fuel oil, kerosene, etc.
12.9%Bottled, tank, or LP gas
11.6%Wood
4.4%Other fuel
0.6%No fuel used
Population in 1990: 8,394.
Place of birth for U.S.-born residents:
This state: 5,087
Northeast: 36
Midwest: 445
South: 397
West: 46
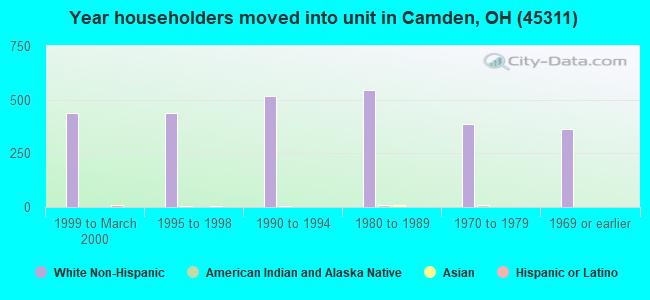
63% of the 45311 zip code residents lived in the same house 5 years ago. Out of people who lived in different houses, 53% lived in this county. Out of people who lived in different counties, 50% lived in Ohio.
96% of the 45311 zip code residents lived in the same house 1 year ago. Out of people who lived in different houses, 63% moved from this county. Out of people who lived in different houses, 43% moved from different county within same state. Out of people who lived in different houses, 2% moved from different state. Out of people who lived in different houses, 4% moved from abroad.
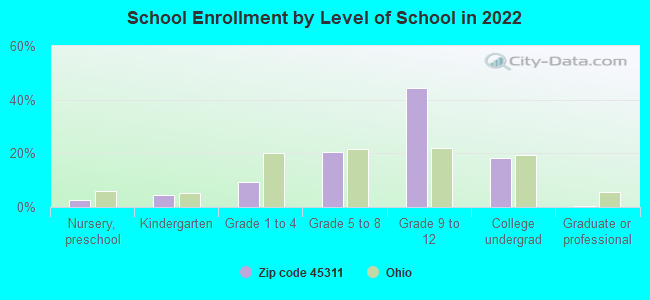
Private vs. public school enrollment:
Students in private schools in grades 1 to 8 (elementary and middle school): 110
Here:
26.8%
Ohio:
16.0%
Students in private schools in grades 9 to 12 (high school): 46
Here:
7.8%
Ohio:
13.1%
Students in private undergraduate colleges: 66
Here:
26.9%
Ohio:
22.3%
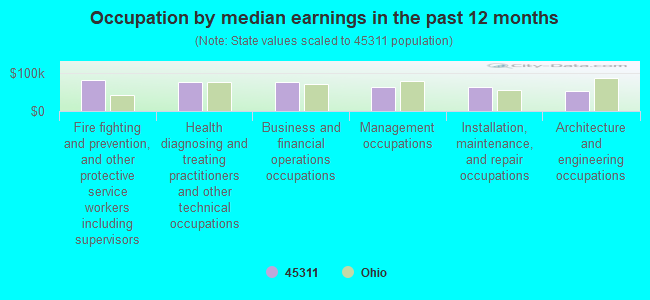
Occupation by median earnings in the past 12 months ($)
80,915Fire fighting and prevention, and other protective service workers including supervisors
75,971Health diagnosing and treating practitioners and other technical occupations
75,808Business and financial operations occupations
63,701Management occupations
61,963Installation, maintenance, and repair occupations
53,572Architecture and engineering occupations
Top industries in this zip code by the number of employees in 2005:
Accommodation and Food Services: Limited-Service Restaurants (10-19 employees: 3 establishments)
Health Care and Social Assistance: Residential Mental Retardation Facilities (10-19: 1)
Wholesale Trade: Farm and Garden Machinery and Equipment Merchant Wholesalers (10-19: 1)
Health Care and Social Assistance: Offices of Physicians (except Mental Health Specialists) (10-19: 1)
People in group quarters in 2010:
12 people in group homes intended for adults
People in group quarters in 2000:
38 people in homes for the mentally retarded
Fatal accident statistics in 2012:
Fatal accident count: 2
Vehicles involved in fatal accidents: 3
Fatal accidents caused by drunken drivers: 2
Fatalities: 2
Persons involved in fatal accidents: 3
Pedestrians involved in fatal accidents: 0
Fatal accident statistics in 2011:
Fatal accident count: 1
Vehicles involved in fatal accidents: 1
Fatal accidents caused by drunken drivers: 1
Fatalities: 1
Persons involved in fatal accidents: 1
Pedestrians involved in fatal accidents: 0
Home Mortgage Disclosure Act Aggregated Statistics For Year 2009 (Based on 6 partial tracts)
A) FHA, FSA/RHS & VA Home Purchase Loans
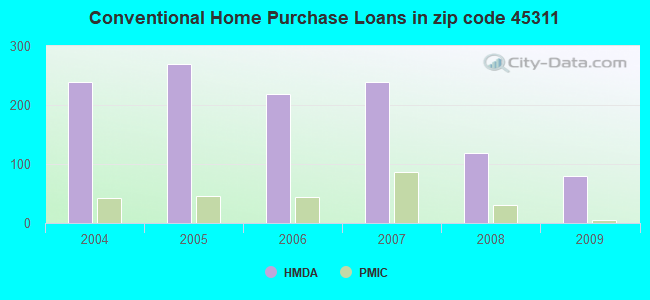
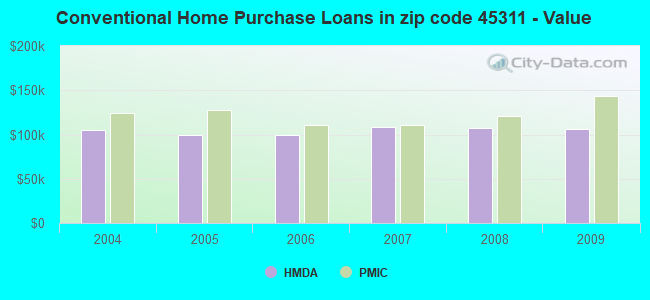
B) Conventional Home Purchase Loans
C) Refinancings
D) Home Improvement Loans
F) Non-occupant Loans on < 5 Family Dwellings (A B C & D)
G) Loans On Manufactured Home Dwelling (A B C & D)
Number
Average Value
Number
Average Value
Number
Average Value
Number
Average Value
Number
Average Value
Number
Average Value
LOANS ORIGINATED
65
$111,309
79
$105,716
381
$122,792
14
$35,161
42
$98,740
4
$99,452
APPLICATIONS APPROVED, NOT ACCEPTED
4
$108,762
5
$126,486
31
$126,987
0
$0
0
$0
0
$0
APPLICATIONS DENIED
22
$128,625
21
$76,509
128
$127,996
12
$15,509
4
$97,390
7
$89,377
APPLICATIONS WITHDRAWN
10
$78,098
17
$99,786
77
$110,511
6
$63,380
4
$116,235
1
$129,110
FILES CLOSED FOR INCOMPLETENESS
1
$146,830
0
$0
15
$140,255
1
$25,320
0
$0
0
$0
Aggregated Statistics For Year 2008 (Based on 6 partial tracts)
A) FHA, FSA/RHS & VA Home Purchase Loans
B) Conventional Home Purchase Loans
C) Refinancings
D) Home Improvement Loans
E) Loans on Dwellings For 5+ Families
F) Non-occupant Loans on < 5 Family Dwellings (A B C & D)
G) Loans On Manufactured Home Dwelling (A B C & D)
Number
Average Value
Number
Average Value
Number
Average Value
Number
Average Value
Number
Average Value
Number
Average Value
Number
Average Value
LOANS ORIGINATED
82
$112,219
119
$106,973
235
$114,625
21
$57,040
1
$136,840
33
$85,071
6
$80,767
APPLICATIONS APPROVED, NOT ACCEPTED
7
$106,790
12
$90,080
34
$110,430
7
$33,944
0
$0
2
$43,150
2
$128,975
APPLICATIONS DENIED
29
$123,488
48
$111,051
204
$112,209
29
$57,061
0
$0
10
$132,232
3
$104,970
APPLICATIONS WITHDRAWN
16
$104,779
12
$135,612
81
$126,609
1
$140,540
0
$0
3
$168,533
0
$0
FILES CLOSED FOR INCOMPLETENESS
2
$153,645
2
$131,295
17
$108,016
1
$47,730
0
$0
0
$0
1
$7,400
Aggregated Statistics For Year 2007 (Based on 6 partial tracts)
A) FHA, FSA/RHS & VA Home Purchase Loans
B) Conventional Home Purchase Loans
C) Refinancings
D) Home Improvement Loans
F) Non-occupant Loans on < 5 Family Dwellings (A B C & D)
G) Loans On Manufactured Home Dwelling (A B C & D)
Number
Average Value
Number
Average Value
Number
Average Value
Number
Average Value
Number
Average Value
Number
Average Value
LOANS ORIGINATED
49
$105,936
239
$108,398
275
$119,343
47
$44,710
43
$99,117
10
$74,567
APPLICATIONS APPROVED, NOT ACCEPTED
6
$95,702
26
$106,920
63
$121,412
8
$88,019
2
$110,330
9
$94,102
APPLICATIONS DENIED
5
$108,054
56
$97,924
300
$116,491
39
$50,383
7
$105,957
20
$57,093
APPLICATIONS WITHDRAWN
7
$89,437
32
$81,050
107
$124,316
9
$47,381
8
$65,216
2
$80,090
FILES CLOSED FOR INCOMPLETENESS
5
$94,926
9
$90,554
41
$158,918
1
$22,190
2
$160,880
0
$0
Aggregated Statistics For Year 2006 (Based on 6 partial tracts)
A) FHA, FSA/RHS & VA Home Purchase Loans
B) Conventional Home Purchase Loans
C) Refinancings
D) Home Improvement Loans
E) Loans on Dwellings For 5+ Families
F) Non-occupant Loans on < 5 Family Dwellings (A B C & D)
G) Loans On Manufactured Home Dwelling (A B C & D)
Number
Average Value
Number
Average Value
Number
Average Value
Number
Average Value
Number
Average Value
Number
Average Value
Number
Average Value
LOANS ORIGINATED
55
$117,045
218
$99,046
304
$103,597
22
$56,482
1
$56,710
35
$98,457
8
$93,649
APPLICATIONS APPROVED, NOT ACCEPTED
2
$156,915
35
$69,747
57
$91,189
13
$23,779
0
$0
6
$85,082
6
$55,810
APPLICATIONS DENIED
12
$110,961
73
$98,174
317
$111,646
48
$75,699
0
$0
24
$76,600
16
$50,442
APPLICATIONS WITHDRAWN
5
$125,510
33
$85,906
183
$114,360
14
$94,242
0
$0
7
$53,117
0
$0
FILES CLOSED FOR INCOMPLETENESS
1
$127,850
4
$88,365
40
$121,797
0
$0
0
$0
0
$0
0
$0
Aggregated Statistics For Year 2005 (Based on 6 partial tracts)
A) FHA, FSA/RHS & VA Home Purchase Loans
B) Conventional Home Purchase Loans
C) Refinancings
D) Home Improvement Loans
F) Non-occupant Loans on < 5 Family Dwellings (A B C & D)
G) Loans On Manufactured Home Dwelling (A B C & D)
Number
Average Value
Number
Average Value
Number
Average Value
Number
Average Value
Number
Average Value
Number
Average Value
LOANS ORIGINATED
48
$107,591
270
$99,251
422
$109,352
56
$42,639
34
$111,872
14
$69,377
APPLICATIONS APPROVED, NOT ACCEPTED
3
$101,843
55
$89,009
102
$105,985
7
$31,114
2
$86,705
10
$44,100
APPLICATIONS DENIED
9
$107,914
89
$75,234
361
$111,868
65
$38,342
24
$120,663
31
$80,975
APPLICATIONS WITHDRAWN
6
$103,818
39
$89,039
244
$117,640
24
$152,822
5
$64,598
5
$110,254
FILES CLOSED FOR INCOMPLETENESS
1
$134,380
13
$104,123
43
$119,148
2
$49,310
0
$0
0
$0
Aggregated Statistics For Year 2004 (Based on 6 partial tracts)
A) FHA, FSA/RHS & VA Home Purchase Loans
B) Conventional Home Purchase Loans
C) Refinancings
D) Home Improvement Loans
E) Loans on Dwellings For 5+ Families
F) Non-occupant Loans on < 5 Family Dwellings (A B C & D)
G) Loans On Manufactured Home Dwelling (A B C & D)
2002 - 2018 National Fire Incident Reporting System (NFIRS) incidents
According to the data from the years 2002 - 2018 the average number of fire incidents per year is 58. The highest number of reported fires - 74 took place in 2014, and the least - 38 in 2002. The data has an increasing trend.
When looking into fire subcategories, the most reports belonged to: Structure Fires (51.4%), and Outside Fires (34.3%).
Fire incident types reported to NFIRS in Zip Code 45311

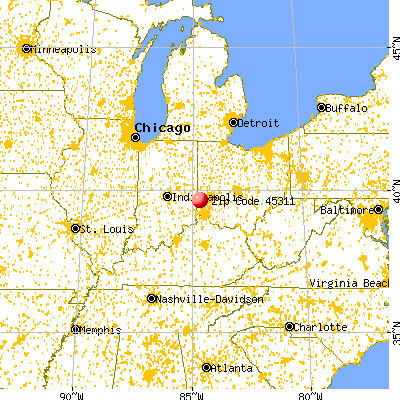


 Nearest zip codes: 45064, 45320, 45003, 45070, 45330, 45056.
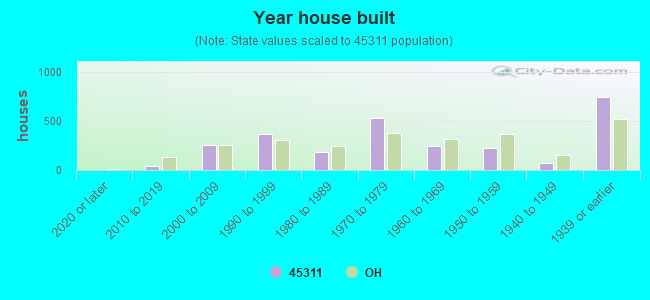


 According to the data from the years 2002 - 2018 the average number of fire incidents per year is 58. The highest number of reported fires - 74 took place in 2014, and the least - 38 in 2002. The data has an increasing trend.
 When looking into fire subcategories, the most reports belonged to: Structure Fires (51.4%), and Outside Fires (34.3%).