Estimated zip code population in 2022: 6,593 Zip code population in 2010: 4,442 Zip code population in 2000: 2,970
Houses and condos: 2,455 Renter-occupied apartments: 522
% of renters here:
23%
State:
33%
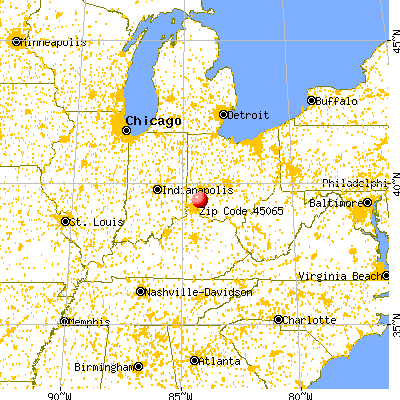
March 2022 cost of living index in zip code 45065: 88.1 (less than average, U.S. average is 100)
Land area: 2.6 sq. mi. Water area: 0.1 sq. mi.
Population density: 2,509 people per square mile
(average).
OSM Map
General Map
Google Map
MSN Map
OSM Map
General Map
Google Map
MSN Map
OSM Map
General Map
Google Map
MSN Map
OSM Map
General Map
Google Map
MSN Map
Please wait while loading the map...
Real estate property taxes paid for housing units in 2022:
This zip code:
1.4% ($2,955)
Ohio:
1.3% ($2,639)
Median real estate property taxes paid for housing units with mortgages in 2022: $4,202 (1.2%) Median real estate property taxes paid for housing units with no mortgage in 2022: $2,380 (1.4%)
Estimated median house/condo value in 2022: $217,573
45065:
$217,573
Ohio:
$204,100
According to our research of Ohio and other state lists, there were 5 registered sex offenders living in 45065 zip code as of May 28, 2024. The ratio of all residents to sex offenders in zip code 45065 is 1,001 to 1. The ratio of registered sex offenders to all residents in this zip code is lower than the state average.
Median resident age:
This zip code:
33.8 years
Ohio median age:
39.9 years
Average household size:
This zip code:
2.9 people
Ohio:
2.4 people
Averages for the 2020 tax year for zip code 45065, filed in 2021:
Average Adjusted Gross Income (AGI) in 2020: $75,606 (Individual Income Tax Returns)
Here:
$75,606
State:
$67,288
Salary/wage: $68,110 (reported on 86.7% of returns)
Here:
$68,110
State:
$55,628
(% of AGI for various income ranges: 1208.1% for AGIs below $25k, 3564.1% for AGIs $25k-50k, 6742.1% for AGIs $50k-75k, 9843.5% for AGIs $75k-100k, 18163.1% for AGIs $100k-200k, 78070.0% for AGIs over 200k)
Taxable interest for individuals: $1,135 (reported on 21.3% of returns)
This zip code:
$1,135
Ohio:
$1,518
(% of AGI for various income ranges: 5.1% for AGIs below $25k, 11.8% for AGIs $25k-50k, 17.9% for AGIs $50k-75k, 18.5% for AGIs $75k-100k, 46.6% for AGIs $100k-200k, 590.0% for AGIs over 200k)
Ordinary dividends: $4,441 (reported on 17.9% of returns)
Here:
$4,441
State:
$7,167
(% of AGI for various income ranges: 11.0% for AGIs below $25k, 20.2% for AGIs $25k-50k, 54.4% for AGIs $50k-75k, 85.5% for AGIs $75k-100k, 209.7% for AGIs $100k-200k, 1832.9% for AGIs over 200k)
Net capital gain/loss in AGI: +$11,373 (reported on 16.0% of returns)
Here:
+$11,373
State:
+$18,919
(% of AGI for various income ranges: 3.8% for AGIs below $25k, 11.1% for AGIs $25k-50k, 86.2% for AGIs $50k-75k, 122.0% for AGIs $75k-100k, 346.6% for AGIs $100k-200k, 5811.4% for AGIs over 200k)
Profit/loss from business: +$16,238 (reported on 14.5% of returns)
Here:
+$16,238
State:
+$13,744
(% of AGI for various income ranges: 105.8% for AGIs below $25k, 167.0% for AGIs $25k-50k, 121.5% for AGIs $50k-75k, 270.5% for AGIs $75k-100k, 608.6% for AGIs $100k-200k, 3938.6% for AGIs over 200k)
Taxable individual retirement arrangement distribution: $26,000 (reported on 7.1% of returns)
45065:
$26,000
Ohio:
$18,876
(% of AGI for various income ranges: 37.5% for AGIs below $25k, 73.3% for AGIs $25k-50k, 163.2% for AGIs $50k-75k, 343.5% for AGIs $75k-100k, 776.9% for AGIs $100k-200k, 1854.3% for AGIs over 200k)
Total itemized deductions: $31,635 (reported on 8.0% of returns)
Here:
$31,635
State:
$33,869
(% of AGI for various income ranges: 230.6% for AGIs $50k-75k, 306.0% for AGIs $75k-100k, 907.4% for AGIs $100k-200k, 5218.6% for AGIs over 200k)
Charity contributions: $10,425 (reported on 6.2% of returns)
Here:
$10,425
State:
$14,577
(% of AGI for various income ranges: 53.2% for AGIs $50k-75k, 242.9% for AGIs $100k-200k, 1505.7% for AGIs over 200k)
Taxes paid: $8,423 (reported on 8.0% of returns)
45065:
$8,423
State:
$7,681
(% of AGI for various income ranges: 69.7% for AGIs $50k-75k, 108.5% for AGIs $75k-100k, 289.7% for AGIs $100k-200k, 1031.4% for AGIs over 200k)
Earned income credit: $2,241 (reported on 14.2% of returns)
Here:
$2,241
State:
$2,304
(% of AGI for various income ranges: 87.0% for AGIs below $25k, 64.9% for AGIs $25k-50k)
Percentage of individuals using paid preparers for their 2020 taxes: 94.8%
Here:
95%
State:
94%
(% for various income ranges: 93.9% for AGIs below $25k, 96.0% for AGIs $25k-50k, 93.5% for AGIs $50k-75k, 96.4% for AGIs $75k-100k, 94.7% for AGIs $100k-200k, 95.0% for AGIs over 200k)
Averages for the 2012 tax year for zip code 45065, filed in 2013:
Average Adjusted Gross Income (AGI) in 2012: $67,501 (Individual Income Tax Returns)
Here:
$67,501
State:
$54,926
Salary/wage: $59,202 (reported on 90.1% of returns)
Here:
$59,202
State:
$45,869
(% of AGI for various income ranges: 80.4% for AGIs below $25k, 85.4% for AGIs $25k-50k, 86.5% for AGIs $50k-75k, 85.2% for AGIs $75k-100k, 88.9% for AGIs $100k-200k, 66.0% for AGIs over 200k)
Taxable interest for individuals: $693 (reported on 25.3% of returns)
This zip code:
$693
Ohio:
$1,297
(% of AGI for various income ranges: 0.4% for AGIs below $25k, 0.4% for AGIs $25k-50k, 0.2% for AGIs $50k-75k, 0.1% for AGIs $75k-100k, 0.2% for AGIs $100k-200k, 0.3% for AGIs over 200k)
Ordinary dividends: $4,380 (reported on 17.2% of returns)
Here:
$4,380
State:
$5,821
(% of AGI for various income ranges: 0.9% for AGIs below $25k, 0.4% for AGIs $25k-50k, 0.6% for AGIs $50k-75k, 0.8% for AGIs $75k-100k, 1.2% for AGIs $100k-200k, 1.6% for AGIs over 200k)
Net capital gain/loss in AGI: +$6,406 (reported on 13.3% of returns)
Here:
+$6,406
State:
+$11,232
(% of AGI for various income ranges: 0.3% for AGIs $75k-100k, 0.3% for AGIs $100k-200k, 3.3% for AGIs over 200k)
Profit/loss from business: +$18,169 (reported on 11.2% of returns)
Here:
+$18,169
State:
+$12,773
(% of AGI for various income ranges: 5.5% for AGIs below $25k, 1.9% for AGIs $25k-50k, 2.8% for AGIs $50k-75k, 1.2% for AGIs $100k-200k, 5.0% for AGIs over 200k)
Taxable individual retirement arrangement distribution: $14,018 (reported on 7.3% of returns)
45065:
$14,018
Ohio:
$14,511
(% of AGI for various income ranges: 1.9% for AGIs below $25k, 1.3% for AGIs $25k-50k, 1.4% for AGIs $50k-75k, 3.2% for AGIs $75k-100k, 3.2% for AGIs $100k-200k)
Total itemized deductions: $26,832 (18% of AGI, reported on 32.6% of returns)
Here:
$26,832
State:
$21,278
Here:
18.2% of AGI
State:
18.8% of AGI
(% of AGI for various income ranges: 5.5% for AGIs below $25k, 7.5% for AGIs $25k-50k, 11.2% for AGIs $50k-75k, 14.5% for AGIs $75k-100k, 17.2% for AGIs $100k-200k, 13.9% for AGIs over 200k)
Charity contributions: $4,179 (reported on 24.9% of returns)
Here:
$4,179
State:
$3,943
(% of AGI for various income ranges: 0.7% for AGIs $25k-50k, 1.1% for AGIs $50k-75k, 1.7% for AGIs $75k-100k, 2.0% for AGIs $100k-200k, 2.0% for AGIs over 200k)
Taxes paid: $12,883 (reported on 32.6% of returns)
45065:
$12,883
State:
$9,568
(% of AGI for various income ranges: 1.5% for AGIs below $25k, 2.2% for AGIs $25k-50k, 3.8% for AGIs $50k-75k, 5.9% for AGIs $75k-100k, 8.2% for AGIs $100k-200k, 8.3% for AGIs over 200k)
Earned income credit: $2,270 (reported on 18.9% of returns)
Here:
$2,270
State:
$2,285
(% of AGI for various income ranges: 7.2% for AGIs below $25k, 1.0% for AGIs $25k-50k)
Percentage of individuals using paid preparers for their 2012 taxes: 44.6%
Here:
45%
State:
51%
(% for various income ranges: 38.9% for AGIs below $25k, 48.3% for AGIs $25k-50k, 46.4% for AGIs $50k-75k, 47.1% for AGIs $75k-100k, 40.7% for AGIs $100k-200k, 69.2% for AGIs over 200k)
Averages for the 2004 tax year for zip code 45065, filed in 2005:
Average Adjusted Gross Income (AGI) in 2004: $50,935 (Individual Income Tax Returns)
Here:
$50,935
State:
$44,480
Salary/wage: $45,841 (reported on 92.4% of returns)
Here:
$45,841
State:
$39,198
(% of AGI for various income ranges: 93.4% for AGIs below $10k, 87.2% for AGIs $10k-25k, 89.6% for AGIs $25k-50k, 85.1% for AGIs $50k-75k, 90.6% for AGIs $75k-100k, 77.3% for AGIs over 100k)
Taxable interest for individuals: $805 (reported on 31.7% of returns)
This zip code:
$805
Ohio:
$1,532
(% of AGI for various income ranges: 2.8% for AGIs below $10k, 1.3% for AGIs $10k-25k, 0.3% for AGIs $25k-50k, 0.4% for AGIs $50k-75k, 0.3% for AGIs $75k-100k, 0.4% for AGIs over 100k)
Taxable dividends: $2,821 (reported on 17.3% of returns)
Here:
$2,821
State:
$3,496
(% of AGI for various income ranges: 3.8% for AGIs below $10k, 0.7% for AGIs $10k-25k, 0.0% for AGIs $25k-50k, 0.5% for AGIs $50k-75k, 0.4% for AGIs $75k-100k, 1.5% for AGIs over 100k)
Net capital gain/loss: +$7,493 (reported on 12.9% of returns)
Here:
+$7,493
State:
+$8,582
(% of AGI for various income ranges: -1.6% for AGIs below $10k, 0.2% for AGIs $10k-25k, -0.1% for AGIs $25k-50k, 0.5% for AGIs $50k-75k, -0.1% for AGIs $75k-100k, 4.0% for AGIs over 100k)
Profit/loss from business: +$11,416 (reported on 9.7% of returns)
Here:
+$11,416
State:
+$10,813
(% of AGI for various income ranges: 5.5% for AGIs below $10k, 2.1% for AGIs $10k-25k, 2.2% for AGIs $25k-50k, 2.6% for AGIs $50k-75k, 0.7% for AGIs $75k-100k, 2.2% for AGIs over 100k)
IRA payment deduction: $2,056 (reported on 1.1% of returns)
45065:
$2,056
Ohio:
$2,794
Total itemized deductions: $20,597 (19% of AGI, reported on 31.1% of returns)
Here:
$20,597
State:
$17,503
Here:
18.8% of AGI
State:
20.8% of AGI
(% of AGI for various income ranges: 4.9% for AGIs $10k-25k, 8.3% for AGIs $25k-50k, 12.8% for AGIs $50k-75k, 19.8% for AGIs $75k-100k, 14.8% for AGIs over 100k)
Charity contributions deductions: $2,778 (2% of AGI, reported on 25.0% of returns)
Here:
$2,778
State:
$3,087
Here:
2.5% of AGI
State:
3.4% of AGI
(% of AGI for various income ranges: 0.4% for AGIs $10k-25k, 0.8% for AGIs $25k-50k, 1.6% for AGIs $50k-75k, 2.1% for AGIs $75k-100k, 1.6% for AGIs over 100k)
Total tax: $8,630 (reported on 75.6% of returns)
45065:
$8,630
State:
$6,781
(% of AGI for various income ranges: 2.1% for AGIs below $10k, 4.1% for AGIs $10k-25k, 7.3% for AGIs $25k-50k, 9.0% for AGIs $50k-75k, 10.9% for AGIs $75k-100k, 18.7% for AGIs over 100k)
Earned income credit: $1,700 (reported on 17.6% of returns)
Here:
$1,700
State:
$1,696
Percentage of individuals using paid preparers for their 2004 taxes: 55.3%
Here:
55%
State:
55%
(% for various income ranges: 45.5% for AGIs below $10k, 57.9% for AGIs $10k-25k, 57.6% for AGIs $25k-50k, 57.7% for AGIs $50k-75k, 51.9% for AGIs $75k-100k, 60.1% for AGIs over 100k)
Likely homosexual households (counted as self-reported same-sex unmarried-partner households)
Lesbian couples: 0.6% of all households
Gay men: 0.0% of all households
Household received Food Stamps/SNAP in the past 12 months: 200 Household did not receive Food Stamps/SNAP in the past 12 months: 2,052
Women who had a birth in the past 12 months: 80 (52 now married, 28 unmarried) Women who did not have a birth in the past 12 months: 1,381 (764 now married, 616 unmarried)
Housing units in zip code 45065 with a mortgage: 1,006 (51 second mortgage, 52 both second mortgage and home equity loan) Median monthly owner costs for units with a mortgage: $1,792 Median monthly owner costs for units without a mortgage: $609
Residents with income below the poverty level in 2022:
This zip code:
7.4%
Whole state:
13.4%
Residents with income below 50% of the poverty level in 2022:
This zip code:
4.9%
Whole state:
7.0%
Median number of rooms in houses and condos:
Here:
7.7
State:
6.7
Median number of rooms in apartments:
Here:
4.8
State:
4.4
Notable locations in this zip code not listed on our city pages
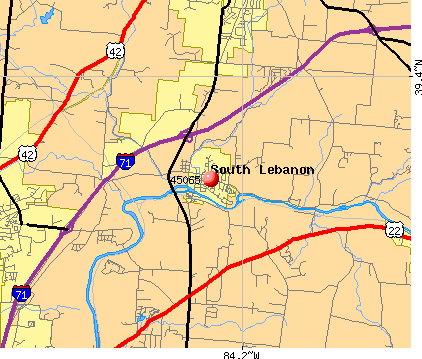
Notable locations in zip code 45065: Union Township and South Lebanon Fire Department (A), South Lebanon Town Hall (B). Display/hide their locations on the map
In group quarters: 16 (-1 institutionalized population)
Size of family households: 501 2-persons, 219 3-persons, 514 4-persons, 106 5-persons, 192 6-persons, 99 7-or-more-persons
Size of nonfamily households: 476 1-person, 112 2-persons, 11 4-persons
1,413 married couples with children.
299 single-parent households (21 men, 278 women).
93.9% of residents of 45065 zip code speak English at home.
2.4% of residents speak Spanish at home (66% very well, 24% well, 10% not well).
0.6% of residents speak other Indo-European language at home (100% very well).
2.2% of residents speak Asian or Pacific Island language at home (49% very well, 12% well, 38% not well).
Foreign born population: 247 (3.7%) (43.0% of them are naturalized citizens)
This zip code:
3.7%
Whole state:
5.0%
26%Bhutan
20%Lithuania
10%Netherlands
9%Bulgaria
5%Belgium
1%Eritrea
52%English
13%German
6%Irish
6%European
4%American
4%French Canadian
4%Russian
Year of entry for the foreign-born population
1102010 or later
262000 to 2009
711990 to 1999
52Before 1990
Facilities with environmental interests located in this zip code:
BREWER CO PLT 18 (4000 TURTLE CREEK RD in SOUTH LEBANON, OH)
USED OIL PROGRAM (Resource Conservation and Recovery Act (tracking hazardous waste))
Housing units lacking complete plumbing facilities: 1.6% Housing units lacking complete kitchen facilities: 1.5%
50.8%Utility gas
41.9%Electricity
4.3%Fuel oil, kerosene, etc.
1.7%Other fuel
1.4%Bottled, tank, or LP gas
Population in 1990: 2,774. Population change in the 1990s: +196 (+7.1%).
Place of birth for U.S.-born residents:
This state: 4,206
Northeast: 428
Midwest: 671
South: 901
West: 110
58% of the 45065 zip code residents lived in the same house 5 years ago. Out of people who lived in different houses, 63% lived in this county. Out of people who lived in different counties, 50% lived in Ohio.
88% of the 45065 zip code residents lived in the same house 1 year ago. Out of people who lived in different houses, 53% moved from this county. Out of people who lived in different houses, 38% moved from different county within same state. Out of people who lived in different houses, 6% moved from different state.
Private vs. public school enrollment:
Students in private schools in grades 1 to 8 (elementary and middle school): 95
Here:
8.1%
Ohio:
16.0%
Students in private schools in grades 9 to 12 (high school): 66
Here:
13.2%
Ohio:
13.1%
Students in private undergraduate colleges:
Here:
0.0%
Ohio:
22.3%
Occupation by median earnings in the past 12 months ($)
213,129Health diagnosing and treating practitioners and other technical occupations
107,912Management occupations
90,710Architecture and engineering occupations
79,316Computer and mathematical occupations
55,452Sales and related occupations
50,131Community and social service occupations
Top industries in this zip code by the number of employees in 2005:
Health Care and Social Assistance: Child Day Care Services (20-49 employees: 1 establishment, 10-19 employees: 1 establishment)
Accommodation and Food Services: Limited-Service Restaurants (10-19: 1)
Administrative and Support and Waste Management and Remediation Services: Janitorial Services (10-19: 1)
Construction: Roofing Contractors (10-19: 1)
Real Estate and Rental and Leasing: Lessors of Residential Buildings and Dwellings (5-9: 1, 1-4: 1)
Professional, Scientific, and Technical Services: Veterinary Services (5-9: 1)
People in group quarters in 2010:
14 people in emergency and transitional shelters (with sleeping facilities) for people experiencing homelessness
2 people in group homes intended for adults
Home Mortgage Disclosure Act Aggregated Statistics For Year 2009 (Based on 4 partial tracts)
A) FHA, FSA/RHS & VA Home Purchase Loans
B) Conventional Home Purchase Loans
C) Refinancings
D) Home Improvement Loans
F) Non-occupant Loans on < 5 Family Dwellings (A B C & D)
Number
Average Value
Number
Average Value
Number
Average Value
Number
Average Value
Number
Average Value
LOANS ORIGINATED
21
$156,904
22
$215,035
93
$198,624
3
$62,493
3
$100,350
APPLICATIONS APPROVED, NOT ACCEPTED
1
$111,120
2
$253,125
7
$226,480
0
$0
0
$0
APPLICATIONS DENIED
2
$115,390
2
$176,630
28
$212,856
2
$27,390
2
$84,770
APPLICATIONS WITHDRAWN
2
$181,645
2
$226,595
12
$181,394
0
$0
0
$0
FILES CLOSED FOR INCOMPLETENESS
0
$0
0
$0
3
$259,150
0
$0
0
$0
Aggregated Statistics For Year 2008 (Based on 4 partial tracts)
A) FHA, FSA/RHS & VA Home Purchase Loans
B) Conventional Home Purchase Loans
C) Refinancings
D) Home Improvement Loans
F) Non-occupant Loans on < 5 Family Dwellings (A B C & D)
Number
Average Value
Number
Average Value
Number
Average Value
Number
Average Value
Number
Average Value
LOANS ORIGINATED
15
$162,406
30
$220,376
41
$186,813
4
$38,208
5
$110,074
APPLICATIONS APPROVED, NOT ACCEPTED
0
$0
2
$206,800
6
$179,848
1
$8,090
1
$159,350
APPLICATIONS DENIED
2
$184,680
4
$270,890
24
$181,324
2
$86,365
1
$185,570
APPLICATIONS WITHDRAWN
1
$194,230
3
$249,883
8
$197,280
0
$0
0
$0
FILES CLOSED FOR INCOMPLETENESS
0
$0
0
$0
2
$278,120
0
$0
0
$0
Aggregated Statistics For Year 2007 (Based on 4 partial tracts)
A) FHA, FSA/RHS & VA Home Purchase Loans
B) Conventional Home Purchase Loans
C) Refinancings
D) Home Improvement Loans
F) Non-occupant Loans on < 5 Family Dwellings (A B C & D)
G) Loans On Manufactured Home Dwelling (A B C & D)
Number
Average Value
Number
Average Value
Number
Average Value
Number
Average Value
Number
Average Value
Number
Average Value
LOANS ORIGINATED
5
$176,602
57
$180,951
42
$170,460
5
$36,416
7
$119,047
1
$56,210
APPLICATIONS APPROVED, NOT ACCEPTED
0
$0
6
$155,703
9
$139,127
1
$38,760
1
$113,480
0
$0
APPLICATIONS DENIED
1
$166,930
8
$136,055
29
$173,030
4
$59,720
3
$132,120
1
$14,140
APPLICATIONS WITHDRAWN
1
$170,900
4
$182,182
10
$173,063
1
$28,750
0
$0
0
$0
FILES CLOSED FOR INCOMPLETENESS
0
$0
1
$115,320
5
$162,560
0
$0
0
$0
0
$0
Aggregated Statistics For Year 2006 (Based on 4 partial tracts)
A) FHA, FSA/RHS & VA Home Purchase Loans
B) Conventional Home Purchase Loans
C) Refinancings
D) Home Improvement Loans
F) Non-occupant Loans on < 5 Family Dwellings (A B C & D)
G) Loans On Manufactured Home Dwelling (A B C & D)
Number
Average Value
Number
Average Value
Number
Average Value
Number
Average Value
Number
Average Value
Number
Average Value
LOANS ORIGINATED
5
$158,462
65
$176,043
45
$154,662
6
$55,335
7
$134,569
0
$0
APPLICATIONS APPROVED, NOT ACCEPTED
1
$139,360
7
$164,087
10
$135,067
1
$29,440
1
$125,550
0
$0
APPLICATIONS DENIED
0
$0
9
$158,091
31
$149,271
5
$54,296
4
$118,608
1
$35,070
APPLICATIONS WITHDRAWN
0
$0
6
$145,582
19
$145,387
1
$69,620
1
$148,530
0
$0
FILES CLOSED FOR INCOMPLETENESS
0
$0
2
$118,605
5
$164,608
0
$0
1
$35,280
0
$0
Aggregated Statistics For Year 2005 (Based on 4 partial tracts)
A) FHA, FSA/RHS & VA Home Purchase Loans
B) Conventional Home Purchase Loans
C) Refinancings
D) Home Improvement Loans
F) Non-occupant Loans on < 5 Family Dwellings (A B C & D)
G) Loans On Manufactured Home Dwelling (A B C & D)
Number
Average Value
Number
Average Value
Number
Average Value
Number
Average Value
Number
Average Value
Number
Average Value
LOANS ORIGINATED
4
$161,105
79
$169,985
59
$165,885
7
$40,739
7
$104,293
0
$0
APPLICATIONS APPROVED, NOT ACCEPTED
0
$0
8
$185,988
12
$129,431
1
$30,300
1
$115,650
0
$0
APPLICATIONS DENIED
0
$0
12
$168,368
35
$143,506
5
$42,220
2
$101,970
1
$55,160
APPLICATIONS WITHDRAWN
0
$0
7
$218,876
20
$153,686
2
$162,785
1
$150,970
0
$0
FILES CLOSED FOR INCOMPLETENESS
0
$0
2
$156,765
7
$177,186
1
$34,960
0
$0
0
$0
Aggregated Statistics For Year 2004 (Based on 4 partial tracts)
A) FHA, FSA/RHS & VA Home Purchase Loans
B) Conventional Home Purchase Loans
C) Refinancings
D) Home Improvement Loans
F) Non-occupant Loans on < 5 Family Dwellings (A B C & D)
G) Loans On Manufactured Home Dwelling (A B C & D)
Number
Average Value
Number
Average Value
Number
Average Value
Number
Average Value
Number
Average Value
Number
Average Value
LOANS ORIGINATED
8
$148,788
69
$172,107
63
$155,069
4
$46,345
5
$107,090
0
$0
APPLICATIONS APPROVED, NOT ACCEPTED
0
$0
5
$132,544
10
$159,281
1
$85,320
1
$101,990
0
$0
APPLICATIONS DENIED
1
$59,610
8
$140,392
32
$136,223
5
$37,522
1
$121,030
1
$25,670
APPLICATIONS WITHDRAWN
0
$0
7
$176,150
22
$131,358
1
$33,560
0
$0
0
$0
FILES CLOSED FOR INCOMPLETENESS
0
$0
1
$151,630
4
$201,312
2
$22,205
0
$0
0
$0
Aggregated Statistics For Year 2003 (Based on 4 partial tracts)
A) FHA, FSA/RHS & VA Home Purchase Loans
B) Conventional Home Purchase Loans
C) Refinancings
D) Home Improvement Loans
F) Non-occupant Loans on < 5 Family Dwellings (A B C & D)
Number
Average Value
Number
Average Value
Number
Average Value
Number
Average Value
Number
Average Value
LOANS ORIGINATED
13
$138,899
58
$179,315
147
$163,643
3
$50,397
5
$123,192
APPLICATIONS APPROVED, NOT ACCEPTED
0
$0
4
$154,538
18
$149,982
1
$32,600
0
$0
APPLICATIONS DENIED
1
$136,810
6
$141,620
36
$137,777
4
$26,908
1
$71,510
APPLICATIONS WITHDRAWN
0
$0
4
$218,715
22
$138,220
0
$0
1
$74,520
FILES CLOSED FOR INCOMPLETENESS
0
$0
2
$145,425
8
$136,862
0
$0
1
$59,470
Aggregated Statistics For Year 2002 (Based on 2 partial tracts)
A) FHA, FSA/RHS & VA Home Purchase Loans
B) Conventional Home Purchase Loans
C) Refinancings
D) Home Improvement Loans
F) Non-occupant Loans on < 5 Family Dwellings (A B C & D)
Number
Average Value
Number
Average Value
Number
Average Value
Number
Average Value
Number
Average Value
LOANS ORIGINATED
4
$89,188
17
$164,405
56
$144,109
2
$23,670
1
$129,360
APPLICATIONS APPROVED, NOT ACCEPTED
0
$0
3
$96,683
8
$120,032
1
$15,310
0
$0
APPLICATIONS DENIED
0
$0
5
$88,598
17
$110,880
2
$15,490
1
$23,060
APPLICATIONS WITHDRAWN
0
$0
2
$130,590
8
$135,586
1
$25,170
0
$0
FILES CLOSED FOR INCOMPLETENESS
0
$0
0
$0
4
$100,188
0
$0
0
$0
Aggregated Statistics For Year 2001 (Based on 2 partial tracts)
A) FHA, FSA/RHS & VA Home Purchase Loans
B) Conventional Home Purchase Loans
C) Refinancings
D) Home Improvement Loans
F) Non-occupant Loans on < 5 Family Dwellings (A B C & D)
Number
Average Value
Number
Average Value
Number
Average Value
Number
Average Value
Number
Average Value
LOANS ORIGINATED
8
$110,638
13
$179,222
49
$134,586
3
$36,550
2
$61,865
APPLICATIONS APPROVED, NOT ACCEPTED
0
$0
2
$45,145
11
$114,048
1
$26,050
0
$0
APPLICATIONS DENIED
1
$91,700
4
$60,675
20
$100,170
3
$10,207
0
$0
APPLICATIONS WITHDRAWN
0
$0
1
$165,970
12
$96,418
1
$22,000
0
$0
FILES CLOSED FOR INCOMPLETENESS
0
$0
0
$0
2
$98,470
0
$0
0
$0
Aggregated Statistics For Year 2000 (Based on 2 partial tracts)
A) FHA, FSA/RHS & VA Home Purchase Loans
B) Conventional Home Purchase Loans
C) Refinancings
D) Home Improvement Loans
F) Non-occupant Loans on < 5 Family Dwellings (A B C & D)
Number
Average Value
Number
Average Value
Number
Average Value
Number
Average Value
Number
Average Value
LOANS ORIGINATED
3
$79,553
17
$125,954
16
$91,883
4
$16,852
2
$63,890
APPLICATIONS APPROVED, NOT ACCEPTED
0
$0
3
$137,457
7
$70,500
2
$26,225
0
$0
APPLICATIONS DENIED
0
$0
8
$40,216
13
$95,311
5
$13,622
1
$65,470
APPLICATIONS WITHDRAWN
1
$55,790
2
$127,510
5
$115,210
1
$51,740
0
$0
FILES CLOSED FOR INCOMPLETENESS
0
$0
0
$0
2
$118,095
0
$0
0
$0
Aggregated Statistics For Year 1999 (Based on 2 partial tracts)
A) FHA, FSA/RHS & VA Home Purchase Loans
B) Conventional Home Purchase Loans
C) Refinancings
D) Home Improvement Loans
F) Non-occupant Loans on < 5 Family Dwellings (A B C & D)
Detailed PMIC statistics for the following Tracts:0321.00
, 0322.01
2002 - 2018 National Fire Incident Reporting System (NFIRS) incidents
According to the data from the years 2002 - 2018 the average number of fires per year is 27. The highest number of reported fire incidents - 45 took place in 2010, and the least - 12 in 2003. The data has an increasing trend.
When looking into fire subcategories, the most reports belonged to: Structure Fires (44.8%), and Outside Fires (42.8%).
Fire incident types reported to NFIRS in Zip Code 45065


 Nearest zip codes: 45034, 45039, 45036, 45152, 45040, 45140.


 According to the data from the years 2002 - 2018 the average number of fires per year is 27. The highest number of reported fire incidents - 45 took place in 2010, and the least - 12 in 2003. The data has an increasing trend.
 When looking into fire subcategories, the most reports belonged to: Structure Fires (44.8%), and Outside Fires (42.8%).