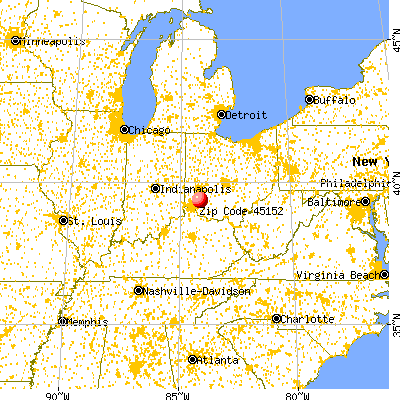
Estimated zip code population in 2022: 13,595 Zip code population in 2010: 11,329 Zip code population in 2000: 8,112
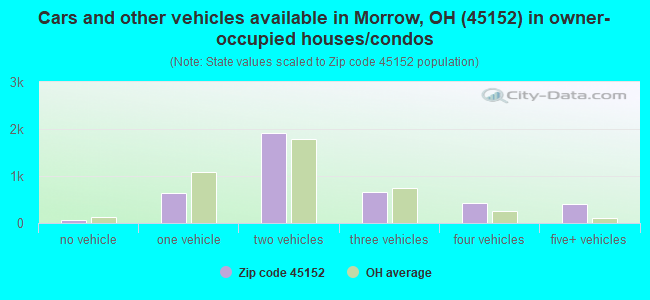
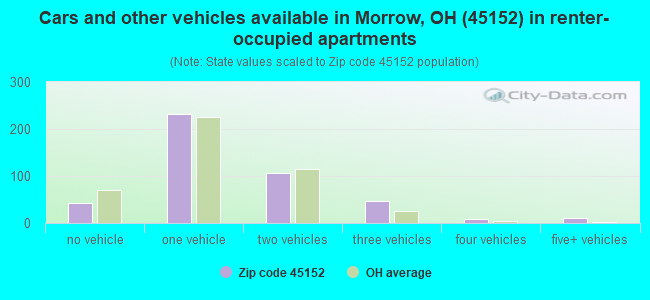
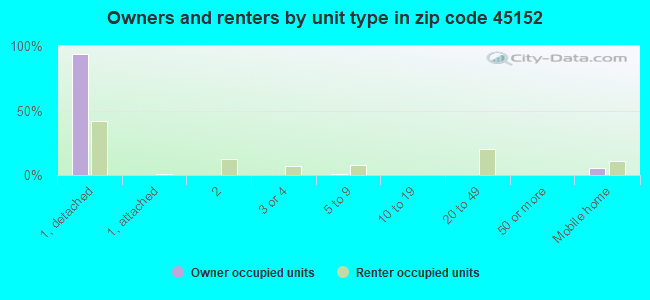
Houses and condos: 5,014 Renter-occupied apartments: 446
% of renters here:
10%
State:
33%
March 2022 cost of living index in zip code 45152: 85.3 (less than average, U.S. average is 100)
Land area: 51.6 sq. mi. Water area: 0.2 sq. mi.
Population density: 264 people per square mile
(very low).
OSM Map
General Map
Google Map
MSN Map
OSM Map
General Map
Google Map
MSN Map
OSM Map
General Map
Google Map
MSN Map
OSM Map
General Map
Google Map
MSN Map
Please wait while loading the map...
Real estate property taxes paid for housing units in 2022:
This zip code:
1.2% ($3,979)
Ohio:
1.3% ($2,639)
Median real estate property taxes paid for housing units with mortgages in 2022: $4,506 (1.3%) Median real estate property taxes paid for housing units with no mortgage in 2022: $3,017 (1.2%)
Business Search- 14 Million verified businesses
Males: 6,743
(49.6%)
Females: 6,851
(50.4%)
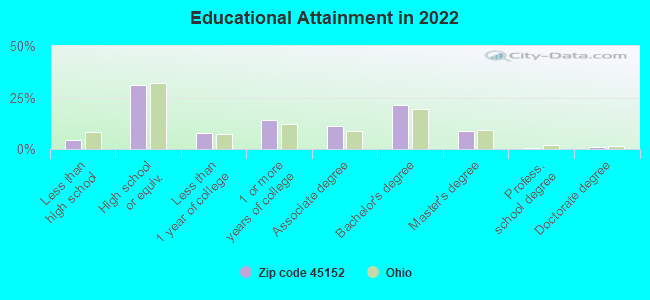
For population 25 years and over in 45152:
High school or higher: 95.7%
Bachelor's degree or higher: 31.5%
Graduate or professional degree: 10.3%
Unemployed: 2.8%
Mean travel time to work (commute): 29.1 minutes
For population 15 years and over in 45152:
Never married: 27.1%
Now married: 57.5%
Separated: 0.6%
Widowed: 4.4%
Divorced: 10.4%
Zip code 45152 compared to state average:
Median household income above state average.
Median house value above state average.
Black race population percentage significantly below state average.
Foreign-born population percentage below state average.
Renting percentage significantly below state average.
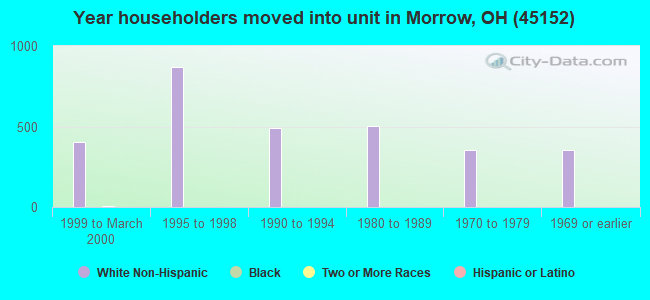
Length of stay since moving in below state average.
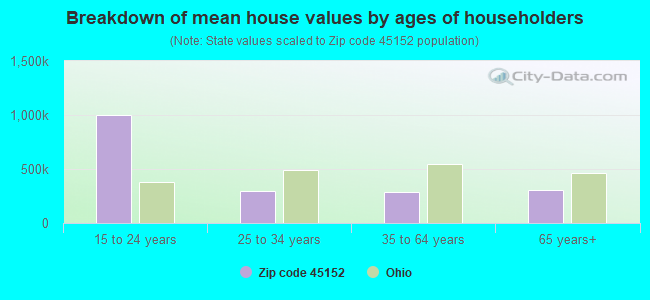
Estimated median house/condo value in 2022: $331,704
45152:
$331,704
Ohio:
$204,100
According to our research of Ohio and other state lists, there were 15 registered sex offenders living in 45152 zip code as of June 07, 2024. The ratio of all residents to sex offenders in zip code 45152 is 823 to 1. The ratio of registered sex offenders to all residents in this zip code is lower than the state average.
Median resident age:
This zip code:
40.7 years
Ohio median age:
39.9 years
Average household size:
This zip code:
3.0 people
Ohio:
2.4 people
Averages for the 2020 tax year for zip code 45152, filed in 2021:
Average Adjusted Gross Income (AGI) in 2020: $83,012 (Individual Income Tax Returns)
Here:
$83,012
State:
$67,288
Salary/wage: $73,071 (reported on 85.9% of returns)
Here:
$73,071
State:
$55,628
(% of AGI for various income ranges: 1185.7% for AGIs below $25k, 3634.3% for AGIs $25k-50k, 6367.3% for AGIs $50k-75k, 9241.4% for AGIs $75k-100k, 18242.2% for AGIs $100k-200k, 69663.8% for AGIs over 200k)
Taxable interest for individuals: $922 (reported on 29.1% of returns)
This zip code:
$922
Ohio:
$1,518
(% of AGI for various income ranges: 7.9% for AGIs below $25k, 10.6% for AGIs $25k-50k, 26.7% for AGIs $50k-75k, 52.4% for AGIs $75k-100k, 55.8% for AGIs $100k-200k, 423.8% for AGIs over 200k)
Ordinary dividends: $4,497 (reported on 22.1% of returns)
Here:
$4,497
State:
$7,167
(% of AGI for various income ranges: 25.9% for AGIs below $25k, 29.9% for AGIs $25k-50k, 63.2% for AGIs $50k-75k, 142.1% for AGIs $75k-100k, 208.3% for AGIs $100k-200k, 2106.9% for AGIs over 200k)
Net capital gain/loss in AGI: +$16,848 (reported on 18.2% of returns)
Here:
+$16,848
State:
+$18,919
(% of AGI for various income ranges: 14.0% for AGIs below $25k, 27.8% for AGIs $25k-50k, 73.5% for AGIs $50k-75k, 150.7% for AGIs $75k-100k, 393.2% for AGIs $100k-200k, 11450.8% for AGIs over 200k)
Profit/loss from business: +$14,581 (reported on 15.7% of returns)
Here:
+$14,581
State:
+$13,744
(% of AGI for various income ranges: 138.9% for AGIs below $25k, 133.7% for AGIs $25k-50k, 231.5% for AGIs $50k-75k, 287.4% for AGIs $75k-100k, 593.3% for AGIs $100k-200k, 2468.5% for AGIs over 200k)
Taxable individual retirement arrangement distribution: $23,627 (reported on 9.3% of returns)
45152:
$23,627
Ohio:
$18,876
(% of AGI for various income ranges: 62.4% for AGIs below $25k, 87.6% for AGIs $25k-50k, 205.0% for AGIs $50k-75k, 401.2% for AGIs $75k-100k, 594.7% for AGIs $100k-200k, 2621.5% for AGIs over 200k)
Self-employed (Keogh) retirement plans: $17,700 (reported on 0.4% of returns)
45152:
$17,700
Ohio:
$24,898
(% of AGI for various income ranges: 55.3% for AGIs $100k-200k)
Total itemized deductions: $34,681 (reported on 8.8% of returns)
Here:
$34,681
State:
$33,869
(% of AGI for various income ranges: 37.8% for AGIs below $25k, 78.5% for AGIs $25k-50k, 243.7% for AGIs $50k-75k, 432.8% for AGIs $75k-100k, 743.0% for AGIs $100k-200k, 5906.2% for AGIs over 200k)
Charity contributions: $12,311 (reported on 6.9% of returns)
Here:
$12,311
State:
$14,577
(% of AGI for various income ranges: 10.2% for AGIs $25k-50k, 31.5% for AGIs $50k-75k, 61.2% for AGIs $75k-100k, 210.9% for AGIs $100k-200k, 2253.8% for AGIs over 200k)
Taxes paid: $7,921 (reported on 8.7% of returns)
45152:
$7,921
State:
$7,681
(% of AGI for various income ranges: 23.0% for AGIs $25k-50k, 51.5% for AGIs $50k-75k, 112.2% for AGIs $75k-100k, 211.2% for AGIs $100k-200k, 977.7% for AGIs over 200k)
Earned income credit: $2,072 (reported on 9.0% of returns)
Here:
$2,072
State:
$2,304
(% of AGI for various income ranges: 62.6% for AGIs below $25k, 51.3% for AGIs $25k-50k, 1.9% for AGIs $50k-75k)
Percentage of individuals using paid preparers for their 2020 taxes: 94.2%
Here:
94%
State:
94%
(% for various income ranges: 92.4% for AGIs below $25k, 95.3% for AGIs $25k-50k, 95.2% for AGIs $50k-75k, 95.1% for AGIs $75k-100k, 94.3% for AGIs $100k-200k, 92.3% for AGIs over 200k)
Averages for the 2012 tax year for zip code 45152, filed in 2013:
Average Adjusted Gross Income (AGI) in 2012: $66,220 (Individual Income Tax Returns)
Here:
$66,220
State:
$54,926
Salary/wage: $58,217 (reported on 86.5% of returns)
Here:
$58,217
State:
$45,869
(% of AGI for various income ranges: 71.8% for AGIs below $25k, 79.2% for AGIs $25k-50k, 79.1% for AGIs $50k-75k, 82.7% for AGIs $75k-100k, 82.8% for AGIs $100k-200k, 56.5% for AGIs over 200k)
Taxable interest for individuals: $926 (reported on 32.5% of returns)
This zip code:
$926
Ohio:
$1,297
(% of AGI for various income ranges: 1.0% for AGIs below $25k, 0.6% for AGIs $25k-50k, 0.3% for AGIs $50k-75k, 0.4% for AGIs $75k-100k, 0.3% for AGIs $100k-200k, 0.6% for AGIs over 200k)
Ordinary dividends: $3,295 (reported on 24.1% of returns)
Here:
$3,295
State:
$5,821
(% of AGI for various income ranges: 1.5% for AGIs below $25k, 0.7% for AGIs $25k-50k, 0.6% for AGIs $50k-75k, 0.9% for AGIs $75k-100k, 1.1% for AGIs $100k-200k, 2.3% for AGIs over 200k)
Net capital gain/loss in AGI: +$7,766 (reported on 16.3% of returns)
Here:
+$7,766
State:
+$11,232
(% of AGI for various income ranges: 0.5% for AGIs below $25k, 0.5% for AGIs $50k-75k, 0.5% for AGIs $75k-100k, 0.9% for AGIs $100k-200k, 7.4% for AGIs over 200k)
Profit/loss from business: +$11,239 (reported on 16.3% of returns)
Here:
+$11,239
State:
+$12,773
(% of AGI for various income ranges: 8.6% for AGIs below $25k, 2.9% for AGIs $25k-50k, 2.7% for AGIs $50k-75k, 2.4% for AGIs $75k-100k, 2.9% for AGIs $100k-200k, 1.0% for AGIs over 200k)
Taxable individual retirement arrangement distribution: $16,997 (reported on 10.8% of returns)
45152:
$16,997
Ohio:
$14,511
(% of AGI for various income ranges: 3.8% for AGIs below $25k, 2.4% for AGIs $25k-50k, 2.9% for AGIs $50k-75k, 2.8% for AGIs $75k-100k, 3.1% for AGIs $100k-200k, 2.2% for AGIs over 200k)
Self-employment retirement plans: $20,400 (reported on 0.6% of returns)
45152:
$20,400
Ohio:
$20,257
(% of AGI for various income ranges: 0.5% for AGIs $100k-200k)
Total itemized deductions: $22,071 (21% of AGI, reported on 44.5% of returns)
Here:
$22,071
State:
$21,278
Here:
20.5% of AGI
State:
18.8% of AGI
(% of AGI for various income ranges: 12.8% for AGIs below $25k, 12.0% for AGIs $25k-50k, 15.1% for AGIs $50k-75k, 14.7% for AGIs $75k-100k, 16.0% for AGIs $100k-200k, 15.0% for AGIs over 200k)
Charity contributions: $3,190 (reported on 34.0% of returns)
Here:
$3,190
State:
$3,943
(% of AGI for various income ranges: 0.8% for AGIs below $25k, 1.2% for AGIs $25k-50k, 1.6% for AGIs $50k-75k, 1.4% for AGIs $75k-100k, 2.0% for AGIs $100k-200k, 1.8% for AGIs over 200k)
Taxes paid: $9,151 (reported on 44.3% of returns)
45152:
$9,151
State:
$9,568
(% of AGI for various income ranges: 2.6% for AGIs below $25k, 3.6% for AGIs $25k-50k, 5.4% for AGIs $50k-75k, 5.8% for AGIs $75k-100k, 7.1% for AGIs $100k-200k, 7.8% for AGIs over 200k)
Earned income credit: $2,178 (reported on 11.2% of returns)
Here:
$2,178
State:
$2,285
(% of AGI for various income ranges: 5.2% for AGIs below $25k, 0.7% for AGIs $25k-50k)
Percentage of individuals using paid preparers for their 2012 taxes: 48.8%
Here:
49%
State:
51%
(% for various income ranges: 45.9% for AGIs below $25k, 50.0% for AGIs $25k-50k, 51.8% for AGIs $50k-75k, 47.7% for AGIs $75k-100k, 47.7% for AGIs $100k-200k, 64.7% for AGIs over 200k)
Averages for the 2004 tax year for zip code 45152, filed in 2005:
Average Adjusted Gross Income (AGI) in 2004: $53,132 (Individual Income Tax Returns)
Here:
$53,132
State:
$44,480
Salary/wage: $47,647 (reported on 89.0% of returns)
Here:
$47,647
State:
$39,198
(% of AGI for various income ranges: 144.1% for AGIs below $10k, 75.4% for AGIs $10k-25k, 82.6% for AGIs $25k-50k, 83.7% for AGIs $50k-75k, 85.5% for AGIs $75k-100k, 72.7% for AGIs over 100k)
Taxable interest for individuals: $1,201 (reported on 45.0% of returns)
This zip code:
$1,201
Ohio:
$1,532
(% of AGI for various income ranges: 8.1% for AGIs below $10k, 1.9% for AGIs $10k-25k, 0.9% for AGIs $25k-50k, 0.8% for AGIs $50k-75k, 0.7% for AGIs $75k-100k, 1.0% for AGIs over 100k)
Taxable dividends: $2,185 (reported on 27.1% of returns)
Here:
$2,185
State:
$3,496
(% of AGI for various income ranges: 4.2% for AGIs below $10k, 1.0% for AGIs $10k-25k, 0.8% for AGIs $25k-50k, 1.0% for AGIs $50k-75k, 0.8% for AGIs $75k-100k, 1.4% for AGIs over 100k)
Net capital gain/loss: +$5,937 (reported on 18.9% of returns)
Here:
+$5,937
State:
+$8,582
(% of AGI for various income ranges: -3.0% for AGIs below $10k, 0.5% for AGIs $10k-25k, 0.3% for AGIs $25k-50k, 1.0% for AGIs $50k-75k, 1.4% for AGIs $75k-100k, 4.3% for AGIs over 100k)
Profit/loss from business: +$11,987 (reported on 15.6% of returns)
Here:
+$11,987
State:
+$10,813
(% of AGI for various income ranges: 1.5% for AGIs below $10k, 6.1% for AGIs $10k-25k, 3.7% for AGIs $25k-50k, 2.4% for AGIs $50k-75k, 3.5% for AGIs $75k-100k, 3.6% for AGIs over 100k)
IRA payment deduction: $3,085 (reported on 2.1% of returns)
45152:
$3,085
Ohio:
$2,794
(% of AGI for various income ranges: 0.2% for AGIs $10k-25k, 0.2% for AGIs $25k-50k, 0.1% for AGIs $50k-75k, 0.1% for AGIs $75k-100k, 0.1% for AGIs over 100k)
Self-employed pension: $11,800 (reported on 0.4% of returns)
Here:
$11,800
Ohio:
$13,981
Total itemized deductions: $18,567 (22% of AGI, reported on 47.1% of returns)
Here:
$18,567
State:
$17,503
Here:
21.8% of AGI
State:
20.8% of AGI
(% of AGI for various income ranges: 12.6% for AGIs below $10k, 8.5% for AGIs $10k-25k, 14.1% for AGIs $25k-50k, 17.9% for AGIs $50k-75k, 17.5% for AGIs $75k-100k, 17.7% for AGIs over 100k)
Charity contributions deductions: $2,905 (3% of AGI, reported on 37.6% of returns)
Here:
$2,905
State:
$3,087
Here:
3.2% of AGI
State:
3.4% of AGI
(% of AGI for various income ranges: 0.9% for AGIs below $10k, 0.7% for AGIs $10k-25k, 1.2% for AGIs $25k-50k, 1.8% for AGIs $50k-75k, 1.9% for AGIs $75k-100k, 3.0% for AGIs over 100k)
Total tax: $7,598 (reported on 81.4% of returns)
45152:
$7,598
State:
$6,781
(% of AGI for various income ranges: 4.0% for AGIs below $10k, 4.8% for AGIs $10k-25k, 7.4% for AGIs $25k-50k, 8.8% for AGIs $50k-75k, 10.3% for AGIs $75k-100k, 17.2% for AGIs over 100k)
Earned income credit: $1,672 (reported on 9.1% of returns)
Here:
$1,672
State:
$1,696
Percentage of individuals using paid preparers for their 2004 taxes: 53.1%
Here:
53%
State:
55%
(% for various income ranges: 40.2% for AGIs below $10k, 55.3% for AGIs $10k-25k, 58.2% for AGIs $25k-50k, 55.7% for AGIs $50k-75k, 49.5% for AGIs $75k-100k, 56.1% for AGIs over 100k)
Likely homosexual households (counted as self-reported same-sex unmarried-partner households)
Lesbian couples: 0.2% of all households
Gay men: 0.0% of all households
Household received Food Stamps/SNAP in the past 12 months: 190 Household did not receive Food Stamps/SNAP in the past 12 months: 4,341
Women who had a birth in the past 12 months: 93 (96 now married, 0 unmarried) Women who did not have a birth in the past 12 months: 3,164 (1,373 now married, 1,790 unmarried)
Housing units in zip code 45152 with a mortgage: 2,620 (67 second mortgage, 66 both second mortgage and home equity loan) Houses without a mortgage: 103
Median monthly owner costs for units with a mortgage: $1,927 Median monthly owner costs for units without a mortgage: $730
Residents with income below the poverty level in 2022:
This zip code:
4.3%
Whole state:
13.4%
Residents with income below 50% of the poverty level in 2022:
This zip code:
2.5%
Whole state:
7.0%
Median number of rooms in houses and condos:
Here:
7.4
State:
6.7
Median number of rooms in apartments:
Here:
4.5
State:
4.4
Notable locations in this zip code not listed on our city pages
Notable locations in zip code 45152: Whip-Poor-Will Camp (A), Stubbs Mill (B), Glenview Farms (C), Howry Farms (D), Camp Wy-ca-key (E), Bigfoot Run Sanitary Landfill (F), Hamilton Township Fire and Rescue Station 77 (G), Salem / Morrow Fire and Emergency Medical Services 71 (H), Salem Township Public Library (I). Display/hide their locations on the map
Churches in zip code 45152 include: Sugar Run Church (A), Morrow Church of the Nazarene (B), Morrow United Methodist Church (C), Presbyterian Church of Morrow (D), Zoar Methodist Church (E). Display/hide their locations on the map
Cemeteries: Gheils Cemetery (1), Howard Cemetery (2), Landaker Cemetery (3), Ertel Cemetery (4), Gibbs Cemetery (5), Morrow Cemetery (6), Old Quaker Cemetery (7). Display/hide their locations on the map
Lakes and reservoirs: Four Winds Lake (A), Burton Lake (B), Piney Wood Lake (C), Happy Times Farm Pond (D), Bel-Wood Country Club Lake (E), Oeder Lake (F), Winding Creek Farms Pond (G), Harper Pond (H). Display/hide their locations on the map
Streams, rivers, and creeks: Muntz Run (A), Lick Run (B), Kunkers Run (C), Harpers Run (D), Agins Run (E), Todd Fork (F), Sugar Run (G), Stony Run (H), First Creek (I). Display/hide their locations on the map
2,417 married couples with children.
632 single-parent households (322 men, 310 women).
96.2% of residents of 45152 zip code speak English at home.
1.6% of residents speak Spanish at home (67% very well, 29% well, 2% not well, 2% not at all).
0.4% of residents speak other Indo-European language at home (60% very well, 40% not well).
1.2% of residents speak Asian or Pacific Island language at home (85% very well, 4% well, 11% not well).
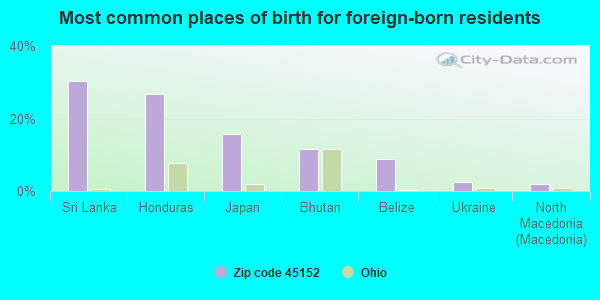
Foreign born population: 293 (2.2%) (35.8% of them are naturalized citizens)
This zip code:
2.2%
Whole state:
5.0%
30%Sri Lanka
27%Honduras
16%Japan
12%Bhutan
9%Belize
2%Ukraine
2%North Macedonia (Macedonia)
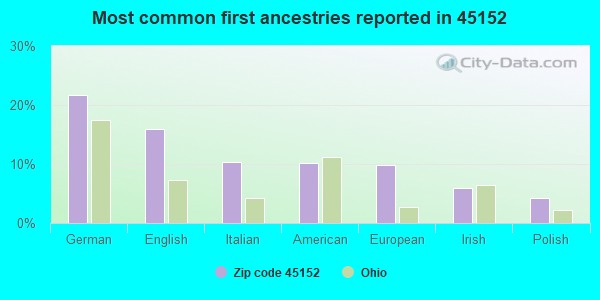
22%German
16%English
10%Italian
10%American
10%European
6%Irish
4%Polish
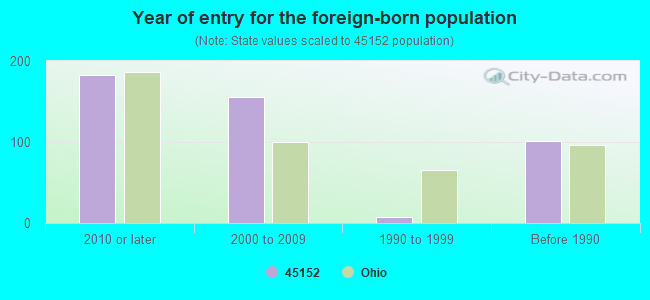
Year of entry for the foreign-born population
1832010 or later
1562000 to 2009
81990 to 1999
101Before 1990
Facilities with environmental interests located in this zip code:
BIGFOOT RUN I SANITARY LANDFILL (2420 E MASON-MORROW-MILLGROVE RD in MORROW, OH)
AIR MAJOR (AIRS/AFS) CRITERIA AND HAZARDOUS AIR POLLUTANT INVENTORY (Inventory of air pollution sources) STATE MASTER (Ohio general info) - AIR MAJOR, EPCRA, PCS-OH0127451, National Pollutant Discharge Elimination System Permit Conditionally Exempt Small Quantity Generators, less than 100 kg/month of hazardous waste (Resource Conservation and Recovery Act (tracking hazardous waste)) - notification Business SIC classification: REFUSE SYSTEMS Business NAICS classification: SOLID WASTE LANDFILL. Organizations: BROWNING-FERRIS INDUSTRIES OF (CONTACT/OWNER)
, BFI OF OHIO INC (CONTACT/OWNER)
Alternative names: BFI BIGFOOT RUN LANDFILL, BFI BIGFOOT RUN SANITARY LANDFILL, BIGFOOT RUN SANITARY LANDFILL, BROWNING FERRIS INDUSTRIES OF OHIO INC
ASHLAND BRANDED MKTING NO 416-000 (5119 E. US 23 in MORROW, OH)
STATE MASTER (Ohio general info) - RCRA-OH0000869735, HAZARDOUS WASTE PROGRAM, -83-5541-933-4, EPCRA Small Quantity Generators, between 100 kg and 1000 kg of hazardous waste/month (Resource Conservation and Recovery Act (tracking hazardous waste)) - notification Business SIC classification: PETROLEUM BULK STATIONS AND TERMINALS Organizations: BRANDED MKTG ASHLAND OIL INC (CONTACT/OWNER)
Alternative names: ASHLAND BRAND MARKETING NUMBER 416 000
ASHLAND BRANDED MKTING NO 416-004 (5087 SALEM RD in MORROW, OH)
STATE MASTER (Ohio general info) - RCRA-OHR000018127, HAZARDOUS WASTE PROGRAM Small Quantity Generators, between 100 kg and 1000 kg of hazardous waste/month (Resource Conservation and Recovery Act (tracking hazardous waste)) - notification Organizations: ASHLAND BRANDED MARKETING INC (CONTACT/OWNER)
, ASHLAND BRANDED MKTG (CONTACT/OWNER)
Housing units lacking complete plumbing facilities: 4.2% Housing units lacking complete kitchen facilities: 3.4%
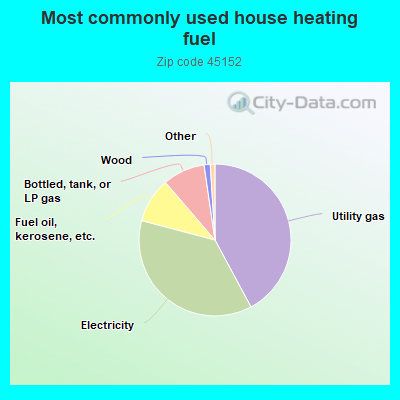
42.2%Utility gas
37.0%Electricity
9.6%Fuel oil, kerosene, etc.
9.0%Bottled, tank, or LP gas
1.3%Wood
Population in 1990: 5,498. Population change in the 1990s: +2,614 (+47.5%).
Place of birth for U.S.-born residents:
This state: 9,629
Northeast: 1,129
Midwest: 1,141
South: 999
West: 245
61% of the 45152 zip code residents lived in the same house 5 years ago. Out of people who lived in different houses, 53% lived in this county. Out of people who lived in different counties, 50% lived in Ohio.
85% of the 45152 zip code residents lived in the same house 1 year ago. Out of people who lived in different houses, 21% moved from this county. Out of people who lived in different houses, 76% moved from different county within same state. Out of people who lived in different houses, 5% moved from different state. Out of people who lived in different houses, 1% moved from abroad.
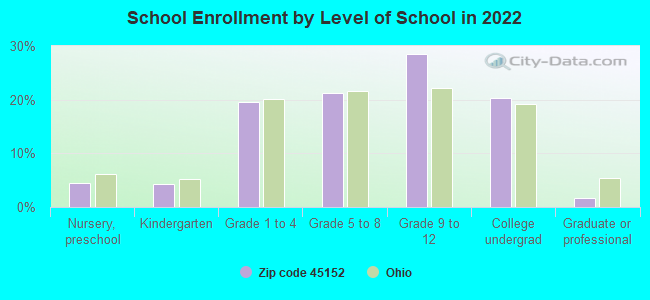
Private vs. public school enrollment:
Students in private schools in grades 1 to 8 (elementary and middle school): 396
Here:
28.8%
Ohio:
16.0%
Students in private schools in grades 9 to 12 (high school): 158
Here:
16.8%
Ohio:
13.1%
Students in private undergraduate colleges: 265
Here:
39.4%
Ohio:
22.3%
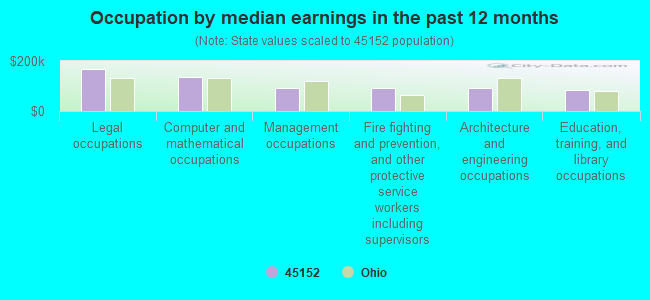
Occupation by median earnings in the past 12 months ($)
166,676Legal occupations
134,256Computer and mathematical occupations
93,453Management occupations
91,457Fire fighting and prevention, and other protective service workers including supervisors
90,990Architecture and engineering occupations
84,142Education, training, and library occupations
Companies with federal contracts located in this zip code:
NETWORK ESSENTIALS LLC (4637 MIDDLEBORO in MORROW, OH; small business)
$35,920 with Air Force for ADP Support Equipment. Taking place in CA. Signed on 2002-07-11. Completion date: 2002-08-12.
Top industries in this zip code by the number of employees in 2005:
Health Care and Social Assistance: Nursing Care Facilities (50-99 employees: 1 establishment)
Accommodation and Food Services: Limited-Service Restaurants (10-19: 2, 5-9: 1)
Construction: Commercial and Institutional Building Construction (20-49: 1, 1-4: 1)
Mining: Construction Sand and Gravel Mining (20-49: 1)
Administrative and Support and Waste Management and Remediation Services: Landscaping Services (10-19: 1, 1-4: 6)
People in group quarters in 2010:
39 people in nursing facilities/skilled-nursing facilities
People in group quarters in 2000:
62 people in nursing homes
37 people in other nonhousehold living situations
Fatal accident statistics in 2014:
Fatal accident count: 1
Vehicles involved in fatal accidents: 1
Fatal accidents caused by drunken drivers: 0
Fatalities: 1
Persons involved in fatal accidents: 2
Pedestrians involved in fatal accidents: 0
Fatal accident statistics in 2013:
Fatal accident count: 1
Vehicles involved in fatal accidents: 1
Fatal accidents caused by drunken drivers: 1
Fatalities: 1
Persons involved in fatal accidents: 1
Pedestrians involved in fatal accidents: 0
Home Mortgage Disclosure Act Aggregated Statistics For Year 2009 (Based on 8 partial tracts)
A) FHA, FSA/RHS & VA Home Purchase Loans
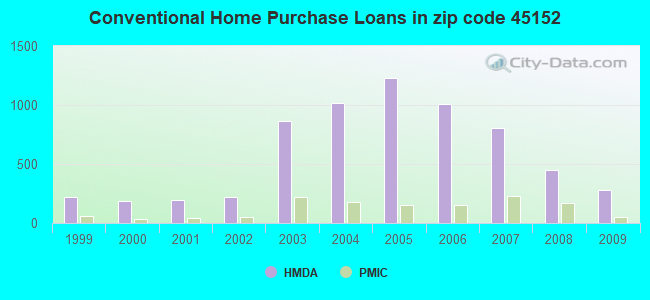
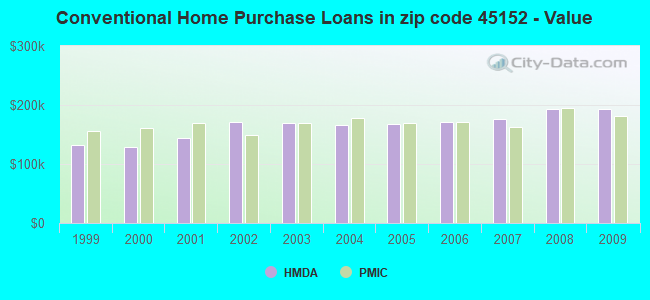
B) Conventional Home Purchase Loans
C) Refinancings
D) Home Improvement Loans
E) Loans on Dwellings For 5+ Families
F) Non-occupant Loans on < 5 Family Dwellings (A B C & D)
G) Loans On Manufactured Home Dwelling (A B C & D)
Number
Average Value
Number
Average Value
Number
Average Value
Number
Average Value
Number
Average Value
Number
Average Value
Number
Average Value
LOANS ORIGINATED
317
$156,863
279
$192,688
1,345
$188,975
25
$58,544
1
$1,811,450
49
$108,603
0
$0
APPLICATIONS APPROVED, NOT ACCEPTED
9
$152,490
13
$224,725
94
$200,608
6
$4,607
0
$0
2
$101,930
0
$0
APPLICATIONS DENIED
29
$135,152
22
$171,338
407
$200,614
23
$96,004
0
$0
9
$102,867
2
$51,780
APPLICATIONS WITHDRAWN
49
$150,289
39
$181,473
189
$184,274
6
$96,918
0
$0
4
$121,742
0
$0
FILES CLOSED FOR INCOMPLETENESS
2
$190,575
1
$358,870
60
$227,474
1
$133,590
0
$0
0
$0
0
$0
Aggregated Statistics For Year 2008 (Based on 8 partial tracts)
A) FHA, FSA/RHS & VA Home Purchase Loans
B) Conventional Home Purchase Loans
C) Refinancings
D) Home Improvement Loans
F) Non-occupant Loans on < 5 Family Dwellings (A B C & D)
G) Loans On Manufactured Home Dwelling (A B C & D)
Number
Average Value
Number
Average Value
Number
Average Value
Number
Average Value
Number
Average Value
Number
Average Value
LOANS ORIGINATED
206
$171,336
452
$192,522
601
$180,679
58
$46,998
65
$136,824
1
$35,590
APPLICATIONS APPROVED, NOT ACCEPTED
9
$174,558
28
$191,790
83
$181,102
17
$58,449
7
$132,769
2
$84,175
APPLICATIONS DENIED
32
$145,805
62
$222,250
330
$184,037
42
$65,388
15
$193,645
1
$24,270
APPLICATIONS WITHDRAWN
22
$167,288
50
$255,659
129
$200,575
3
$98,920
1
$74,680
0
$0
FILES CLOSED FOR INCOMPLETENESS
3
$222,333
6
$145,952
39
$195,098
2
$64,625
0
$0
0
$0
Aggregated Statistics For Year 2007 (Based on 8 partial tracts)
A) FHA, FSA/RHS & VA Home Purchase Loans
B) Conventional Home Purchase Loans
C) Refinancings
D) Home Improvement Loans
F) Non-occupant Loans on < 5 Family Dwellings (A B C & D)
G) Loans On Manufactured Home Dwelling (A B C & D)
Number
Average Value
Number
Average Value
Number
Average Value
Number
Average Value
Number
Average Value
Number
Average Value
LOANS ORIGINATED
89
$167,425
801
$175,925
651
$165,627
67
$46,128
80
$120,329
6
$84,822
APPLICATIONS APPROVED, NOT ACCEPTED
7
$160,379
104
$165,907
150
$156,131
19
$70,456
17
$115,155
2
$70,575
APPLICATIONS DENIED
18
$143,253
102
$143,436
456
$170,787
61
$56,959
31
$186,451
7
$26,691
APPLICATIONS WITHDRAWN
16
$165,052
71
$201,163
191
$168,020
8
$57,421
18
$148,590
1
$45,120
FILES CLOSED FOR INCOMPLETENESS
0
$0
9
$177,931
72
$178,471
1
$14,430
2
$182,380
0
$0
Aggregated Statistics For Year 2006 (Based on 8 partial tracts)
A) FHA, FSA/RHS & VA Home Purchase Loans
B) Conventional Home Purchase Loans
C) Refinancings
D) Home Improvement Loans
E) Loans on Dwellings For 5+ Families
F) Non-occupant Loans on < 5 Family Dwellings (A B C & D)
G) Loans On Manufactured Home Dwelling (A B C & D)
Number
Average Value
Number
Average Value
Number
Average Value
Number
Average Value
Number
Average Value
Number
Average Value
Number
Average Value
LOANS ORIGINATED
75
$175,188
1,010
$171,966
725
$157,742
82
$60,772
4
$204,742
99
$148,924
2
$52,660
APPLICATIONS APPROVED, NOT ACCEPTED
10
$189,459
136
$141,820
135
$140,768
13
$21,122
0
$0
26
$110,140
3
$49,987
APPLICATIONS DENIED
11
$131,758
173
$164,104
478
$157,647
62
$63,381
0
$0
51
$118,359
7
$52,911
APPLICATIONS WITHDRAWN
6
$189,838
107
$168,593
273
$157,853
14
$97,875
0
$0
18
$125,006
0
$0
FILES CLOSED FOR INCOMPLETENESS
0
$0
21
$130,613
93
$175,928
8
$153,356
0
$0
4
$91,955
1
$82,230
Aggregated Statistics For Year 2005 (Based on 8 partial tracts)
A) FHA, FSA/RHS & VA Home Purchase Loans
B) Conventional Home Purchase Loans
C) Refinancings
D) Home Improvement Loans
E) Loans on Dwellings For 5+ Families
F) Non-occupant Loans on < 5 Family Dwellings (A B C & D)
G) Loans On Manufactured Home Dwelling (A B C & D)
Number
Average Value
Number
Average Value
Number
Average Value
Number
Average Value
Number
Average Value
Number
Average Value
Number
Average Value
LOANS ORIGINATED
61
$165,418
1,233
$167,774
864
$170,883
92
$67,742
2
$112,190
105
$124,728
3
$35,123
APPLICATIONS APPROVED, NOT ACCEPTED
9
$116,958
144
$172,496
164
$131,095
19
$51,632
0
$0
18
$96,710
8
$23,764
APPLICATIONS DENIED
9
$128,473
192
$174,525
563
$150,031
81
$46,331
0
$0
22
$132,830
12
$59,666
APPLICATIONS WITHDRAWN
7
$137,021
100
$203,324
315
$166,051
28
$152,811
2
$158,935
15
$171,143
1
$82,830
FILES CLOSED FOR INCOMPLETENESS
4
$169,558
18
$181,059
78
$181,437
6
$33,573
0
$0
5
$100,740
0
$0
Aggregated Statistics For Year 2004 (Based on 8 partial tracts)
A) FHA, FSA/RHS & VA Home Purchase Loans
B) Conventional Home Purchase Loans
C) Refinancings
D) Home Improvement Loans
E) Loans on Dwellings For 5+ Families
F) Non-occupant Loans on < 5 Family Dwellings (A B C & D)
G) Loans On Manufactured Home Dwelling (A B C & D)
Number
Average Value
Number
Average Value
Number
Average Value
Number
Average Value
Number
Average Value
Number
Average Value
Number
Average Value
LOANS ORIGINATED
130
$149,492
1,015
$166,199
966
$157,714
85
$41,601
1
$132,240
79
$108,989
4
$81,435
APPLICATIONS APPROVED, NOT ACCEPTED
4
$161,655
77
$146,004
185
$148,712
15
$45,197
0
$0
15
$116,578
4
$47,415
APPLICATIONS DENIED
6
$140,535
133
$162,303
467
$145,475
83
$58,102
0
$0
30
$101,942
9
$46,023
APPLICATIONS WITHDRAWN
10
$173,255
86
$172,021
308
$137,196
23
$69,204
0
$0
3
$105,243
2
$76,660
FILES CLOSED FOR INCOMPLETENESS
3
$128,730
18
$132,577
64
$171,766
15
$35,067
0
$0
7
$86,624
0
$0
Aggregated Statistics For Year 2003 (Based on 8 partial tracts)
A) FHA, FSA/RHS & VA Home Purchase Loans
B) Conventional Home Purchase Loans
C) Refinancings
D) Home Improvement Loans
E) Loans on Dwellings For 5+ Families
F) Non-occupant Loans on < 5 Family Dwellings (A B C & D)
Number
Average Value
Number
Average Value
Number
Average Value
Number
Average Value
Number
Average Value
Number
Average Value
LOANS ORIGINATED
216
$144,441
862
$169,320
2,160
$155,342
49
$71,030
1
$954,220
78
$110,668
APPLICATIONS APPROVED, NOT ACCEPTED
4
$143,888
54
$157,729
269
$143,272
10
$43,623
0
$0
7
$99,801
APPLICATIONS DENIED
14
$123,936
80
$152,231
512
$143,227
43
$27,369
0
$0
19
$95,063
APPLICATIONS WITHDRAWN
7
$122,074
65
$185,951
324
$141,608
8
$44,090
0
$0
7
$110,059
FILES CLOSED FOR INCOMPLETENESS
5
$114,784
28
$140,914
112
$146,187
7
$95,999
0
$0
5
$105,074
Aggregated Statistics For Year 2002 (Based on 6 partial tracts)
A) FHA, FSA/RHS & VA Home Purchase Loans
B) Conventional Home Purchase Loans
C) Refinancings
D) Home Improvement Loans
E) Loans on Dwellings For 5+ Families
F) Non-occupant Loans on < 5 Family Dwellings (A B C & D)
Number
Average Value
Number
Average Value
Number
Average Value
Number
Average Value
Number
Average Value
Number
Average Value
LOANS ORIGINATED
52
$117,452
222
$171,108
828
$137,036
32
$30,869
2
$208,485
24
$82,888
APPLICATIONS APPROVED, NOT ACCEPTED
2
$70,655
25
$135,978
121
$113,355
9
$34,663
2
$99,100
5
$83,436
APPLICATIONS DENIED
7
$130,060
47
$98,365
221
$122,572
25
$13,938
0
$0
3
$50,693
APPLICATIONS WITHDRAWN
2
$77,890
35
$142,810
167
$137,078
7
$25,553
0
$0
3
$206,017
FILES CLOSED FOR INCOMPLETENESS
1
$46,160
10
$146,913
64
$204,130
3
$12,570
0
$0
0
$0
Aggregated Statistics For Year 2001 (Based on 6 partial tracts)
A) FHA, FSA/RHS & VA Home Purchase Loans
B) Conventional Home Purchase Loans
C) Refinancings
D) Home Improvement Loans
E) Loans on Dwellings For 5+ Families
F) Non-occupant Loans on < 5 Family Dwellings (A B C & D)
Number
Average Value
Number
Average Value
Number
Average Value
Number
Average Value
Number
Average Value
Number
Average Value
LOANS ORIGINATED
68
$111,506
198
$144,574
638
$124,990
48
$27,354
1
$166,470
42
$102,635
APPLICATIONS APPROVED, NOT ACCEPTED
1
$58,080
39
$113,085
111
$102,052
19
$44,705
0
$0
1
$46,160
APPLICATIONS DENIED
10
$105,712
41
$93,463
262
$118,548
40
$22,721
1
$241,840
8
$35,955
APPLICATIONS WITHDRAWN
1
$54,410
37
$152,042
123
$103,928
12
$25,563
0
$0
4
$215,215
FILES CLOSED FOR INCOMPLETENESS
2
$83,205
4
$148,962
29
$185,654
2
$48,040
0
$0
0
$0
Aggregated Statistics For Year 2000 (Based on 6 partial tracts)
A) FHA, FSA/RHS & VA Home Purchase Loans
B) Conventional Home Purchase Loans
C) Refinancings
D) Home Improvement Loans
E) Loans on Dwellings For 5+ Families
F) Non-occupant Loans on < 5 Family Dwellings (A B C & D)
Number
Average Value
Number
Average Value
Number
Average Value
Number
Average Value
Number
Average Value
Number
Average Value
LOANS ORIGINATED
28
$98,159
183
$129,457
216
$92,061
53
$25,493
1
$53,930
29
$104,132
APPLICATIONS APPROVED, NOT ACCEPTED
6
$87,465
37
$114,164
72
$88,705
31
$17,525
0
$0
5
$87,090
APPLICATIONS DENIED
2
$62,415
83
$101,724
168
$97,099
57
$12,342
1
$129,650
5
$57,810
APPLICATIONS WITHDRAWN
10
$103,381
16
$133,946
84
$81,397
10
$30,595
0
$0
3
$66,970
FILES CLOSED FOR INCOMPLETENESS
0
$0
2
$222,000
20
$83,734
0
$0
0
$0
0
$0
Aggregated Statistics For Year 1999 (Based on 4 partial tracts)
A) FHA, FSA/RHS & VA Home Purchase Loans
B) Conventional Home Purchase Loans
C) Refinancings
D) Home Improvement Loans
F) Non-occupant Loans on < 5 Family Dwellings (A B C & D)
2002 - 2018 National Fire Incident Reporting System (NFIRS) incidents
Based on the data from the years 2002 - 2018 the average number of fires per year is 53. The highest number of fire incidents - 72 took place in 2018, and the least - 33 in 2004. The data has a rising trend.
When looking into fire subcategories, the most reports belonged to: Structure Fires (57.2%), and Outside Fires (34.5%).
Fire incident types reported to NFIRS in Zip Code 45152


 Nearest zip codes: 45065, 45162, 45054, 45034, 45039, 45036.


 Based on the data from the years 2002 - 2018 the average number of fires per year is 53. The highest number of fire incidents - 72 took place in 2018, and the least - 33 in 2004. The data has a rising trend.
 When looking into fire subcategories, the most reports belonged to: Structure Fires (57.2%), and Outside Fires (34.5%).