Estimated zip code population in 2022: 2,130 Zip code population in 2010: 2,293 Zip code population in 2000: 2,395
Houses and condos: 937 Renter-occupied apartments: 219
% of renters here:
25%
State:
33%
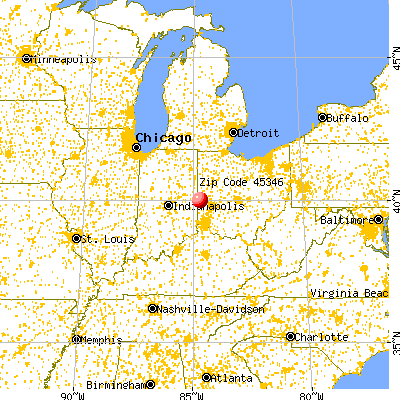
March 2022 cost of living index in zip code 45346: 82.9 (low, U.S. average is 100)
Land area: 42.0 sq. mi. Water area: 0.1 sq. mi.
Population density: 51 people per square mile
(very low).
OSM Map
General Map
Google Map
MSN Map
OSM Map
General Map
Google Map
MSN Map
OSM Map
General Map
Google Map
MSN Map
OSM Map
General Map
Google Map
MSN Map
Please wait while loading the map...
Real estate property taxes paid for housing units in 2022:
This zip code:
0.9% ($1,490)
Ohio:
1.3% ($2,639)
Median real estate property taxes paid for housing units with mortgages in 2022: $1,478 (0.9%) Median real estate property taxes paid for housing units with no mortgage in 2022: $1,544 (1.0%)
Business Search- 14 Million verified businesses
Males: 1,084
(50.9%)
Females: 1,046
(49.1%)
For population 25 years and over in 45346:
High school or higher: 88.5%
Bachelor's degree or higher: 16.3%
Graduate or professional degree: 3.7%
Unemployed: 0.9%
Mean travel time to work (commute): 27.7 minutes
For population 15 years and over in 45346:
Never married: 19.6%
Now married: 67.7%
Separated: 1.1%
Widowed: 5.8%
Divorced: 5.8%
Zip code 45346 compared to state average:
Unemployed percentage significantly below state average.
Black race population percentage significantly below state average.
Hispanic race population percentage significantly below state average.
Median age significantly above state average.
Foreign-born population percentage significantly below state average.
Length of stay since moving in significantly above state average.
Number of college students significantly below state average.
Percentage of population with a bachelor's degree or higher below state average.
Estimated median house/condo value in 2022: $168,914
45346:
$168,914
Ohio:
$204,100
According to our research of Ohio and other state lists, there were 4 registered sex offenders living in 45346 zip code as of May 28, 2024. The ratio of all residents to sex offenders in zip code 45346 is 553 to 1. The ratio of registered sex offenders to all residents in this zip code is near the state average.
Median resident age:
This zip code:
49.6 years
Ohio median age:
39.9 years
Average household size:
This zip code:
2.4 people
Ohio:
2.4 people
Averages for the 2020 tax year for zip code 45346, filed in 2021:
Average Adjusted Gross Income (AGI) in 2020: $52,613 (Individual Income Tax Returns)
Here:
$52,613
State:
$67,288
Salary/wage: $47,363 (reported on 80.4% of returns)
Here:
$47,363
State:
$55,628
(% of AGI for various income ranges: 1189.5% for AGIs below $25k, 3752.9% for AGIs $25k-50k, 6713.8% for AGIs $50k-75k, 9865.0% for AGIs $75k-100k, 16571.4% for AGIs $100k-200k)
Taxable interest for individuals: $1,130 (reported on 28.0% of returns)
This zip code:
$1,130
Ohio:
$1,518
(% of AGI for various income ranges: 34.1% for AGIs below $25k, 16.2% for AGIs $25k-50k, 30.6% for AGIs $50k-75k, 23.8% for AGIs $75k-100k, 231.4% for AGIs $100k-200k)
Ordinary dividends: $2,093 (reported on 13.1% of returns)
Here:
$2,093
State:
$7,167
(% of AGI for various income ranges: 17.3% for AGIs below $25k, 34.3% for AGIs $25k-50k, 56.9% for AGIs $50k-75k, 131.4% for AGIs $100k-200k)
Net capital gain/loss in AGI: +$6,033 (reported on 11.2% of returns)
Here:
+$6,033
State:
+$18,919
(% of AGI for various income ranges: 16.8% for AGIs below $25k, 136.9% for AGIs $50k-75k, 668.6% for AGIs $100k-200k)
Profit/loss from business: +$6,741 (reported on 15.9% of returns)
Here:
+$6,741
State:
+$13,744
(% of AGI for various income ranges: 57.3% for AGIs below $25k, 136.2% for AGIs $25k-50k, 279.4% for AGIs $50k-75k, 350.0% for AGIs $75k-100k, 10.0% for AGIs $100k-200k)
Taxable individual retirement arrangement distribution: $11,125 (reported on 7.5% of returns)
45346:
$11,125
Ohio:
$18,876
(% of AGI for various income ranges: 115.0% for AGIs below $25k, 398.1% for AGIs $50k-75k)
Earned income credit: $2,182 (reported on 15.9% of returns)
Here:
$2,182
State:
$2,304
(% of AGI for various income ranges: 86.4% for AGIs below $25k, 86.2% for AGIs $25k-50k)
Percentage of individuals using paid preparers for their 2020 taxes: 93.5%
Here:
93%
State:
94%
(% for various income ranges: 90.9% for AGIs below $25k, 100.0% for AGIs $25k-50k, 91.3% for AGIs $50k-75k, 91.7% for AGIs $75k-100k, 91.7% for AGIs $100k-200k)
Averages for the 2012 tax year for zip code 45346, filed in 2013:
Average Adjusted Gross Income (AGI) in 2012: $45,088 (Individual Income Tax Returns)
Here:
$45,088
State:
$54,926
Salary/wage: $37,475 (reported on 82.9% of returns)
Here:
$37,475
State:
$45,869
(% of AGI for various income ranges: 66.7% for AGIs below $25k, 81.0% for AGIs $25k-50k, 82.0% for AGIs $50k-75k, 76.6% for AGIs $75k-100k, 43.6% for AGIs $100k-200k)
Taxable interest for individuals: $980 (reported on 33.3% of returns)
This zip code:
$980
Ohio:
$1,297
(% of AGI for various income ranges: 2.0% for AGIs below $25k, 0.9% for AGIs $25k-50k, 0.5% for AGIs $50k-75k, 0.2% for AGIs $75k-100k, 0.6% for AGIs $100k-200k)
Ordinary dividends: $900 (reported on 14.3% of returns)
Here:
$900
State:
$5,821
(% of AGI for various income ranges: 1.1% for AGIs below $25k, 0.2% for AGIs $25k-50k, 0.3% for AGIs $50k-75k, 0.4% for AGIs $75k-100k)
Net capital gain/loss in AGI: +$5,973 (reported on 10.5% of returns)
Here:
+$5,973
State:
+$11,232
(% of AGI for various income ranges: 0.1% for AGIs $25k-50k, 9.1% for AGIs $75k-100k)
Profit/loss from business: +$6,531 (reported on 15.2% of returns)
Here:
+$6,531
State:
+$12,773
(% of AGI for various income ranges: 4.0% for AGIs below $25k, 2.8% for AGIs $25k-50k, 1.5% for AGIs $50k-75k, 4.8% for AGIs $75k-100k)
Taxable individual retirement arrangement distribution: $9,630 (reported on 9.5% of returns)
45346:
$9,630
Ohio:
$14,511
(% of AGI for various income ranges: 5.2% for AGIs below $25k, 1.0% for AGIs $25k-50k, 6.0% for AGIs $50k-75k)
Total itemized deductions: $16,257 (19% of AGI, reported on 20.0% of returns)
Here:
$16,257
State:
$21,278
Here:
19.0% of AGI
State:
18.8% of AGI
(% of AGI for various income ranges: 6.7% for AGIs $25k-50k, 6.7% for AGIs $50k-75k, 10.0% for AGIs $75k-100k, 9.3% for AGIs $100k-200k)
Charity contributions: $3,027 (reported on 14.3% of returns)
Here:
$3,027
State:
$3,943
(% of AGI for various income ranges: 0.4% for AGIs $25k-50k, 1.2% for AGIs $50k-75k, 0.9% for AGIs $75k-100k, 1.7% for AGIs $100k-200k)
Taxes paid: $6,138 (reported on 20.0% of returns)
45346:
$6,138
State:
$9,568
(% of AGI for various income ranges: 1.7% for AGIs $25k-50k, 2.4% for AGIs $50k-75k, 3.5% for AGIs $75k-100k, 4.6% for AGIs $100k-200k)
Earned income credit: $1,972 (reported on 17.1% of returns)
Here:
$1,972
State:
$2,285
(% of AGI for various income ranges: 4.5% for AGIs below $25k, 1.1% for AGIs $25k-50k)
Percentage of individuals using paid preparers for their 2012 taxes: 58.1%
Here:
58%
State:
51%
(% for various income ranges: 48.7% for AGIs below $25k, 61.8% for AGIs $25k-50k, 68.8% for AGIs $50k-75k, 55.6% for AGIs $75k-100k, 71.4% for AGIs $100k-200k)
Averages for the 2004 tax year for zip code 45346, filed in 2005:
Average Adjusted Gross Income (AGI) in 2004: $42,396 (Individual Income Tax Returns)
Here:
$42,396
State:
$44,480
Salary/wage: $37,520 (reported on 87.6% of returns)
Here:
$37,520
State:
$39,198
(% of AGI for various income ranges: 75.2% for AGIs $10k-25k, 83.7% for AGIs $25k-50k, 81.5% for AGIs $50k-75k, 82.7% for AGIs $75k-100k, 48.4% for AGIs over 100k)
Taxable interest for individuals: $1,355 (reported on 48.4% of returns)
This zip code:
$1,355
Ohio:
$1,532
(% of AGI for various income ranges: 3.9% for AGIs $10k-25k, 1.9% for AGIs $25k-50k, 0.5% for AGIs $50k-75k, 0.5% for AGIs $75k-100k, 1.4% for AGIs over 100k)
Taxable dividends: $638 (reported on 19.4% of returns)
Here:
$638
State:
$3,496
(% of AGI for various income ranges: 0.6% for AGIs $10k-25k, 0.4% for AGIs $25k-50k, 0.1% for AGIs $50k-75k, 0.2% for AGIs $75k-100k, 0.1% for AGIs over 100k)
Net capital gain/loss: +$2,750 (reported on 15.2% of returns)
Here:
+$2,750
State:
+$8,582
(% of AGI for various income ranges: 0.6% for AGIs $10k-25k, 0.4% for AGIs $25k-50k, 1.1% for AGIs $50k-75k, 0.1% for AGIs $75k-100k, 3.9% for AGIs over 100k)
Profit/loss from business: +$9,817 (reported on 15.8% of returns)
Here:
+$9,817
State:
+$10,813
(% of AGI for various income ranges: 2.9% for AGIs $10k-25k, 3.2% for AGIs $25k-50k, 3.9% for AGIs $50k-75k, 8.0% for AGIs $75k-100k)
Total itemized deductions: $13,120 (22% of AGI, reported on 29.8% of returns)
Here:
$13,120
State:
$17,503
Here:
21.6% of AGI
State:
20.8% of AGI
(% of AGI for various income ranges: 9.0% for AGIs $10k-25k, 7.4% for AGIs $25k-50k, 9.9% for AGIs $50k-75k, 12.2% for AGIs $75k-100k, 9.5% for AGIs over 100k)
Charity contributions deductions: $2,203 (4% of AGI, reported on 19.7% of returns)
Here:
$2,203
State:
$3,087
Here:
3.6% of AGI
State:
3.4% of AGI
(% of AGI for various income ranges: 0.7% for AGIs $10k-25k, 0.7% for AGIs $25k-50k, 1.1% for AGIs $50k-75k, 2.0% for AGIs $75k-100k, 1.0% for AGIs over 100k)
Total tax: $4,073 (reported on 87.0% of returns)
45346:
$4,073
State:
$6,781
(% of AGI for various income ranges: 4.0% for AGIs $10k-25k, 6.8% for AGIs $25k-50k, 9.2% for AGIs $50k-75k, 11.1% for AGIs $75k-100k, 12.2% for AGIs over 100k)
Earned income credit: $1,823 (reported on 8.8% of returns)
Here:
$1,823
State:
$1,696
Percentage of individuals using paid preparers for their 2004 taxes: 62.4%
Here:
62%
State:
55%
(% for various income ranges: 59.9% for AGIs $10k-25k, 65.8% for AGIs $25k-50k, 63.3% for AGIs $50k-75k, 52.2% for AGIs $75k-100k, 64.3% for AGIs over 100k)
Household received Food Stamps/SNAP in the past 12 months: 24 Household did not receive Food Stamps/SNAP in the past 12 months: 864
Women who had a birth in the past 12 months: 7 (2 now married, 5 unmarried) Women who did not have a birth in the past 12 months: 408 (237 now married, 170 unmarried)
Housing units in zip code 45346 with a mortgage: 397 (28 second mortgage, 15 both second mortgage and home equity loan) Houses without a mortgage: 3
Median monthly owner costs for units with a mortgage: $1,035 Median monthly owner costs for units without a mortgage: $484
Residents with income below the poverty level in 2022:
This zip code:
7.3%
Whole state:
13.4%
Residents with income below 50% of the poverty level in 2022:
This zip code:
3.3%
Whole state:
7.0%
Median number of rooms in houses and condos:
Here:
6.2
State:
6.7
Median number of rooms in apartments:
Here:
6.0
State:
4.4
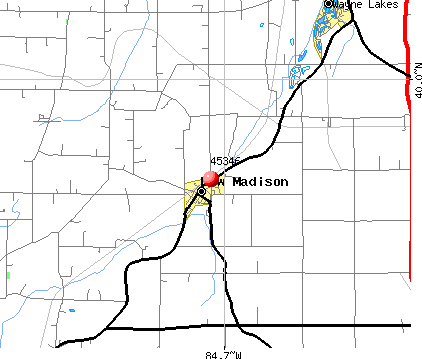
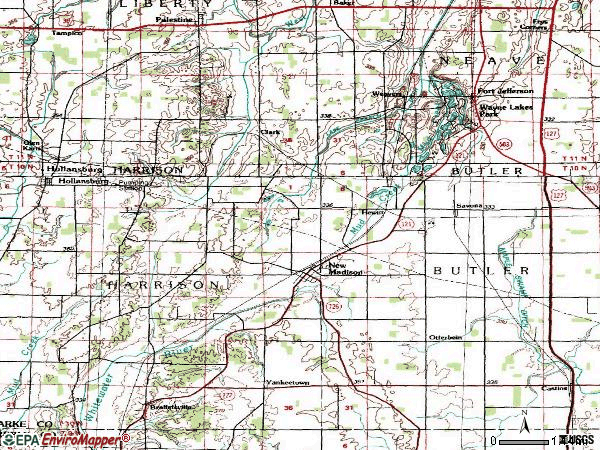
Notable locations in this zip code not listed on our city pages
Size of family households: 414 2-persons, 115 3-persons, 119 4-persons, 25 5-persons, 18 6-persons, 3 7-or-more-persons
Size of nonfamily households: 170 1-person, 22 2-persons
389 married couples with children.
109 single-parent households (30 men, 79 women).
94.7% of residents of 45346 zip code speak English at home.
0.2% of residents speak Spanish at home (25% very well, 75% well).
0.4% of residents speak other Indo-European language at home (89% very well, 11% well).
1.7% of residents speak Asian or Pacific Island language at home (21% very well, 79% well).
1.9% of residents speak other language at home (100% well).
Foreign born population: 42 (2.0%) (92.8% of them are naturalized citizens)
This zip code:
2.0%
Whole state:
5.0%
80%Malaysia
7%Barbados
30%American
25%English
15%German
9%European
3%Irish
2%Scottish
2%Swiss
Year of entry for the foreign-born population
472010 or later
02000 to 2009
01990 to 1999
2Before 1990
Housing units lacking complete plumbing facilities: 0.6% Housing units lacking complete kitchen facilities: 0.9%
38.1%Utility gas
30.6%Bottled, tank, or LP gas
23.4%Electricity
4.5%Wood
1.6%Fuel oil, kerosene, etc.
1.4%No fuel used
0.8%Other fuel
Population in 1990: 2,519.
Place of birth for U.S.-born residents:
This state: 1,729
Northeast: 17
Midwest: 255
South: 63
West: 16
71% of the 45346 zip code residents lived in the same house 5 years ago. Out of people who lived in different houses, 76% lived in this county. Out of people who lived in different counties, 50% lived in Ohio.
95% of the 45346 zip code residents lived in the same house 1 year ago. Out of people who lived in different houses, 51% moved from this county. Out of people who lived in different houses, 50% moved from different county within same state. Out of people who lived in different houses, 4% moved from different state. Out of people who lived in different houses, 1% moved from abroad.
Private vs. public school enrollment:
Students in private schools in grades 1 to 8 (elementary and middle school): 30
Here:
12.0%
Ohio:
16.0%
Students in private schools in grades 9 to 12 (high school): 51
Here:
41.4%
Ohio:
13.1%
Students in private undergraduate colleges:
Here:
5.5%
Ohio:
22.3%
Occupation by median earnings in the past 12 months ($)
145,323Architecture and engineering occupations
89,242Installation, maintenance, and repair occupations
77,916Business and financial operations occupations
76,735Computer and mathematical occupations
69,844Construction and extraction occupations
69,682Health diagnosing and treating practitioners and other technical occupations
Top industries in this zip code by the number of employees in 2005:
Health Care and Social Assistance: Ambulance Services (20-49 employees: 1 establishment)
Construction: Site Preparation Contractors (10-19: 1, 5-9: 1, 1-4: 1)
Finance and Insurance: Commercial Banking (10-19: 1)
Wholesale Trade: Farm and Garden Machinery and Equipment Merchant Wholesalers (10-19: 1)
Fatal accident statistics in 2013:
Fatal accident count: 1
Vehicles involved in fatal accidents: 1
Fatal accidents caused by drunken drivers: 0
Fatalities: 1
Persons involved in fatal accidents: 1
Pedestrians involved in fatal accidents: 0
Fatal accident statistics in 2011:
Fatal accident count: 1
Vehicles involved in fatal accidents: 2
Fatal accidents caused by drunken drivers: 0
Fatalities: 2
Persons involved in fatal accidents: 3
Pedestrians involved in fatal accidents: 0
2002 - 2018 National Fire Incident Reporting System (NFIRS) incidents
According to the data from the years 2002 - 2018 the average number of fire incidents per year is 30. The highest number of reported fires - 46 took place in 2008, and the least - 20 in 2017. The data has an increasing trend.
When looking into fire subcategories, the most reports belonged to: Structure Fires (68.7%), and Outside Fires (21.1%).
Fire incident types reported to NFIRS in Zip Code 45346


 Nearest zip codes: 45352, 45332, 45321, 45347, 45382, 45331.


 According to the data from the years 2002 - 2018 the average number of fire incidents per year is 30. The highest number of reported fires - 46 took place in 2008, and the least - 20 in 2017. The data has an increasing trend.
 When looking into fire subcategories, the most reports belonged to: Structure Fires (68.7%), and Outside Fires (21.1%).