Estimated zip code population in 2022: 2,147 Zip code population in 2010: 2,001 Zip code population in 2000: 567
Houses and condos: 336 Renter-occupied apartments: 44
% of renters here:
18%
State:
33%
March 2022 cost of living index in zip code 45384: 81.4 (low, U.S. average is 100)
Land area: 1.3 sq. mi. Water area: 0.0 sq. mi.
Population density: 1,650 people per square mile
(low).
OSM Map
General Map
Google Map
MSN Map
OSM Map
General Map
Google Map
MSN Map
OSM Map
General Map
Google Map
MSN Map
OSM Map
General Map
Google Map
MSN Map
Please wait while loading the map...
Real estate property taxes paid for housing units in 2022:
This zip code:
1.5% ($3,604)
Ohio:
1.3% ($2,639)
Median real estate property taxes paid for housing units with mortgages in 2022: $4,710 (1.9%) Median real estate property taxes paid for housing units with no mortgage in 2022: $3,140 (1.4%)
Business Search- 14 Million verified businesses
Males: 900
(41.9%)
Females: 1,247
(58.1%)
For population 25 years and over in 45384:
High school or higher: 97.6%
Bachelor's degree or higher: 68.5%
Graduate or professional degree: 32.0%
Unemployed: 9.7%
Mean travel time to work (commute): 17.9 minutes
For population 15 years and over in 45384:
Never married: 82.8%
Now married: 9.6%
Separated: 0.8%
Widowed: 3.2%
Divorced: 3.7%
Zip code 45384 compared to state average:
Unemployed percentage above state average.
Black race population percentage significantly above state average.
Median age significantly below state average.
Renting percentage below state average.
Length of stay since moving in significantly above state average.
Number of college students significantly above state average.
Percentage of population with a bachelor's degree or higher below state average.
Estimated median house/condo value in 2022: $234,721
45384:
$234,721
Ohio:
$204,100
Median resident age:
This zip code:
20.4 years
Ohio median age:
39.9 years
Average household size:
This zip code:
2.6 people
Ohio:
2.4 people
Averages for the 2004 tax year for zip code 45384, filed in 2005:
Average Adjusted Gross Income (AGI) in 2004: $33,641 (Individual Income Tax Returns)
Here:
$33,641
State:
$44,480
Salary/wage: $27,641 (reported on 79.8% of returns)
Here:
$27,641
State:
$39,198
(% of AGI for various income ranges: 109.0% for AGIs below $10k, 64.5% for AGIs $10k-25k, 64.6% for AGIs $25k-50k, 60.5% for AGIs $50k-75k, 65.7% for AGIs $75k-100k)
Taxable interest for individuals: $732 (reported on 28.6% of returns)
This zip code:
$732
Ohio:
$1,532
(% of AGI for various income ranges: 0.1% for AGIs $10k-25k, 0.5% for AGIs $25k-50k, 1.1% for AGIs $50k-75k, 0.5% for AGIs $75k-100k)
Taxable dividends: $452 (reported on 12.5% of returns)
Here:
$452
State:
$3,496
Net capital gain/loss: +$312 (reported on 6.5% of returns)
Here:
+$312
State:
+$8,582
Profit/loss from business: +$1,100 (reported on 8.1% of returns)
Here:
+$1,100
State:
+$10,813
Total itemized deductions: $15,412 (23% of AGI, reported on 27.4% of returns)
Here:
$15,412
State:
$17,503
Here:
23.1% of AGI
State:
20.8% of AGI
Charity contributions deductions: $2,412 (4% of AGI, reported on 20.6% of returns)
Here:
$2,412
State:
$3,087
Here:
3.6% of AGI
State:
3.4% of AGI
Total tax: $5,138 (reported on 64.1% of returns)
45384:
$5,138
State:
$6,781
(% of AGI for various income ranges: 1.1% for AGIs below $10k, 3.7% for AGIs $10k-25k, 8.5% for AGIs $25k-50k, 9.7% for AGIs $50k-75k, 14.3% for AGIs $75k-100k)
Earned income credit: $1,425 (reported on 16.1% of returns)
Here:
$1,425
State:
$1,696
Percentage of individuals using paid preparers for their 2004 taxes: 54.0%
Here:
54%
State:
55%
(% for various income ranges: 50.0% for AGIs below $10k, 59.5% for AGIs $10k-25k, 65.1% for AGIs $25k-50k, 67.5% for AGIs $50k-75k)
Household received Food Stamps/SNAP in the past 12 months: 34 Household did not receive Food Stamps/SNAP in the past 12 months: 213
Women who did not have a birth in the past 12 months: 1,035 (58 now married, 978 unmarried)
Housing units in zip code 45384 with a mortgage: 140 (23 second mortgage, 23 both second mortgage and home equity loan) Median monthly owner costs for units with a mortgage: $1,352 Median monthly owner costs for units without a mortgage: $714
Residents with income below the poverty level in 2022:
This zip code:
8.7%
Whole state:
13.4%
Median number of rooms in houses and condos:
Here:
7.7
State:
6.7
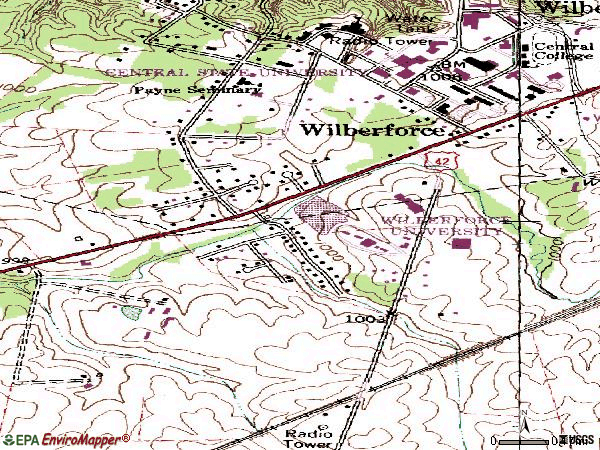
Notable locations in this zip code not listed on our city pages
Notable locations in zip code 45384: William Patrick McPherson Memorial Stadium (A), Central State University Emergency Medical Services (B), Shorter Hall (C), Robert A Pinn Hall (D), O'Neill Hall (E), Mitchell Hall (F), Jenkins Hall (G), Hallie Q Brown Library (H), Emery Hall (I), Carnegie Library (J), Bundy Hall (K), Benjamin Banneker Science Hall (L), Arnett Hall (M). Display/hide their locations on the map
In group quarters: 1,463 (-1 institutionalized population)
Size of family households: 62 2-persons, 66 3-persons, 13 4-persons, 12 7-or-more-persons
Size of nonfamily households: 68 1-person, 24 2-persons
117 married couples with children.
39 single-parent households (39 women).
96.7% of residents of 45384 zip code speak English at home.
1.4% of residents speak Spanish at home (100% very well).
0.7% of residents speak Asian or Pacific Island language at home (14% very well, 86% well).
Foreign born population: 151 (7.1%) (17.0% of them are naturalized citizens)
This zip code:
7.1%
Whole state:
5.0%
11%Belarus
6%Bhutan
5%Colombia
9%Bahamian
8%German
6%Polish
4%Irish
4%African
2%American
2%English
Year of entry for the foreign-born population
1732010 or later
52000 to 2009
01990 to 1999
17Before 1990
Facilities with environmental interests located in this zip code:
CENTRAL STATE UNIVERSITY WTP (1400 BRUSH ROW RD in WILBERFORCE, OH)
AIR MINOR (AIRS/AFS) STATE MASTER (Ohio general info) - AIR MAJOR STATE MASTER (Ohio general info) - PCS-OH0007951, National Pollutant Discharge Elimination System Permit, RCRA-OHD008873747, HAZARDOUS WASTE PROGRAM, SDWIS-2901912, DRINKING WATER PROGRAM National Pollutant Discharge Elimination System NON-MAJOR (Tracking pollutant discharge elimination systems) - permit AIR MAJOR ("Best Available" air pollution technologies tracking) Conditionally Exempt Small Quantity Generators, less than 100 kg/month of hazardous waste (Resource Conservation and Recovery Act (tracking hazardous waste)) COMMUNITY WATER SYSTEM (SDWIS) - SDWIS-OH2901912 1, WATER TREATMENT PLANT Business SIC classification: FABRICATED PLATE WORK (BOILER SHOPS); WATER SUPPLY
CENTRAL STATE UNIVERSITY (STATE RT 42 in WILBERFORCE, OH)
(Integrated Compliance Information System) - ICIS-05-1998-0035, FORMAL ENFORCEMENT ACTION Business SIC classification: COLLEGES, UNIVERSITIES, AND PROFESSIONAL SCHOOLS
CENTRAL STATE UNIV (201 ADMINISTRATION BLDG in WILBERFORCE, OH)
COMPLIANCE ACTIVITY (Tracking inspections of insecticide, fungicide, and rodenticide, and toxic substances)
46.4%Utility gas
22.4%Electricity
12.4%Bottled, tank, or LP gas
12.0%No fuel used
7.5%Fuel oil, kerosene, etc.
Place of birth for U.S.-born residents:
This state: 1,080
Northeast: 109
Midwest: 502
South: 230
West: 44
28% of the 45384 zip code residents lived in the same house 5 years ago. Out of people who lived in different houses, 15% lived in this county. Out of people who lived in different counties, 50% lived in Ohio.
93% of the 45384 zip code residents lived in the same house 1 year ago. Out of people who lived in different houses, 67% moved from this county. Out of people who lived in different houses, 33% moved from different county within same state.
Private vs. public school enrollment:
Students in private schools in grades 1 to 8 (elementary and middle school):
Here:
0.0%
Ohio:
16.0%
Students in private schools in grades 9 to 12 (high school):
Here:
0.0%
Ohio:
13.1%
Students in private undergraduate colleges: 295
Here:
21.6%
Ohio:
22.3%
Occupation by median earnings in the past 12 months ($)
45,375Production occupations
36,747Material moving occupations
34,954Business and financial operations occupations
11,875Education, training, and library occupations
11,702Personal care and service occupations
9,810Building and grounds cleaning and maintenance occupations
Companies with federal contracts located in this zip code:
THE OHIO HISTORICAL SOCIETY (1350 BRUSH ROW RD in WILBERFORCE, OH; small business)
$44,000 with Department of State for Other Professional Services. Signed on 2001-09-15. Completion date: 2002-05-15.
Top industries in this zip code by the number of employees in 2005:
Educational Services: Colleges, Universities, and Professional Schools (100-249 employees: 1 establishment)
Accommodation and Food Services: Food Service Contractors (50-99: 2)
Other Services (except Public Administration): Religious Organizations (10-19: 1)
Arts, Entertainment, and Recreation: Museums (10-19: 1)
Health Care and Social Assistance: Offices of All Other Miscellaneous Health Practitioners (1-4: 1)
Professional, Scientific, and Technical Services: Testing Laboratories (1-4: 1)
Professional, Scientific, and Technical Services: Title Abstract and Settlement Offices (1-4: 1)
Real Estate and Rental and Leasing: Lessors of Residential Buildings and Dwellings (1-4: 1)
Other Services (except Public Administration): Business Associations (1-4: 1)
People in group quarters in 2010:
1,665 people in college/university student housing
People in group quarters in 2000:
320 people in college dormitories (includes college quarters off campus)
5 people in other nonhousehold living situations
Home Mortgage Disclosure Act Aggregated Statistics For Year 2009 (Based on 2 partial tracts)
B) Conventional Home Purchase Loans
C) Refinancings
Number
Average Value
Number
Average Value
LOANS ORIGINATED
1
$58,880
4
$137,682
APPLICATIONS APPROVED, NOT ACCEPTED
0
$0
0
$0
APPLICATIONS DENIED
0
$0
2
$153,685
APPLICATIONS WITHDRAWN
0
$0
1
$89,140
FILES CLOSED FOR INCOMPLETENESS
0
$0
0
$0
Aggregated Statistics For Year 2008 (Based on 2 partial tracts)
A) FHA, FSA/RHS & VA Home Purchase Loans
B) Conventional Home Purchase Loans
C) Refinancings
F) Non-occupant Loans on < 5 Family Dwellings (A B C & D)
Number
Average Value
Number
Average Value
Number
Average Value
Number
Average Value
LOANS ORIGINATED
1
$74,690
1
$238,450
2
$145,320
1
$37,660
APPLICATIONS APPROVED, NOT ACCEPTED
0
$0
0
$0
0
$0
0
$0
APPLICATIONS DENIED
0
$0
0
$0
2
$138,485
0
$0
APPLICATIONS WITHDRAWN
0
$0
0
$0
1
$141,190
0
$0
FILES CLOSED FOR INCOMPLETENESS
0
$0
0
$0
0
$0
0
$0
Aggregated Statistics For Year 2007 (Based on 2 partial tracts)
B) Conventional Home Purchase Loans
C) Refinancings
D) Home Improvement Loans
F) Non-occupant Loans on < 5 Family Dwellings (A B C & D)
Number
Average Value
Number
Average Value
Number
Average Value
Number
Average Value
LOANS ORIGINATED
2
$122,355
3
$118,547
1
$41,220
1
$62,940
APPLICATIONS APPROVED, NOT ACCEPTED
1
$106,940
1
$110,570
0
$0
0
$0
APPLICATIONS DENIED
1
$96,400
3
$112,020
1
$46,640
1
$85,230
APPLICATIONS WITHDRAWN
0
$0
1
$114,920
0
$0
0
$0
FILES CLOSED FOR INCOMPLETENESS
0
$0
0
$0
0
$0
0
$0
Aggregated Statistics For Year 2006 (Based on 2 partial tracts)
B) Conventional Home Purchase Loans
C) Refinancings
D) Home Improvement Loans
F) Non-occupant Loans on < 5 Family Dwellings (A B C & D)
Number
Average Value
Number
Average Value
Number
Average Value
Number
Average Value
LOANS ORIGINATED
3
$173,610
5
$85,042
1
$46,710
2
$43,220
APPLICATIONS APPROVED, NOT ACCEPTED
1
$91,850
2
$90,565
0
$0
0
$0
APPLICATIONS DENIED
1
$114,280
6
$95,835
1
$50,910
1
$86,290
APPLICATIONS WITHDRAWN
0
$0
2
$110,680
1
$28,480
0
$0
FILES CLOSED FOR INCOMPLETENESS
0
$0
1
$67,000
0
$0
0
$0
Aggregated Statistics For Year 2005 (Based on 2 partial tracts)
B) Conventional Home Purchase Loans
C) Refinancings
D) Home Improvement Loans
F) Non-occupant Loans on < 5 Family Dwellings (A B C & D)
Number
Average Value
Number
Average Value
Number
Average Value
Number
Average Value
LOANS ORIGINATED
6
$123,852
6
$103,347
1
$53,260
3
$59,380
APPLICATIONS APPROVED, NOT ACCEPTED
1
$113,920
1
$123,460
0
$0
0
$0
APPLICATIONS DENIED
1
$63,440
6
$83,363
1
$52,260
1
$72,480
APPLICATIONS WITHDRAWN
1
$58,950
2
$115,915
0
$0
0
$0
FILES CLOSED FOR INCOMPLETENESS
0
$0
0
$0
0
$0
0
$0
Aggregated Statistics For Year 2004 (Based on 2 partial tracts)
B) Conventional Home Purchase Loans
C) Refinancings
D) Home Improvement Loans
F) Non-occupant Loans on < 5 Family Dwellings (A B C & D)
Number
Average Value
Number
Average Value
Number
Average Value
Number
Average Value
LOANS ORIGINATED
4
$107,958
6
$96,167
1
$36,950
2
$59,130
APPLICATIONS APPROVED, NOT ACCEPTED
1
$133,860
1
$78,390
0
$0
0
$0
APPLICATIONS DENIED
1
$131,930
4
$111,588
1
$31,110
1
$45,280
APPLICATIONS WITHDRAWN
1
$119,900
3
$107,060
0
$0
1
$43,790
FILES CLOSED FOR INCOMPLETENESS
0
$0
1
$89,070
0
$0
0
$0
Aggregated Statistics For Year 2003 (Based on 2 partial tracts)
B) Conventional Home Purchase Loans
C) Refinancings
D) Home Improvement Loans
F) Non-occupant Loans on < 5 Family Dwellings (A B C & D)
Number
Average Value
Number
Average Value
Number
Average Value
Number
Average Value
LOANS ORIGINATED
3
$149,020
10
$115,714
1
$24,780
2
$50,020
APPLICATIONS APPROVED, NOT ACCEPTED
0
$0
2
$96,475
0
$0
0
$0
APPLICATIONS DENIED
1
$62,940
6
$85,417
1
$22,500
1
$21,000
APPLICATIONS WITHDRAWN
0
$0
3
$88,337
0
$0
0
$0
FILES CLOSED FOR INCOMPLETENESS
0
$0
1
$104,880
0
$0
0
$0
Aggregated Statistics For Year 2002 (Based on 2 partial tracts)
B) Conventional Home Purchase Loans
C) Refinancings
D) Home Improvement Loans
F) Non-occupant Loans on < 5 Family Dwellings (A B C & D)
Number
Average Value
Number
Average Value
Number
Average Value
Number
Average Value
LOANS ORIGINATED
3
$103,713
8
$98,825
2
$14,775
2
$36,845
APPLICATIONS APPROVED, NOT ACCEPTED
0
$0
2
$64,615
0
$0
0
$0
APPLICATIONS DENIED
1
$39,160
6
$75,353
1
$12,390
1
$52,970
APPLICATIONS WITHDRAWN
0
$0
2
$104,345
0
$0
0
$0
FILES CLOSED FOR INCOMPLETENESS
0
$0
1
$92,200
0
$0
0
$0
Aggregated Statistics For Year 2001 (Based on 2 partial tracts)
A) FHA, FSA/RHS & VA Home Purchase Loans
B) Conventional Home Purchase Loans
C) Refinancings
D) Home Improvement Loans
F) Non-occupant Loans on < 5 Family Dwellings (A B C & D)
Number
Average Value
Number
Average Value
Number
Average Value
Number
Average Value
Number
Average Value
LOANS ORIGINATED
1
$69,920
2
$96,300
9
$92,916
1
$24,780
2
$52,935
APPLICATIONS APPROVED, NOT ACCEPTED
0
$0
0
$0
2
$112,140
0
$0
0
$0
APPLICATIONS DENIED
0
$0
1
$73,760
6
$75,140
2
$15,985
1
$55,820
APPLICATIONS WITHDRAWN
0
$0
0
$0
3
$78,343
0
$0
0
$0
FILES CLOSED FOR INCOMPLETENESS
0
$0
0
$0
1
$69,280
0
$0
0
$0
Aggregated Statistics For Year 2000 (Based on 2 partial tracts)
A) FHA, FSA/RHS & VA Home Purchase Loans
B) Conventional Home Purchase Loans
C) Refinancings
D) Home Improvement Loans
F) Non-occupant Loans on < 5 Family Dwellings (A B C & D)
Number
Average Value
Number
Average Value
Number
Average Value
Number
Average Value
Number
Average Value
LOANS ORIGINATED
1
$48,840
3
$125,907
5
$77,010
1
$10,680
1
$66,570
APPLICATIONS APPROVED, NOT ACCEPTED
0
$0
0
$0
2
$77,395
0
$0
0
$0
APPLICATIONS DENIED
0
$0
2
$56,355
5
$70,560
2
$15,595
0
$0
APPLICATIONS WITHDRAWN
0
$0
0
$0
3
$59,667
0
$0
0
$0
FILES CLOSED FOR INCOMPLETENESS
0
$0
0
$0
0
$0
0
$0
0
$0
Aggregated Statistics For Year 1999 (Based on 1 partial tract)
B) Conventional Home Purchase Loans
C) Refinancings
D) Home Improvement Loans
F) Non-occupant Loans on < 5 Family Dwellings (A B C & D)


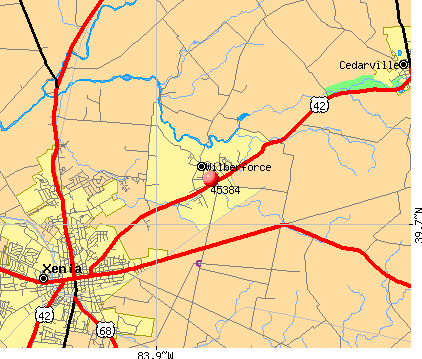 Nearest zip codes: 45385, 45387, 45316, 45314, 45301, 45323.