Estimated zip code population in 2022: 1,311 Zip code population in 2010: 1,507 Zip code population in 2000: 1,611
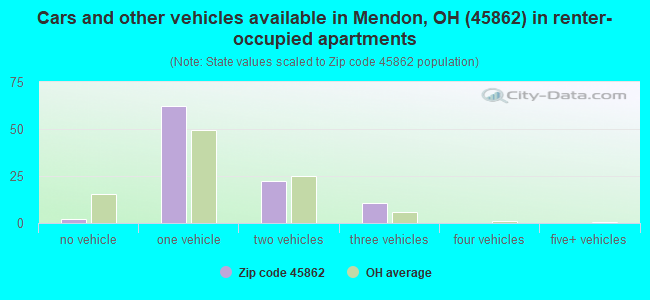
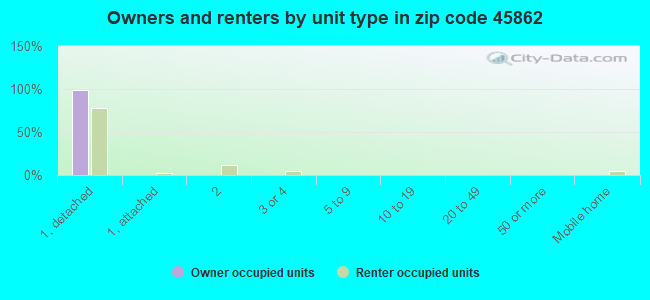
Houses and condos: 633 Renter-occupied apartments: 96
% of renters here:
15%
State:
33%
March 2022 cost of living index in zip code 45862: 82.9 (low, U.S. average is 100)
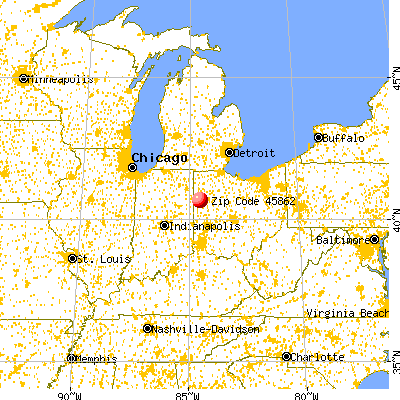
Land area: 36.7 sq. mi. Water area: 0.1 sq. mi.
Population density: 36 people per square mile
(very low).
OSM Map
General Map
Google Map
MSN Map
OSM Map
General Map
Google Map
MSN Map
OSM Map
General Map
Google Map
MSN Map
OSM Map
General Map
Google Map
MSN Map
Please wait while loading the map...
Real estate property taxes paid for housing units in 2022:
This zip code:
1.1% ($1,475)
Ohio:
1.3% ($2,639)
Median real estate property taxes paid for housing units with mortgages in 2022: $1,634 (0.8%) Median real estate property taxes paid for housing units with no mortgage in 2022: $1,437 (1.3%)
Business Search- 14 Million verified businesses
Males: 615
(46.9%)
Females: 696
(53.1%)
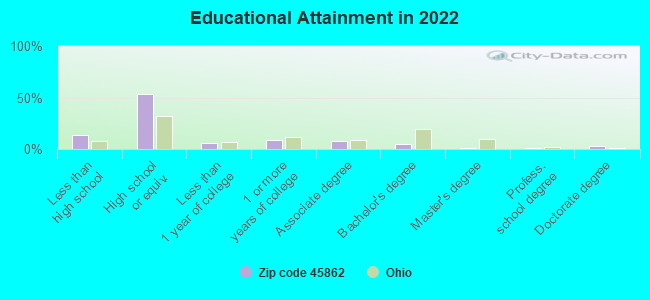
For population 25 years and over in 45862:
High school or higher: 85.2%
Bachelor's degree or higher: 10.2%
Graduate or professional degree: 5.0%
Unemployed: 7.7%
Mean travel time to work (commute): 24.5 minutes
For population 15 years and over in 45862:
Never married: 21.6%
Now married: 44.8%
Separated: 0.7%
Widowed: 19.6%
Divorced: 13.3%
Zip code 45862 compared to state average:
Median household income below state average.
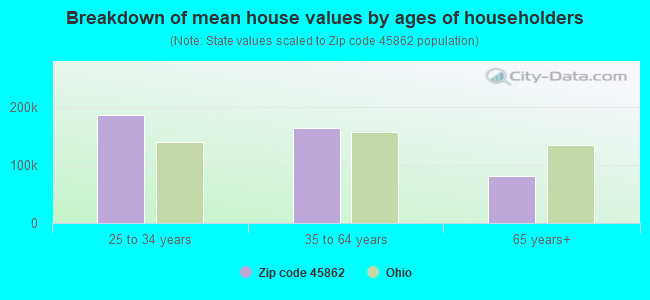
Median house value below state average.
Unemployed percentage above state average.
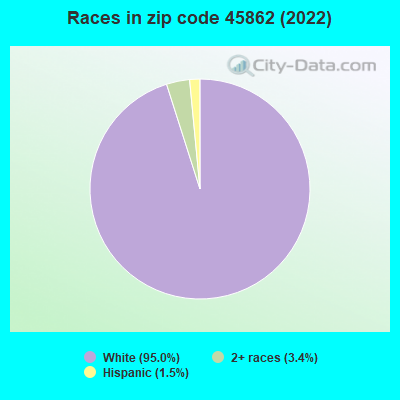
Black race population percentage significantly below state average.
Hispanic race population percentage below state average.
Median age significantly above state average.
Renting percentage below state average.
Length of stay since moving in significantly above state average.
Number of college students significantly below state average.
Percentage of population with a bachelor's degree or higher significantly below state average.
Averages for the 2020 tax year for zip code 45862, filed in 2021:
Average Adjusted Gross Income (AGI) in 2020: $47,631 (Individual Income Tax Returns)
Here:
$47,631
State:
$67,288
Salary/wage: $42,575 (reported on 83.8% of returns)
Here:
$42,575
State:
$55,628
(% of AGI for various income ranges: 1246.4% for AGIs below $25k, 3741.1% for AGIs $25k-50k, 6935.6% for AGIs $50k-75k, 9797.5% for AGIs $75k-100k, 18760.0% for AGIs $100k-200k)
Taxable interest for individuals: $394 (reported on 25.0% of returns)
This zip code:
$394
Ohio:
$1,518
(% of AGI for various income ranges: 8.6% for AGIs below $25k, 8.9% for AGIs $25k-50k, 34.4% for AGIs $50k-75k, 26.7% for AGIs $100k-200k)
Ordinary dividends: $1,250 (reported on 11.8% of returns)
Here:
$1,250
State:
$7,167
(% of AGI for various income ranges: 17.2% for AGIs $25k-50k, 47.8% for AGIs $50k-75k, 65.0% for AGIs $75k-100k)
Net capital gain/loss in AGI: +$1,750 (reported on 11.8% of returns)
Here:
+$1,750
State:
+$18,919
(% of AGI for various income ranges: 50.0% for AGIs $25k-50k, 125.0% for AGIs $75k-100k)
Profit/loss from business: +$5,238 (reported on 11.8% of returns)
Here:
+$5,238
State:
+$13,744
(% of AGI for various income ranges: 165.0% for AGIs below $25k, 208.9% for AGIs $50k-75k)
Taxable individual retirement arrangement distribution: $10,420 (reported on 7.4% of returns)
45862:
$10,420
Ohio:
$18,876
(% of AGI for various income ranges: 289.4% for AGIs $25k-50k)
Earned income credit: $2,120 (reported on 14.7% of returns)
Here:
$2,120
State:
$2,304
(% of AGI for various income ranges: 64.3% for AGIs below $25k, 67.8% for AGIs $25k-50k)
Percentage of individuals using paid preparers for their 2020 taxes: 98.5%
Here:
99%
State:
94%
(% for various income ranges: 95.2% for AGIs below $25k, 100.0% for AGIs $25k-50k, 100.0% for AGIs $50k-75k, 100.0% for AGIs $75k-100k, 100.0% for AGIs $100k-200k)
Averages for the 2012 tax year for zip code 45862, filed in 2013:
Average Adjusted Gross Income (AGI) in 2012: $38,216 (Individual Income Tax Returns)
Here:
$38,216
State:
$54,926
Salary/wage: $34,360 (reported on 85.3% of returns)
Here:
$34,360
State:
$45,869
(% of AGI for various income ranges: 73.1% for AGIs below $25k, 85.3% for AGIs $25k-50k, 74.4% for AGIs $50k-75k, 80.7% for AGIs $75k-100k, 59.9% for AGIs $100k-200k)
Taxable interest for individuals: $516 (reported on 27.9% of returns)
This zip code:
$516
Ohio:
$1,297
(% of AGI for various income ranges: 1.3% for AGIs below $25k, 0.2% for AGIs $25k-50k, 0.5% for AGIs $50k-75k, 0.2% for AGIs $75k-100k)
Ordinary dividends: $1,312 (reported on 11.8% of returns)
Here:
$1,312
State:
$5,821
(% of AGI for various income ranges: 0.2% for AGIs $25k-50k, 1.4% for AGIs $50k-75k)
Net capital gain/loss in AGI: +$275 (reported on 5.9% of returns)
Here:
+$275
State:
+$11,232
(% of AGI for various income ranges: 0.2% for AGIs $50k-75k)
Profit/loss from business: +$4,362 (reported on 11.8% of returns)
Here:
+$4,362
State:
+$12,773
(% of AGI for various income ranges: 5.6% for AGIs below $25k, 0.4% for AGIs $25k-50k, 1.9% for AGIs $50k-75k)
Taxable individual retirement arrangement distribution: $6,040 (reported on 7.4% of returns)
45862:
$6,040
Ohio:
$14,511
(% of AGI for various income ranges: 3.5% for AGIs $25k-50k)
Total itemized deductions: $15,527 (24% of AGI, reported on 16.2% of returns)
Here:
$15,527
State:
$21,278
Here:
23.6% of AGI
State:
18.8% of AGI
(% of AGI for various income ranges: 7.5% for AGIs $25k-50k, 6.6% for AGIs $50k-75k, 16.8% for AGIs $75k-100k)
Charity contributions: $4,580 (reported on 7.4% of returns)
Here:
$4,580
State:
$3,943
(% of AGI for various income ranges: 1.1% for AGIs $25k-50k, 3.5% for AGIs $75k-100k)
Taxes paid: $5,155 (reported on 16.2% of returns)
45862:
$5,155
State:
$9,568
(% of AGI for various income ranges: 1.7% for AGIs $25k-50k, 2.2% for AGIs $50k-75k, 7.4% for AGIs $75k-100k)
Earned income credit: $2,320 (reported on 14.7% of returns)
Here:
$2,320
State:
$2,285
(% of AGI for various income ranges: 5.0% for AGIs below $25k, 0.7% for AGIs $25k-50k)
Percentage of individuals using paid preparers for their 2012 taxes: 66.2%
Here:
66%
State:
51%
(% for various income ranges: 59.3% for AGIs below $25k, 65.2% for AGIs $25k-50k, 72.7% for AGIs $50k-75k, 100.0% for AGIs $75k-100k, 66.7% for AGIs $100k-200k)
Averages for the 2004 tax year for zip code 45862, filed in 2005:
Average Adjusted Gross Income (AGI) in 2004: $30,647 (Individual Income Tax Returns)
Here:
$30,647
State:
$44,480
Salary/wage: $29,321 (reported on 84.5% of returns)
Here:
$29,321
State:
$39,198
(% of AGI for various income ranges: 85.1% for AGIs below $10k, 73.0% for AGIs $10k-25k, 88.1% for AGIs $25k-50k, 83.4% for AGIs $50k-75k, 91.7% for AGIs $75k-100k, 48.4% for AGIs over 100k)
Taxable interest for individuals: $903 (reported on 40.7% of returns)
This zip code:
$903
Ohio:
$1,532
(% of AGI for various income ranges: 5.1% for AGIs below $10k, 2.6% for AGIs $10k-25k, 0.8% for AGIs $25k-50k, 1.0% for AGIs $50k-75k, 0.1% for AGIs $75k-100k, 0.5% for AGIs over 100k)
Taxable dividends: $1,000 (reported on 12.4% of returns)
Here:
$1,000
State:
$3,496
(% of AGI for various income ranges: 0.9% for AGIs below $10k, 0.9% for AGIs $10k-25k, 0.1% for AGIs $25k-50k, 0.9% for AGIs $50k-75k)
Net capital gain/loss: +$1,897 (reported on 8.9% of returns)
Here:
+$1,897
State:
+$8,582
(% of AGI for various income ranges: -1.3% for AGIs below $10k, -0.3% for AGIs $10k-25k, 0.3% for AGIs $25k-50k, 2.4% for AGIs $50k-75k)
Profit/loss from business: +$2,294 (reported on 11.2% of returns)
Here:
+$2,294
State:
+$10,813
Total itemized deductions: $11,403 (22% of AGI, reported on 17.6% of returns)
Here:
$11,403
State:
$17,503
Here:
21.5% of AGI
State:
20.8% of AGI
(% of AGI for various income ranges: 6.8% for AGIs $10k-25k, 5.9% for AGIs $25k-50k, 6.1% for AGIs $50k-75k, 9.9% for AGIs $75k-100k, 9.5% for AGIs over 100k)
Charity contributions deductions: $1,878 (3% of AGI, reported on 10.8% of returns)
Here:
$1,878
State:
$3,087
Here:
3.3% of AGI
State:
3.4% of AGI
(% of AGI for various income ranges: 0.3% for AGIs $10k-25k, 0.7% for AGIs $25k-50k, 0.9% for AGIs $50k-75k, 1.7% for AGIs $75k-100k)
Total tax: $3,365 (reported on 76.8% of returns)
45862:
$3,365
State:
$6,781
(% of AGI for various income ranges: 2.6% for AGIs below $10k, 4.3% for AGIs $10k-25k, 7.0% for AGIs $25k-50k, 9.2% for AGIs $50k-75k, 10.3% for AGIs $75k-100k, 20.1% for AGIs over 100k)
Earned income credit: $1,772 (reported on 13.3% of returns)
Here:
$1,772
State:
$1,696
Percentage of individuals using paid preparers for their 2004 taxes: 65.0%
Here:
65%
State:
55%
(% for various income ranges: 55.3% for AGIs below $10k, 67.4% for AGIs $10k-25k, 68.3% for AGIs $25k-50k, 62.4% for AGIs $50k-75k, 70.0% for AGIs $75k-100k, 84.6% for AGIs over 100k)
Likely homosexual households (counted as self-reported same-sex unmarried-partner households)
Lesbian couples: 0.9% of all households
Gay men: 0.0% of all households
Household received Food Stamps/SNAP in the past 12 months: 23 Household did not receive Food Stamps/SNAP in the past 12 months: 608
Women who had a birth in the past 12 months: 9 (10 now married, 0 unmarried) Women who did not have a birth in the past 12 months: 185 (91 now married, 94 unmarried)
Housing units in zip code 45862 with a mortgage: 178 (18 second mortgage, 18 both second mortgage and home equity loan) Median monthly owner costs for units with a mortgage: $1,117 Median monthly owner costs for units without a mortgage: $396
Residents with income below the poverty level in 2022:
This zip code:
7.7%
Whole state:
13.4%
Residents with income below 50% of the poverty level in 2022:
This zip code:
4.6%
Whole state:
7.0%
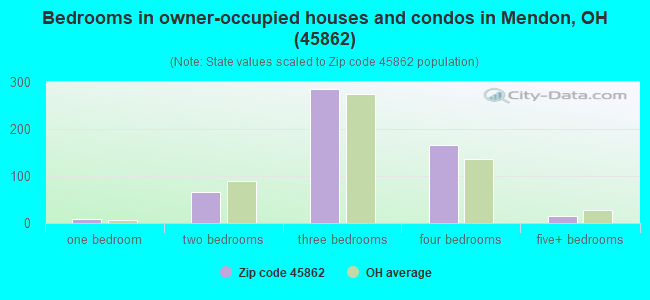
Median number of rooms in houses and condos:
Here:
6.9
State:
6.7
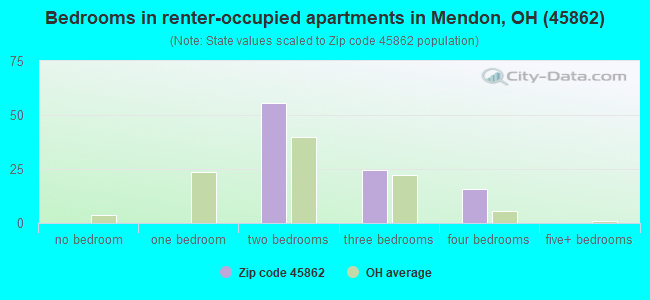
Median number of rooms in apartments:
Here:
5.4
State:
4.4
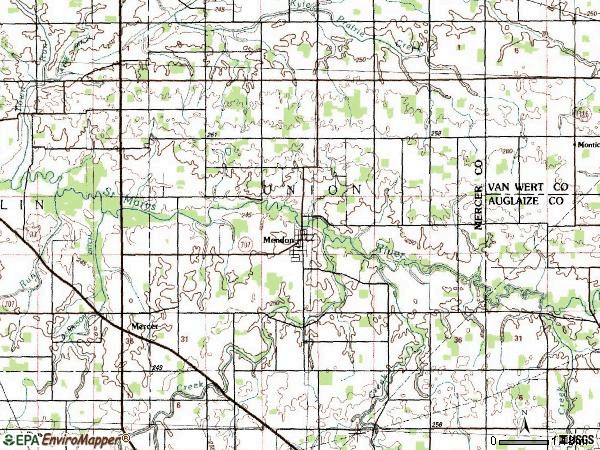
Notable locations in this zip code not listed on our city pages
Churches in zip code 45862 include: Bethel Church (A), Charity Church (B), Calvary Evangelical Methodist Church (C), Pleasant Grove Baptist Church (D), Mendon First Church of God (E), Mendon United Methodist Church (F). Display/hide their locations on the map
Cemeteries: Sherer Cemetery (1), Coil Cemetery (2), Fryer Cemetery (3), Calvary Cemetery (4), Hamilton Cemetery (5), Hussey Cemetery (6), Mendon Cemetery (7). Display/hide their locations on the map
Size of family households: 139 2-persons, 51 3-persons, 37 4-persons, 22 5-persons, 22 6-persons, 6 7-or-more-persons
Size of nonfamily households: 306 1-person, 48 2-persons, 2 3-persons
166 married couples with children.
65 single-parent households (32 men, 33 women).
99.8% of residents of 45862 zip code speak English at home.
0.7% of residents speak Spanish at home (100% very well).
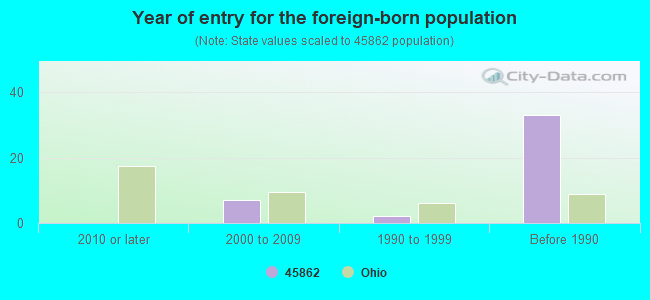
Foreign born population: 46 (3.6%) (6.6% of them are naturalized citizens)
This zip code:
3.6%
Whole state:
5.0%
77%France
6%Honduras
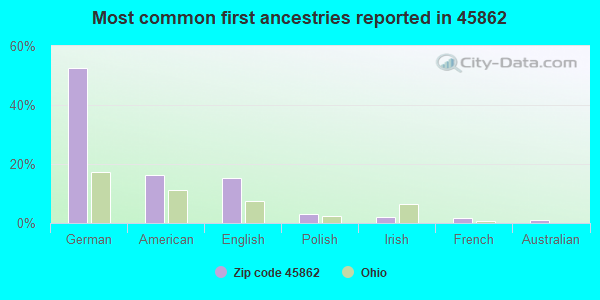
52%German
16%American
15%English
3%Polish
2%Irish
2%French
1%Australian
Year of entry for the foreign-born population
02010 or later
72000 to 2009
21990 to 1999
33Before 1990
Housing units lacking complete kitchen facilities: 5.1%
46.3%Bottled, tank, or LP gas
37.7%Electricity
10.6%Wood
3.2%Utility gas
2.4%Fuel oil, kerosene, etc.
Population in 1990: 1,527. Population change in the 1990s: +84 (+5.5%).
Place of birth for U.S.-born residents:
This state: 1,131
Northeast: 38
Midwest: 42
South: 32
West: 18
72% of the 45862 zip code residents lived in the same house 5 years ago. Out of people who lived in different houses, 53% lived in this county. Out of people who lived in different counties, 50% lived in Ohio.
94% of the 45862 zip code residents lived in the same house 1 year ago. Out of people who lived in different houses, 64% moved from this county. Out of people who lived in different houses, 15% moved from different county within same state. Out of people who lived in different houses, 24% moved from different state.
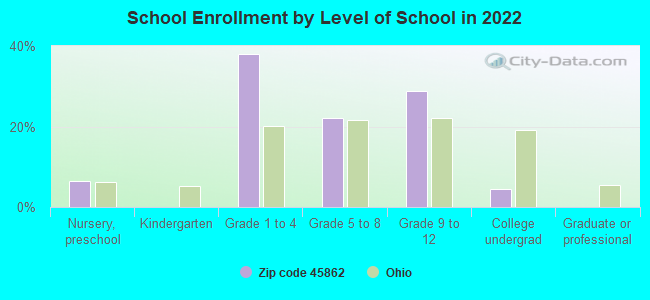
Private vs. public school enrollment:
Students in private schools in grades 1 to 8 (elementary and middle school): 2
Here:
1.6%
Ohio:
16.0%
Students in private schools in grades 9 to 12 (high school):
Here:
0.0%
Ohio:
13.1%
Students in private undergraduate colleges: 5
Here:
54.1%
Ohio:
22.3%
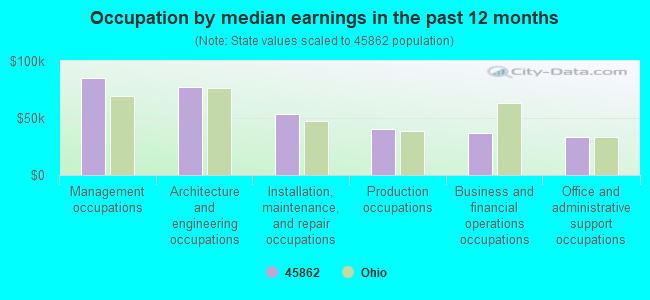
Occupation by median earnings in the past 12 months ($)
84,729Management occupations
77,341Architecture and engineering occupations
53,802Installation, maintenance, and repair occupations
40,777Production occupations
37,250Business and financial operations occupations
33,607Office and administrative support occupations
Top industries in this zip code by the number of employees in 2005:
Administrative and Support and Waste Management and Remediation Services: Security Guards and Patrol Services (10-19 employees: 1 establishment)
Other Services (except Public Administration): Pet Care (except Veterinary) Services (5-9: 1)
Construction: Water and Sewer Line and Related Structures Construction (1-4: 1)
Construction: New Single-Family Housing Construction (except Operative Builders) (1-4: 1)
Health Care and Social Assistance: Offices of Chiropractors (1-4: 1)
Finance and Insurance: Insurance Agencies and Brokerages (1-4: 1)
Fatal accident statistics in 2014:
Fatal accident count: 1
Vehicles involved in fatal accidents: 2
Fatal accidents caused by drunken drivers: 0
Fatalities: 1
Persons involved in fatal accidents: 6
Pedestrians involved in fatal accidents: 0
Fatal accident statistics in 2011:
Fatal accident count: 1
Vehicles involved in fatal accidents: 1
Fatal accidents caused by drunken drivers: 0
Fatalities: 1
Persons involved in fatal accidents: 1
Pedestrians involved in fatal accidents: 0
2002 - 2018 National Fire Incident Reporting System (NFIRS) incidents
According to the data from the years 2002 - 2018 the average number of fire incidents per year is 15. The highest number of reported fires - 28 took place in 2010, and the least - 6 in 2006. The data has an increasing trend.
When looking into fire subcategories, the most incidents belonged to: Structure Fires (53.1%), and Outside Fires (37.8%).
Fire incident types reported to NFIRS in Zip Code 45862


 Nearest zip codes: 45838, 45894, 45822, 45887, 45885, 45882.


 According to the data from the years 2002 - 2018 the average number of fire incidents per year is 15. The highest number of reported fires - 28 took place in 2010, and the least - 6 in 2006. The data has an increasing trend.
 When looking into fire subcategories, the most incidents belonged to: Structure Fires (53.1%), and Outside Fires (37.8%).