Estimated zip code population in 2022: 4,397 Zip code population in 2010: 4,755 Zip code population in 2000: 4,719
Houses and condos: 1,899 Renter-occupied apartments: 427
% of renters here:
24%
State:
33%
March 2022 cost of living index in zip code 45887: 83.4 (less than average, U.S. average is 100)
Land area: 71.3 sq. mi. Water area: 0.1 sq. mi.
Population density: 62 people per square mile
(very low).
OSM Map
General Map
Google Map
MSN Map
OSM Map
General Map
Google Map
MSN Map
OSM Map
General Map
Google Map
MSN Map
OSM Map
General Map
Google Map
MSN Map
Please wait while loading the map...
Real estate property taxes paid for housing units in 2022:
This zip code:
0.7% ($1,459)
Ohio:
1.3% ($2,639)
Median real estate property taxes paid for housing units with mortgages in 2022: $1,480 (0.9%) Median real estate property taxes paid for housing units with no mortgage in 2022: $1,441 (0.7%)
Business Search- 14 Million verified businesses
Males: 2,340
(53.2%)
Females: 2,057
(46.8%)
For population 25 years and over in 45887:
High school or higher: 91.4%
Bachelor's degree or higher: 14.2%
Graduate or professional degree: 4.4%
Unemployed: 2.7%
Mean travel time to work (commute): 24.5 minutes
For population 15 years and over in 45887:
Never married: 21.8%
Now married: 57.3%
Separated: 2.7%
Widowed: 3.9%
Divorced: 14.3%
Zip code 45887 compared to state average:
Black race population percentage significantly below state average.
Hispanic race population percentage significantly below state average.
Foreign-born population percentage significantly below state average.
Length of stay since moving in significantly above state average.
Number of college students significantly below state average.
Percentage of population with a bachelor's degree or higher significantly below state average.
Averages for the 2020 tax year for zip code 45887, filed in 2021:
Average Adjusted Gross Income (AGI) in 2020: $53,226 (Individual Income Tax Returns)
Here:
$53,226
State:
$67,288
Salary/wage: $47,812 (reported on 81.8% of returns)
Here:
$47,812
State:
$55,628
(% of AGI for various income ranges: 1166.4% for AGIs below $25k, 3645.3% for AGIs $25k-50k, 6905.9% for AGIs $50k-75k, 9858.7% for AGIs $75k-100k, 14216.7% for AGIs $100k-200k)
Taxable interest for individuals: $732 (reported on 24.9% of returns)
This zip code:
$732
Ohio:
$1,518
(% of AGI for various income ranges: 22.2% for AGIs below $25k, 22.2% for AGIs $25k-50k, 11.4% for AGIs $50k-75k, 35.3% for AGIs $75k-100k, 63.9% for AGIs $100k-200k)
Ordinary dividends: $2,172 (reported on 17.3% of returns)
Here:
$2,172
State:
$7,167
(% of AGI for various income ranges: 17.6% for AGIs below $25k, 26.3% for AGIs $25k-50k, 49.7% for AGIs $50k-75k, 158.0% for AGIs $75k-100k, 143.3% for AGIs $100k-200k)
Net capital gain/loss in AGI: +$5,984 (reported on 14.2% of returns)
Here:
+$5,984
State:
+$18,919
(% of AGI for various income ranges: 7.1% for AGIs below $25k, 34.1% for AGIs $25k-50k, 102.8% for AGIs $50k-75k, 159.3% for AGIs $75k-100k, 655.0% for AGIs $100k-200k)
Profit/loss from business: +$9,772 (reported on 11.1% of returns)
Here:
+$9,772
State:
+$13,744
(% of AGI for various income ranges: 47.3% for AGIs below $25k, 95.1% for AGIs $25k-50k, 121.4% for AGIs $50k-75k, 228.7% for AGIs $75k-100k, 593.9% for AGIs $100k-200k)
Taxable individual retirement arrangement distribution: $16,140 (reported on 11.1% of returns)
45887:
$16,140
Ohio:
$18,876
(% of AGI for various income ranges: 104.4% for AGIs below $25k, 145.7% for AGIs $25k-50k, 208.6% for AGIs $50k-75k, 343.3% for AGIs $75k-100k, 961.7% for AGIs $100k-200k)
Total itemized deductions: $37,180 (reported on 2.2% of returns)
Here:
$37,180
State:
$33,869
(% of AGI for various income ranges: 163.6% for AGIs below $25k, 623.9% for AGIs $100k-200k)
Charity contributions: $21,100 (reported on 1.3% of returns)
Here:
$21,100
State:
$14,577
(% of AGI for various income ranges: 218.3% for AGIs $50k-75k)
Taxes paid: $5,575 (reported on 1.8% of returns)
45887:
$5,575
State:
$7,681
(% of AGI for various income ranges: 123.9% for AGIs $100k-200k)
Earned income credit: $2,352 (reported on 13.8% of returns)
Here:
$2,352
State:
$2,304
(% of AGI for various income ranges: 85.1% for AGIs below $25k, 70.6% for AGIs $25k-50k)
Percentage of individuals using paid preparers for their 2020 taxes: 92.0%
Here:
92%
State:
94%
(% for various income ranges: 89.2% for AGIs below $25k, 92.2% for AGIs $25k-50k, 92.9% for AGIs $50k-75k, 95.7% for AGIs $75k-100k, 96.4% for AGIs $100k-200k, 66.7% for AGIs over 200k)
Averages for the 2012 tax year for zip code 45887, filed in 2013:
Average Adjusted Gross Income (AGI) in 2012: $46,043 (Individual Income Tax Returns)
Here:
$46,043
State:
$54,926
Salary/wage: $38,913 (reported on 85.5% of returns)
Here:
$38,913
State:
$45,869
(% of AGI for various income ranges: 70.3% for AGIs below $25k, 78.0% for AGIs $25k-50k, 78.7% for AGIs $50k-75k, 80.5% for AGIs $75k-100k, 83.2% for AGIs $100k-200k)
Taxable interest for individuals: $802 (reported on 30.0% of returns)
This zip code:
$802
Ohio:
$1,297
(% of AGI for various income ranges: 1.0% for AGIs below $25k, 0.5% for AGIs $25k-50k, 0.3% for AGIs $50k-75k, 0.3% for AGIs $75k-100k, 0.8% for AGIs $100k-200k)
Ordinary dividends: $1,644 (reported on 18.6% of returns)
Here:
$1,644
State:
$5,821
(% of AGI for various income ranges: 0.9% for AGIs below $25k, 0.7% for AGIs $25k-50k, 0.3% for AGIs $50k-75k, 0.5% for AGIs $75k-100k, 1.3% for AGIs $100k-200k)
Net capital gain/loss in AGI: +$6,004 (reported on 11.4% of returns)
Here:
+$6,004
State:
+$11,232
(% of AGI for various income ranges: 0.2% for AGIs below $25k, 0.2% for AGIs $50k-75k, 0.3% for AGIs $75k-100k, 6.6% for AGIs $100k-200k)
Profit/loss from business: +$6,644 (reported on 14.5% of returns)
Here:
+$6,644
State:
+$12,773
(% of AGI for various income ranges: 5.2% for AGIs below $25k, 1.3% for AGIs $25k-50k, 1.1% for AGIs $50k-75k, 1.5% for AGIs $75k-100k, 3.8% for AGIs $100k-200k)
Taxable individual retirement arrangement distribution: $9,504 (reported on 10.5% of returns)
45887:
$9,504
Ohio:
$14,511
(% of AGI for various income ranges: 3.9% for AGIs below $25k, 3.2% for AGIs $25k-50k, 1.6% for AGIs $50k-75k, 1.8% for AGIs $75k-100k, 1.9% for AGIs $100k-200k)
Total itemized deductions: $16,177 (18% of AGI, reported on 19.5% of returns)
Here:
$16,177
State:
$21,278
Here:
17.9% of AGI
State:
18.8% of AGI
(% of AGI for various income ranges: 3.7% for AGIs below $25k, 4.9% for AGIs $25k-50k, 5.9% for AGIs $50k-75k, 7.6% for AGIs $75k-100k, 13.8% for AGIs $100k-200k)
Charity contributions: $3,600 (reported on 14.1% of returns)
Here:
$3,600
State:
$3,943
(% of AGI for various income ranges: 0.7% for AGIs $25k-50k, 1.1% for AGIs $50k-75k, 1.1% for AGIs $75k-100k, 2.5% for AGIs $100k-200k)
Taxes paid: $6,153 (reported on 19.5% of returns)
45887:
$6,153
State:
$9,568
(% of AGI for various income ranges: 0.6% for AGIs below $25k, 1.2% for AGIs $25k-50k, 2.0% for AGIs $50k-75k, 2.9% for AGIs $75k-100k, 6.5% for AGIs $100k-200k)
Earned income credit: $2,264 (reported on 16.4% of returns)
Here:
$2,264
State:
$2,285
(% of AGI for various income ranges: 5.5% for AGIs below $25k, 1.1% for AGIs $25k-50k)
Percentage of individuals using paid preparers for their 2012 taxes: 62.3%
Here:
62%
State:
51%
(% for various income ranges: 55.3% for AGIs below $25k, 63.9% for AGIs $25k-50k, 68.6% for AGIs $50k-75k, 65.0% for AGIs $75k-100k, 70.6% for AGIs $100k-200k, 100.0% for AGIs over 200k)
Averages for the 2004 tax year for zip code 45887, filed in 2005:
Average Adjusted Gross Income (AGI) in 2004: $37,355 (Individual Income Tax Returns)
Here:
$37,355
State:
$44,480
Salary/wage: $33,854 (reported on 88.7% of returns)
Here:
$33,854
State:
$39,198
(% of AGI for various income ranges: 95.4% for AGIs below $10k, 73.8% for AGIs $10k-25k, 84.6% for AGIs $25k-50k, 85.9% for AGIs $50k-75k, 86.5% for AGIs $75k-100k, 57.3% for AGIs over 100k)
Taxable interest for individuals: $1,090 (reported on 44.8% of returns)
This zip code:
$1,090
Ohio:
$1,532
(% of AGI for various income ranges: 6.4% for AGIs below $10k, 3.4% for AGIs $10k-25k, 1.1% for AGIs $25k-50k, 0.9% for AGIs $50k-75k, 0.6% for AGIs $75k-100k, 0.8% for AGIs over 100k)
Taxable dividends: $1,074 (reported on 21.9% of returns)
Here:
$1,074
State:
$3,496
(% of AGI for various income ranges: 2.8% for AGIs below $10k, 1.1% for AGIs $10k-25k, 0.5% for AGIs $25k-50k, 0.5% for AGIs $50k-75k, 0.4% for AGIs $75k-100k, 0.7% for AGIs over 100k)
Net capital gain/loss: +$2,290 (reported on 13.0% of returns)
Here:
+$2,290
State:
+$8,582
(% of AGI for various income ranges: -0.7% for AGIs below $10k, -0.0% for AGIs $10k-25k, 0.6% for AGIs $25k-50k, 0.3% for AGIs $50k-75k, 0.1% for AGIs $75k-100k, 3.9% for AGIs over 100k)
Profit/loss from business: +$6,273 (reported on 12.8% of returns)
Here:
+$6,273
State:
+$10,813
(% of AGI for various income ranges: -0.1% for AGIs below $10k, 2.4% for AGIs $10k-25k, 2.0% for AGIs $25k-50k, 1.6% for AGIs $50k-75k, 1.5% for AGIs $75k-100k, 4.5% for AGIs over 100k)
IRA payment deduction: $2,596 (reported on 2.3% of returns)
45887:
$2,596
Ohio:
$2,794
Total itemized deductions: $13,636 (21% of AGI, reported on 24.7% of returns)
Here:
$13,636
State:
$17,503
Here:
20.5% of AGI
State:
20.8% of AGI
(% of AGI for various income ranges: 8.4% for AGIs $10k-25k, 7.0% for AGIs $25k-50k, 9.2% for AGIs $50k-75k, 10.5% for AGIs $75k-100k, 13.3% for AGIs over 100k)
Charity contributions deductions: $2,669 (4% of AGI, reported on 18.3% of returns)
Here:
$2,669
State:
$3,087
Here:
3.7% of AGI
State:
3.4% of AGI
(% of AGI for various income ranges: 0.5% for AGIs $10k-25k, 0.8% for AGIs $25k-50k, 1.3% for AGIs $50k-75k, 1.6% for AGIs $75k-100k, 2.9% for AGIs over 100k)
Total tax: $4,342 (reported on 76.9% of returns)
45887:
$4,342
State:
$6,781
(% of AGI for various income ranges: 2.3% for AGIs below $10k, 4.1% for AGIs $10k-25k, 6.9% for AGIs $25k-50k, 8.5% for AGIs $50k-75k, 10.5% for AGIs $75k-100k, 17.3% for AGIs over 100k)
Earned income credit: $1,661 (reported on 10.6% of returns)
Here:
$1,661
State:
$1,696
Percentage of individuals using paid preparers for their 2004 taxes: 63.7%
Here:
64%
State:
55%
(% for various income ranges: 52.3% for AGIs below $10k, 62.8% for AGIs $10k-25k, 66.9% for AGIs $25k-50k, 69.0% for AGIs $50k-75k, 69.6% for AGIs $75k-100k, 64.6% for AGIs over 100k)
Household received Food Stamps/SNAP in the past 12 months: 330 Household did not receive Food Stamps/SNAP in the past 12 months: 1,463
Women who had a birth in the past 12 months: 66 (50 now married, 16 unmarried) Women who did not have a birth in the past 12 months: 692 (380 now married, 312 unmarried)
Housing units in zip code 45887 with a mortgage: 697 (68 second mortgage, 65 both second mortgage and home equity loan) Houses without a mortgage: 64
Median monthly owner costs for units with a mortgage: $1,199 Median monthly owner costs for units without a mortgage: $415
Residents with income below the poverty level in 2022:
This zip code:
11.8%
Whole state:
13.4%
Residents with income below 50% of the poverty level in 2022:
This zip code:
5.9%
Whole state:
7.0%
Median number of rooms in houses and condos:
Here:
6.6
State:
6.7
Median number of rooms in apartments:
Here:
5.9
State:
4.4
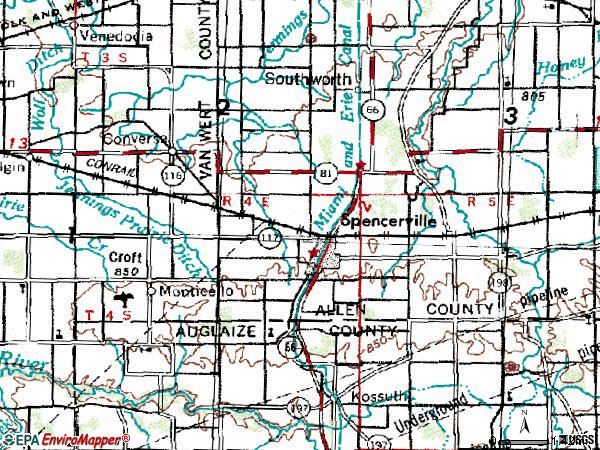
Notable locations in this zip code not listed on our city pages
Notable locations in zip code 45887: Gallman Farms (A), Seibert Farm (B), Spencerville Ambulance Service (C), Spencerville Invincible Fire Department (D). Display/hide their locations on the map
Churches in zip code 45887 include: Amanda Church (A), First Federated Church (B), First Baptist Church (C), Church of the Nazarene (D), Hartford Christian Church (E), Saint Patrick Catholic Church (F), Trinity United Methodist Church (G), Kossuth Zion United Methodist Church (H), Christie Chapel (I). Display/hide their locations on the map
Cemeteries: Spencerville Cemetery (1), Fissel Lauth Cemetery (2), Zion Cemetery (3), Kossuth Cemetery (4), Mount Union Cemetery (5), New Salem Cemetery (6), Hance Cemetery (7). Display/hide their locations on the map
In group quarters: 51 (-1 institutionalized population)
Size of family households: 572 2-persons, 235 3-persons, 167 4-persons, 171 5-persons, 40 6-persons, 3 7-or-more-persons
Size of nonfamily households: 506 1-person, 88 2-persons
670 married couples with children.
460 single-parent households (188 men, 272 women).
98.9% of residents of 45887 zip code speak English at home.
0.2% of residents speak Spanish at home (100% very well).
0.7% of residents speak other Indo-European language at home (34% very well, 66% well).
Foreign born population: 0 (0.0%)
:
0.0%
Whole state:
5.0%
44%German
15%American
10%English
4%Irish
4%European
3%Scottish
3%Pennsylvania German
Year of entry for the foreign-born population
02010 or later
02000 to 2009
01990 to 1999
20Before 1990
Facilities with environmental interests located in this zip code:
CHARLES RIVER LABORATORIES, INC. (553 NORTH BROADWAY in SPENCERVILLE, OH)
AIR MINOR (AIRS/AFS) COMPLIANCE ACTIVITY (Tracking inspections of insecticide, fungicide, and rodenticide, and toxic substances) STATE MASTER (Ohio general info) - AIR MAJOR Small Quantity Generators, between 100 kg and 1000 kg of hazardous waste/month (Resource Conservation and Recovery Act (tracking hazardous waste)) Business SIC classification: REFUSE SYSTEMS Organizations: CHARLES RIVER LABORATORIES INC (CONTACT/OPERATOR)
, SPRINGBORN HOLDINGS INC (CONTACT/OWNER)
Alternative names: SPRINGBORN LABORATORIES INC, SPRINGBORN LIFE SCIENCES, INC
CHARLES RIVER LABORATORIES, INC. (640 NORTH ELIZABETH STREET in SPENCERVILLE, OH)
STATE MASTER (Ohio general info) - RCRA-OHR000001180, HAZARDOUS WASTE PROGRAM, AIR MAJOR Small Quantity Generators, between 100 kg and 1000 kg of hazardous waste/month (Resource Conservation and Recovery Act (tracking hazardous waste)) Business SIC classification: COMMERCIAL PHYSICAL AND BIOLOGICAL RESEARCH Organizations: CHARLES RIVER LABORATORIES INC (CONTACT/OPERATOR)
, SPRINGBORN HOLDINGS INC (CONTACT/OWNER)
Alternative names: SPRINGBORN LABORATORIES INC
Housing units lacking complete plumbing facilities: 4.0% Housing units lacking complete kitchen facilities: 2.2%
49.4%Utility gas
24.6%Bottled, tank, or LP gas
16.7%Electricity
4.9%Wood
4.1%Other fuel
Population in 1990: 5,745.
Place of birth for U.S.-born residents:
This state: 3,679
Northeast: 129
Midwest: 182
South: 292
West: 84
65% of the 45887 zip code residents lived in the same house 5 years ago. Out of people who lived in different houses, 60% lived in this county. Out of people who lived in different counties, 50% lived in Ohio.
96% of the 45887 zip code residents lived in the same house 1 year ago. Out of people who lived in different houses, 77% moved from this county. Out of people who lived in different houses, 27% moved from different county within same state. Out of people who lived in different houses, 5% moved from abroad.
Private vs. public school enrollment:
Students in private schools in grades 1 to 8 (elementary and middle school): 100
Here:
16.0%
Ohio:
16.0%
Students in private schools in grades 9 to 12 (high school): 30
Here:
11.2%
Ohio:
13.1%
Students in private undergraduate colleges: 2
Here:
5.5%
Ohio:
22.3%
Occupation by median earnings in the past 12 months ($)
106,036Health diagnosing and treating practitioners and other technical occupations
68,597Architecture and engineering occupations
58,402Transportation occupations
56,160Material moving occupations
54,640Production occupations
53,290Installation, maintenance, and repair occupations
Companies with federal contracts located in this zip code:
KANYON ENTERPRISES LLC (415 E 4TH ST in SPENCERVILLE, OH; small business) : $14,582 in 5 contractsfrom 2004 to 2005
Contracts for Heat Exchangers and Steam Condensers, Switches, Miscellaneous Service and Trade Equipment by Defense Logistics Agency Signed by year:2000: $0; 2001: $0; 2002: $0; 2003: $0; 2004: $6,248; 2005: $8,334; 2006: $0.
Biggest contracts:
$3,128 with Defense Logistics Agency for Heat Exchangers and Steam Condensers. Signed on 2004-11-12. Completion date: 2004-12-17.
$3,120, same as above.Signed on 2004-11-12. Completion date: 2004-12-17.
$2,865 with Defense Logistics Agency for Switches. Signed on 2005-01-12. Completion date: 2005-02-12.
$2,865, same as above.Signed on 2005-01-12. Completion date: 2005-02-12.
Top industries in this zip code by the number of employees in 2005:
Management of Companies and Enterprises: Corporate, Subsidiary, and Regional Managing Offices (100-249 employees: 1 establishment)
Health Care and Social Assistance: Nursing Care Facilities (100-249: 1)
Professional, Scientific, and Technical Services: Testing Laboratories (100-249: 1)
Health Care and Social Assistance: Offices of Physicians (except Mental Health Specialists) (10-19: 2, 1-4: 1)
People in group quarters in 2010:
50 people in nursing facilities/skilled-nursing facilities
People in group quarters in 2000:
92 people in nursing homes
26 people in other group homes
Fatal accident statistics in 2011:
Fatal accident count: 1
Vehicles involved in fatal accidents: 2
Fatal accidents caused by drunken drivers: 1
Fatalities: 1
Persons involved in fatal accidents: 3
Pedestrians involved in fatal accidents: 0
Home Mortgage Disclosure Act Aggregated Statistics For Year 2009 (Based on 2 partial tracts)
A) FHA, FSA/RHS & VA Home Purchase Loans
B) Conventional Home Purchase Loans
C) Refinancings
D) Home Improvement Loans
F) Non-occupant Loans on < 5 Family Dwellings (A B C & D)
G) Loans On Manufactured Home Dwelling (A B C & D)
Number
Average Value
Number
Average Value
Number
Average Value
Number
Average Value
Number
Average Value
Number
Average Value
LOANS ORIGINATED
8
$86,514
21
$113,598
208
$133,851
3
$60,087
1
$247,370
4
$75,330
APPLICATIONS APPROVED, NOT ACCEPTED
3
$85,090
0
$0
33
$141,548
0
$0
0
$0
0
$0
APPLICATIONS DENIED
1
$51,320
5
$39,210
62
$119,250
7
$41,917
1
$46,050
3
$28,947
APPLICATIONS WITHDRAWN
0
$0
5
$171,844
17
$126,085
1
$128,950
0
$0
0
$0
FILES CLOSED FOR INCOMPLETENESS
0
$0
0
$0
3
$118,423
0
$0
0
$0
0
$0
Aggregated Statistics For Year 2008 (Based on 2 partial tracts)
A) FHA, FSA/RHS & VA Home Purchase Loans
B) Conventional Home Purchase Loans
C) Refinancings
D) Home Improvement Loans
F) Non-occupant Loans on < 5 Family Dwellings (A B C & D)
G) Loans On Manufactured Home Dwelling (A B C & D)
Number
Average Value
Number
Average Value
Number
Average Value
Number
Average Value
Number
Average Value
Number
Average Value
LOANS ORIGINATED
5
$99,474
38
$115,687
111
$121,089
11
$25,718
4
$46,052
0
$0
APPLICATIONS APPROVED, NOT ACCEPTED
1
$125,000
8
$84,540
22
$172,848
0
$0
0
$0
0
$0
APPLICATIONS DENIED
1
$200,000
11
$151,795
66
$109,770
9
$24,854
0
$0
1
$100,000
APPLICATIONS WITHDRAWN
0
$0
8
$115,626
16
$163,406
1
$38,160
0
$0
1
$84,210
FILES CLOSED FOR INCOMPLETENESS
0
$0
0
$0
3
$52,633
3
$13,597
0
$0
0
$0
Aggregated Statistics For Year 2007 (Based on 2 partial tracts)
A) FHA, FSA/RHS & VA Home Purchase Loans
B) Conventional Home Purchase Loans
C) Refinancings
D) Home Improvement Loans
F) Non-occupant Loans on < 5 Family Dwellings (A B C & D)
G) Loans On Manufactured Home Dwelling (A B C & D)
Number
Average Value
Number
Average Value
Number
Average Value
Number
Average Value
Number
Average Value
Number
Average Value
LOANS ORIGINATED
9
$96,931
66
$113,119
96
$115,283
9
$49,562
9
$82,164
3
$78,070
APPLICATIONS APPROVED, NOT ACCEPTED
1
$88,160
8
$118,586
14
$117,294
5
$32,632
0
$0
3
$86,403
APPLICATIONS DENIED
1
$51,320
13
$157,694
97
$105,305
20
$22,368
9
$177,779
4
$52,302
APPLICATIONS WITHDRAWN
1
$102,630
7
$63,534
33
$91,348
3
$56,580
1
$19,740
0
$0
FILES CLOSED FOR INCOMPLETENESS
0
$0
3
$290,353
13
$126,924
0
$0
1
$792,110
0
$0
Aggregated Statistics For Year 2006 (Based on 2 partial tracts)
A) FHA, FSA/RHS & VA Home Purchase Loans
B) Conventional Home Purchase Loans
C) Refinancings
D) Home Improvement Loans
F) Non-occupant Loans on < 5 Family Dwellings (A B C & D)
G) Loans On Manufactured Home Dwelling (A B C & D)
Number
Average Value
Number
Average Value
Number
Average Value
Number
Average Value
Number
Average Value
Number
Average Value
LOANS ORIGINATED
5
$92,632
79
$93,122
107
$101,845
21
$31,955
7
$50,376
5
$65,000
APPLICATIONS APPROVED, NOT ACCEPTED
0
$0
13
$97,471
29
$122,914
5
$20,526
0
$0
0
$0
APPLICATIONS DENIED
1
$106,580
25
$83,580
96
$109,760
36
$42,983
9
$143,861
1
$164,480
APPLICATIONS WITHDRAWN
0
$0
21
$107,394
57
$102,402
8
$101,152
1
$65,790
3
$104,387
FILES CLOSED FOR INCOMPLETENESS
0
$0
3
$133,773
8
$146,876
0
$0
0
$0
0
$0
Aggregated Statistics For Year 2005 (Based on 2 partial tracts)
A) FHA, FSA/RHS & VA Home Purchase Loans
B) Conventional Home Purchase Loans
C) Refinancings
D) Home Improvement Loans
F) Non-occupant Loans on < 5 Family Dwellings (A B C & D)
G) Loans On Manufactured Home Dwelling (A B C & D)
Number
Average Value
Number
Average Value
Number
Average Value
Number
Average Value
Number
Average Value
Number
Average Value
LOANS ORIGINATED
9
$98,978
80
$113,603
139
$101,780
33
$55,184
11
$54,905
8
$104,441
APPLICATIONS APPROVED, NOT ACCEPTED
0
$0
17
$106,889
32
$91,119
5
$52,106
0
$0
3
$70,177
APPLICATIONS DENIED
0
$0
12
$116,448
99
$84,862
32
$56,538
5
$127,106
3
$54,827
APPLICATIONS WITHDRAWN
0
$0
9
$255,997
47
$91,742
8
$98,356
4
$43,092
0
$0
FILES CLOSED FOR INCOMPLETENESS
0
$0
3
$169,737
11
$171,054
0
$0
1
$357,900
0
$0
Aggregated Statistics For Year 2004 (Based on 2 partial tracts)
A) FHA, FSA/RHS & VA Home Purchase Loans
B) Conventional Home Purchase Loans
C) Refinancings
D) Home Improvement Loans
F) Non-occupant Loans on < 5 Family Dwellings (A B C & D)
G) Loans On Manufactured Home Dwelling (A B C & D)
Number
Average Value
Number
Average Value
Number
Average Value
Number
Average Value
Number
Average Value
Number
Average Value
LOANS ORIGINATED
14
$100,283
93
$115,861
159
$95,789
18
$41,813
11
$60,168
1
$109,210
APPLICATIONS APPROVED, NOT ACCEPTED
0
$0
8
$74,342
38
$89,821
4
$14,802
3
$72,370
0
$0
APPLICATIONS DENIED
4
$67,105
29
$82,487
122
$92,052
24
$31,963
7
$68,421
3
$35,087
APPLICATIONS WITHDRAWN
0
$0
9
$84,796
59
$93,422
3
$108,773
0
$0
1
$42,110
FILES CLOSED FOR INCOMPLETENESS
0
$0
0
$0
11
$76,436
0
$0
0
$0
1
$98,690
Aggregated Statistics For Year 2003 (Based on 4 partial tracts)
A) FHA, FSA/RHS & VA Home Purchase Loans
B) Conventional Home Purchase Loans
C) Refinancings
D) Home Improvement Loans
F) Non-occupant Loans on < 5 Family Dwellings (A B C & D)
Number
Average Value
Number
Average Value
Number
Average Value
Number
Average Value
Number
Average Value
LOANS ORIGINATED
7
$91,609
87
$95,217
426
$96,744
18
$45,130
16
$59,448
APPLICATIONS APPROVED, NOT ACCEPTED
1
$103,950
2
$77,765
69
$96,557
8
$34,394
2
$27,945
APPLICATIONS DENIED
0
$0
14
$68,440
146
$95,743
33
$13,528
2
$35,825
APPLICATIONS WITHDRAWN
0
$0
10
$85,200
99
$97,095
1
$19,740
1
$115,790
FILES CLOSED FOR INCOMPLETENESS
0
$0
2
$167,675
11
$108,484
0
$0
0
$0
Aggregated Statistics For Year 2002 (Based on 4 partial tracts)
A) FHA, FSA/RHS & VA Home Purchase Loans
B) Conventional Home Purchase Loans
C) Refinancings
D) Home Improvement Loans
F) Non-occupant Loans on < 5 Family Dwellings (A B C & D)
Number
Average Value
Number
Average Value
Number
Average Value
Number
Average Value
Number
Average Value
LOANS ORIGINATED
13
$80,857
96
$88,770
369
$95,093
23
$16,192
12
$52,458
APPLICATIONS APPROVED, NOT ACCEPTED
0
$0
8
$98,518
79
$89,521
3
$10,967
1
$110,530
APPLICATIONS DENIED
0
$0
21
$83,346
136
$90,085
11
$9,430
5
$47,896
APPLICATIONS WITHDRAWN
1
$113,160
7
$112,779
98
$102,239
3
$12,940
0
$0
FILES CLOSED FOR INCOMPLETENESS
0
$0
5
$60,264
14
$143,561
0
$0
0
$0
Aggregated Statistics For Year 2001 (Based on 4 partial tracts)
A) FHA, FSA/RHS & VA Home Purchase Loans
B) Conventional Home Purchase Loans
C) Refinancings
D) Home Improvement Loans
F) Non-occupant Loans on < 5 Family Dwellings (A B C & D)
Number
Average Value
Number
Average Value
Number
Average Value
Number
Average Value
Number
Average Value
LOANS ORIGINATED
6
$52,150
85
$98,341
294
$79,409
28
$23,848
9
$50,709
APPLICATIONS APPROVED, NOT ACCEPTED
0
$0
7
$76,729
31
$90,824
6
$11,278
0
$0
APPLICATIONS DENIED
1
$88,160
19
$65,170
113
$78,307
19
$19,889
0
$0
APPLICATIONS WITHDRAWN
3
$53,947
9
$126,753
80
$80,469
2
$8,380
1
$414,480
FILES CLOSED FOR INCOMPLETENESS
0
$0
3
$48,247
16
$114,606
0
$0
0
$0
Aggregated Statistics For Year 2000 (Based on 4 partial tracts)
A) FHA, FSA/RHS & VA Home Purchase Loans
B) Conventional Home Purchase Loans
C) Refinancings
D) Home Improvement Loans
F) Non-occupant Loans on < 5 Family Dwellings (A B C & D)
Number
Average Value
Number
Average Value
Number
Average Value
Number
Average Value
Number
Average Value
LOANS ORIGINATED
14
$62,684
95
$82,715
128
$72,311
31
$16,014
14
$39,094
APPLICATIONS APPROVED, NOT ACCEPTED
0
$0
5
$69,654
36
$64,539
9
$13,251
0
$0
APPLICATIONS DENIED
3
$64,380
21
$55,328
83
$63,254
27
$14,962
2
$38,115
APPLICATIONS WITHDRAWN
0
$0
9
$56,744
42
$69,910
3
$37,080
1
$75,000
FILES CLOSED FOR INCOMPLETENESS
1
$102,630
1
$118,420
5
$197,734
1
$9,330
0
$0
Aggregated Statistics For Year 1999 (Based on 2 partial tracts)
A) FHA, FSA/RHS & VA Home Purchase Loans
B) Conventional Home Purchase Loans
C) Refinancings
D) Home Improvement Loans
F) Non-occupant Loans on < 5 Family Dwellings (A B C & D)
Detailed PMIC statistics for the following Tracts:0106.00
, 0405.00
2002 - 2018 National Fire Incident Reporting System (NFIRS) incidents
According to the data from the years 2002 - 2018 the average number of fire incidents per year is 30. The highest number of reported fires - 59 took place in 2009, and the least - 4 in 2002. The data has an increasing trend.
When looking into fire subcategories, the most incidents belonged to: Structure Fires (48.3%), and Outside Fires (36.6%).
Fire incident types reported to NFIRS in Zip Code 45887

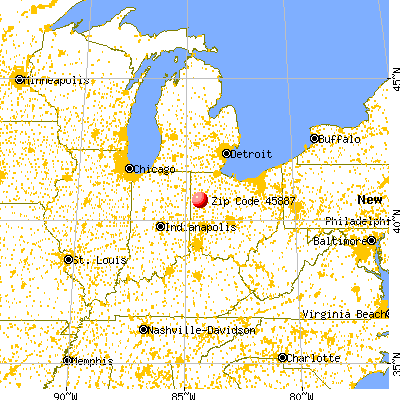


 Nearest zip codes: 45894, 45838, 45833, 45819, 45885, 45862.


 According to the data from the years 2002 - 2018 the average number of fire incidents per year is 30. The highest number of reported fires - 59 took place in 2009, and the least - 4 in 2002. The data has an increasing trend.
 When looking into fire subcategories, the most incidents belonged to: Structure Fires (48.3%), and Outside Fires (36.6%).