Estimated zip code population in 2022: 2,180 Zip code population in 2010: 2,246 Zip code population in 2000: 2,139
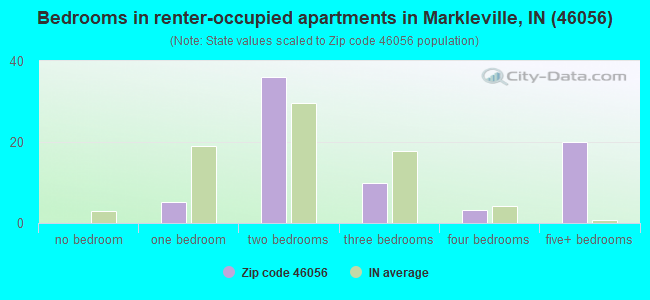
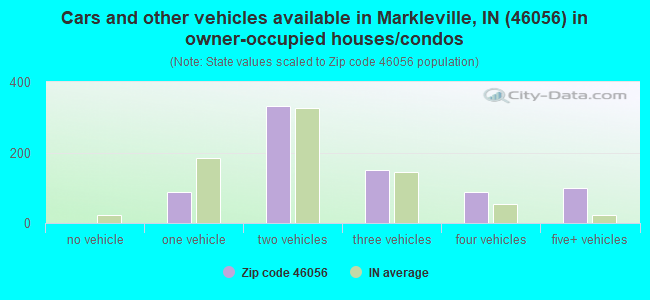
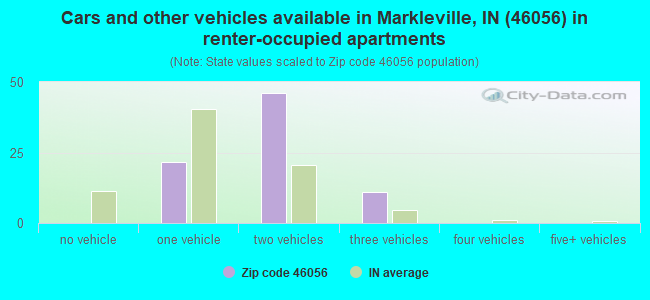
Houses and condos: 929 Renter-occupied apartments: 80
% of renters here:
10%
State:
29%
March 2022 cost of living index in zip code 46056: 86.6 (less than average, U.S. average is 100)
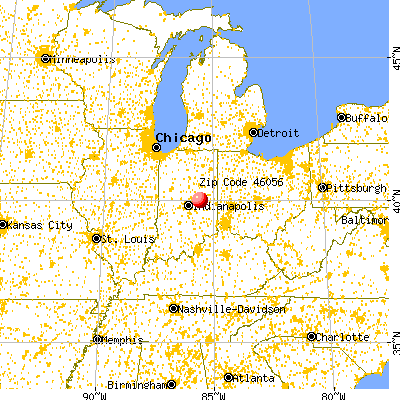
Land area: 23.2 sq. mi. Water area: 0.0 sq. mi.
Population density: 94 people per square mile
(very low).
OSM Map
General Map
Google Map
MSN Map
OSM Map
General Map
Google Map
MSN Map
OSM Map
General Map
Google Map
MSN Map
OSM Map
General Map
Google Map
MSN Map
Please wait while loading the map...
Real estate property taxes paid for housing units in 2022:
This zip code:
0.6% ($1,519)
Indiana:
0.7% ($1,467)
Median real estate property taxes paid for housing units with mortgages in 2022: $1,602 (0.6%) Median real estate property taxes paid for housing units with no mortgage in 2022: $1,424 (0.8%)
Business Search- 14 Million verified businesses
Males: 1,082
(49.6%)
Females: 1,098
(50.4%)
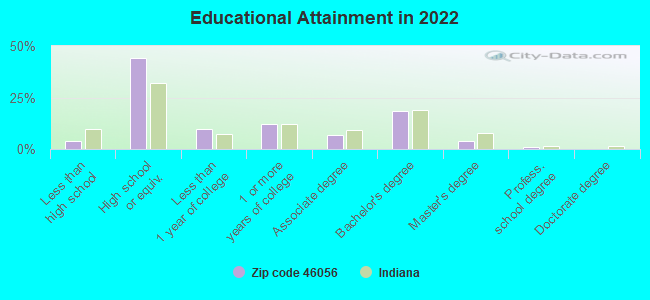
For population 25 years and over in 46056:
High school or higher: 95.3%
Bachelor's degree or higher: 23.1%
Graduate or professional degree: 4.8%
Unemployed: 4.7%
Mean travel time to work (commute): 29.0 minutes
For population 15 years and over in 46056:
Never married: 25.2%
Now married: 62.1%
Separated: 0.1%
Widowed: 0.6%
Divorced: 12.1%
Zip code 46056 compared to state average:
Black race population percentage significantly below state average.
Median age above state average.
Foreign-born population percentage significantly below state average.
Renting percentage significantly below state average.
Length of stay since moving in significantly above state average.
Number of college students significantly below state average.
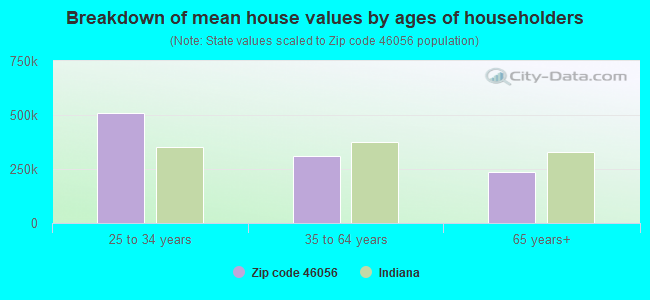
Estimated median house/condo value in 2022: $234,503
46056:
$234,503
Indiana:
$208,700
Median resident age:
This zip code:
45.8 years
Indiana median age:
38.2 years
Average household size:
This zip code:
2.6 people
Indiana:
2.4 people
Averages for the 2020 tax year for zip code 46056, filed in 2021:
Average Adjusted Gross Income (AGI) in 2020: $61,096 (Individual Income Tax Returns)
Here:
$61,096
State:
$64,978
Salary/wage: $56,767 (reported on 80.2% of returns)
Here:
$56,767
State:
$55,245
(% of AGI for various income ranges: 1003.9% for AGIs below $25k, 3484.3% for AGIs $25k-50k, 6739.3% for AGIs $50k-75k, 9577.8% for AGIs $75k-100k, 16365.4% for AGIs $100k-200k)
Taxable interest for individuals: $519 (reported on 26.4% of returns)
This zip code:
$519
Indiana:
$1,351
(% of AGI for various income ranges: 5.7% for AGIs below $25k, 15.2% for AGIs $25k-50k, 14.3% for AGIs $50k-75k, 27.8% for AGIs $75k-100k, 50.0% for AGIs $100k-200k)
Ordinary dividends: $2,306 (reported on 13.2% of returns)
Here:
$2,306
State:
$5,827
(% of AGI for various income ranges: 18.7% for AGIs below $25k, 13.0% for AGIs $25k-50k, 40.7% for AGIs $50k-75k, 36.7% for AGIs $75k-100k, 158.5% for AGIs $100k-200k)
Net capital gain/loss in AGI: +$4,825 (reported on 13.2% of returns)
Here:
+$4,825
State:
+$17,730
(% of AGI for various income ranges: 5.7% for AGIs below $25k, 13.5% for AGIs $25k-50k, 62.1% for AGIs $50k-75k, 493.1% for AGIs $100k-200k)
Profit/loss from business: +$12,795 (reported on 16.5% of returns)
Here:
+$12,795
State:
+$12,144
(% of AGI for various income ranges: 110.9% for AGIs below $25k, 137.4% for AGIs $25k-50k, 623.6% for AGIs $50k-75k, 857.7% for AGIs $100k-200k)
Taxable individual retirement arrangement distribution: $13,962 (reported on 6.6% of returns)
46056:
$13,962
Indiana:
$18,302
(% of AGI for various income ranges: 32.2% for AGIs below $25k, 98.7% for AGIs $25k-50k, 200.0% for AGIs $50k-75k, 412.3% for AGIs $100k-200k)
Total itemized deductions: $29,143 (reported on 5.8% of returns)
Here:
$29,143
State:
$35,601
(% of AGI for various income ranges: 327.4% for AGIs $25k-50k, 990.0% for AGIs $100k-200k)
Charity contributions: $7,840 (reported on 4.1% of returns)
Here:
$7,840
State:
$15,596
(% of AGI for various income ranges: 301.5% for AGIs $100k-200k)
Taxes paid: $6,429 (reported on 5.8% of returns)
46056:
$6,429
State:
$7,542
(% of AGI for various income ranges: 49.1% for AGIs $25k-50k, 259.2% for AGIs $100k-200k)
Earned income credit: $2,093 (reported on 12.4% of returns)
Here:
$2,093
State:
$2,298
(% of AGI for various income ranges: 77.4% for AGIs below $25k, 59.1% for AGIs $25k-50k)
Percentage of individuals using paid preparers for their 2020 taxes: 92.6%
Here:
93%
State:
94%
(% for various income ranges: 91.4% for AGIs below $25k, 93.3% for AGIs $25k-50k, 95.0% for AGIs $50k-75k, 91.7% for AGIs $75k-100k, 90.5% for AGIs $100k-200k, 100.0% for AGIs over 200k)
Averages for the 2012 tax year for zip code 46056, filed in 2013:
Average Adjusted Gross Income (AGI) in 2012: $52,322 (Individual Income Tax Returns)
Here:
$52,322
State:
$52,932
Salary/wage: $42,796 (reported on 86.0% of returns)
Here:
$42,796
State:
$45,173
(% of AGI for various income ranges: 58.9% for AGIs below $25k, 74.4% for AGIs $25k-50k, 76.6% for AGIs $50k-75k, 79.7% for AGIs $75k-100k, 62.8% for AGIs $100k-200k)
Taxable interest for individuals: $673 (reported on 28.9% of returns)
This zip code:
$673
Indiana:
$1,311
(% of AGI for various income ranges: 1.0% for AGIs below $25k, 0.3% for AGIs $25k-50k, 0.4% for AGIs $50k-75k, 0.1% for AGIs $75k-100k, 0.4% for AGIs $100k-200k)
Ordinary dividends: $1,218 (reported on 14.9% of returns)
Here:
$1,218
State:
$4,690
(% of AGI for various income ranges: 0.9% for AGIs below $25k, 0.2% for AGIs $25k-50k, 0.4% for AGIs $50k-75k, 0.3% for AGIs $75k-100k, 0.3% for AGIs $100k-200k)
Net capital gain/loss in AGI: +$7,173 (reported on 9.6% of returns)
Here:
+$7,173
State:
+$10,406
(% of AGI for various income ranges: 3.8% for AGIs $100k-200k)
Profit/loss from business: +$8,968 (reported on 16.7% of returns)
Here:
+$8,968
State:
+$11,105
(% of AGI for various income ranges: 7.0% for AGIs below $25k, 2.9% for AGIs $25k-50k, 2.0% for AGIs $50k-75k, 4.7% for AGIs $75k-100k, 1.3% for AGIs $100k-200k)
Taxable individual retirement arrangement distribution: $9,720 (reported on 8.8% of returns)
46056:
$9,720
Indiana:
$13,841
(% of AGI for various income ranges: 2.2% for AGIs below $25k, 2.7% for AGIs $25k-50k, 1.2% for AGIs $50k-75k, 3.9% for AGIs $75k-100k)
Total itemized deductions: $17,803 (18% of AGI, reported on 28.1% of returns)
Here:
$17,803
State:
$20,913
Here:
18.3% of AGI
State:
18.2% of AGI
(% of AGI for various income ranges: 8.6% for AGIs below $25k, 7.7% for AGIs $25k-50k, 9.1% for AGIs $50k-75k, 10.3% for AGIs $75k-100k, 10.5% for AGIs $100k-200k)
Charity contributions: $2,867 (reported on 21.1% of returns)
Here:
$2,867
State:
$4,697
(% of AGI for various income ranges: 1.1% for AGIs $25k-50k, 1.0% for AGIs $50k-75k, 2.0% for AGIs $75k-100k, 1.1% for AGIs $100k-200k)
Taxes paid: $6,425 (reported on 28.1% of returns)
46056:
$6,425
State:
$7,456
(% of AGI for various income ranges: 1.1% for AGIs below $25k, 1.9% for AGIs $25k-50k, 2.9% for AGIs $50k-75k, 3.7% for AGIs $75k-100k, 4.9% for AGIs $100k-200k)
Earned income credit: $2,117 (reported on 15.8% of returns)
Here:
$2,117
State:
$2,265
(% of AGI for various income ranges: 5.5% for AGIs below $25k, 1.0% for AGIs $25k-50k)
Percentage of individuals using paid preparers for their 2012 taxes: 52.6%
Here:
53%
State:
53%
(% for various income ranges: 48.8% for AGIs below $25k, 46.7% for AGIs $25k-50k, 58.8% for AGIs $50k-75k, 61.5% for AGIs $75k-100k, 61.5% for AGIs $100k-200k)
Averages for the 2004 tax year for zip code 46056, filed in 2005:
Average Adjusted Gross Income (AGI) in 2004: $44,007 (Individual Income Tax Returns)
Here:
$44,007
State:
$44,790
Salary/wage: $37,996 (reported on 90.1% of returns)
Here:
$37,996
State:
$39,615
(% of AGI for various income ranges: 119.3% for AGIs below $10k, 60.0% for AGIs $10k-25k, 73.0% for AGIs $25k-50k, 80.1% for AGIs $50k-75k, 89.6% for AGIs $75k-100k, 75.5% for AGIs over 100k)
Taxable interest for individuals: $723 (reported on 48.1% of returns)
This zip code:
$723
Indiana:
$1,535
(% of AGI for various income ranges: 2.6% for AGIs below $10k, 2.1% for AGIs $10k-25k, 1.1% for AGIs $25k-50k, 0.6% for AGIs $50k-75k, 0.3% for AGIs $75k-100k, 0.5% for AGIs over 100k)
Taxable dividends: $992 (reported on 21.2% of returns)
Here:
$992
State:
$2,998
(% of AGI for various income ranges: 0.4% for AGIs below $10k, 0.7% for AGIs $10k-25k, 0.9% for AGIs $25k-50k, 0.3% for AGIs $50k-75k, 0.0% for AGIs $75k-100k, 0.5% for AGIs over 100k)
Profit/loss from business: +$6,290 (reported on 13.0% of returns)
Here:
+$6,290
State:
+$10,071
(% of AGI for various income ranges: 11.5% for AGIs below $10k, 0.3% for AGIs $10k-25k, 2.7% for AGIs $25k-50k, 2.0% for AGIs $50k-75k, 1.1% for AGIs $75k-100k, 1.5% for AGIs over 100k)
IRA payment deduction: $1,933 (reported on 1.3% of returns)
46056:
$1,933
Indiana:
$2,840
Total itemized deductions: $14,975 (21% of AGI, reported on 32.6% of returns)
Here:
$14,975
State:
$17,065
Here:
20.9% of AGI
State:
19.5% of AGI
(% of AGI for various income ranges: 6.0% for AGIs $10k-25k, 9.8% for AGIs $25k-50k, 12.3% for AGIs $50k-75k, 12.6% for AGIs $75k-100k, 12.4% for AGIs over 100k)
Charity contributions deductions: $2,314 (3% of AGI, reported on 23.4% of returns)
Here:
$2,314
State:
$3,550
Here:
3.0% of AGI
State:
3.8% of AGI
(% of AGI for various income ranges: 0.3% for AGIs $10k-25k, 0.9% for AGIs $25k-50k, 1.1% for AGIs $50k-75k, 1.5% for AGIs $75k-100k, 1.9% for AGIs over 100k)
Total tax: $5,136 (reported on 82.5% of returns)
46056:
$5,136
State:
$6,914
(% of AGI for various income ranges: 3.1% for AGIs below $10k, 3.9% for AGIs $10k-25k, 6.7% for AGIs $25k-50k, 8.8% for AGIs $50k-75k, 10.3% for AGIs $75k-100k, 15.8% for AGIs over 100k)
Earned income credit: $1,508 (reported on 11.1% of returns)
Here:
$1,508
State:
$1,685
Percentage of individuals using paid preparers for their 2004 taxes: 59.0%
Here:
59%
State:
59%
(% for various income ranges: 46.3% for AGIs below $10k, 58.2% for AGIs $10k-25k, 58.5% for AGIs $25k-50k, 64.7% for AGIs $50k-75k, 62.6% for AGIs $75k-100k, 69.1% for AGIs over 100k)
Household received Food Stamps/SNAP in the past 12 months: 69 Household did not receive Food Stamps/SNAP in the past 12 months: 769
Women who had a birth in the past 12 months: 4 (2 now married, 1 unmarried) Women who did not have a birth in the past 12 months: 411 (158 now married, 252 unmarried)
Housing units in zip code 46056 with a mortgage: 517 (65 second mortgage, 66 both second mortgage and home equity loan) Houses without a mortgage: 39
Median monthly owner costs for units with a mortgage: $1,175 Median monthly owner costs for units without a mortgage: $442
Residents with income below the poverty level in 2022:
This zip code:
4.7%
Whole state:
12.6%
Residents with income below 50% of the poverty level in 2022:
This zip code:
1.8%
Whole state:
6.3%
Median number of rooms in houses and condos:
Here:
6.9
State:
6.6
Median number of rooms in apartments:
Here:
5.3
State:
4.3
Notable locations in this zip code not listed on our city pages
Size of family households: 432 2-persons, 63 3-persons, 152 4-persons, 37 5-persons, 16 6-persons, 11 7-or-more-persons
Size of nonfamily households: 79 1-person, 17 2-persons, 25 3-persons
262 married couples with children.
154 single-parent households (27 men, 127 women).
98.6% of residents of 46056 zip code speak English at home.
0.7% of residents speak Spanish at home (87% very well, 13% well).
Foreign born population: 5 (0.3%) (41.2% of them are naturalized citizens)
This zip code:
0.3%
Whole state:
6.1%
60%Honduras
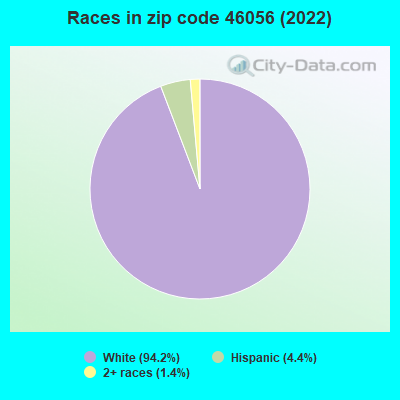
21%English
15%German
15%Irish
14%American
4%British
3%French
2%Dutch
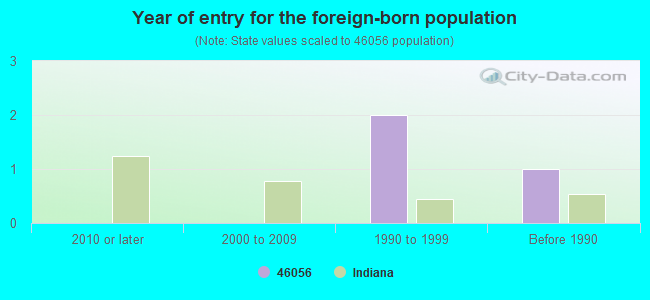
Year of entry for the foreign-born population
02010 or later
02000 to 2009
21990 to 1999
1Before 1990
Facilities with environmental interests located in this zip code:
ADM AG ONE COOPERATIVE EMPORIA (1838 EAST US 36 in MARKLEVILLE, IN)
AIR MAJOR (AIRS/AFS) ENFORCEMENT/COMPLIANCE ACTIVITY (Integrated Compliance Information System) STATE MASTER (Indiana facility tracking) - CRTK-6824, EPCRA Business SIC classification: GRAIN AND FIELD BEANS; FARM SUPPLIES
AMOCO FERTILIZER PLT (E OF MARKLEVILLE ON HWY 3 in MARKLEVILLE, IN)
STATE MASTER (Indiana facility tracking) (Resource Conservation and Recovery Act (tracking hazardous waste))
Housing units lacking complete kitchen facilities: 4.1%
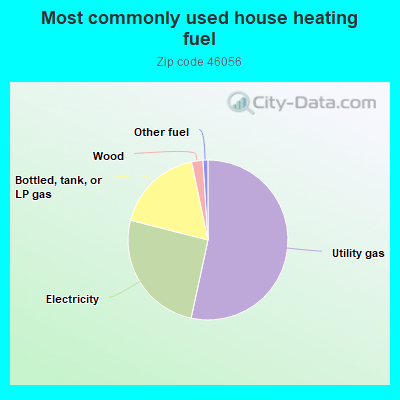
53.6%Utility gas
25.7%Electricity
17.8%Bottled, tank, or LP gas
2.3%Wood
1.0%Other fuel
Population in 1990: 2,957.
Place of birth for U.S.-born residents:
This state: 1,823
Northeast: 73
Midwest: 75
South: 166
West: 16
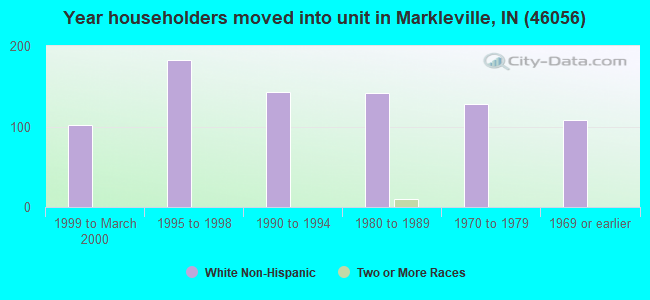
69% of the 46056 zip code residents lived in the same house 5 years ago. Out of people who lived in different houses, 80% lived in this county. Out of people who lived in different counties, 50% lived in Indiana.
95% of the 46056 zip code residents lived in the same house 1 year ago. Out of people who lived in different houses, 26% moved from this county. Out of people who lived in different houses, 50% moved from different county within same state. Out of people who lived in different houses, 31% moved from different state.
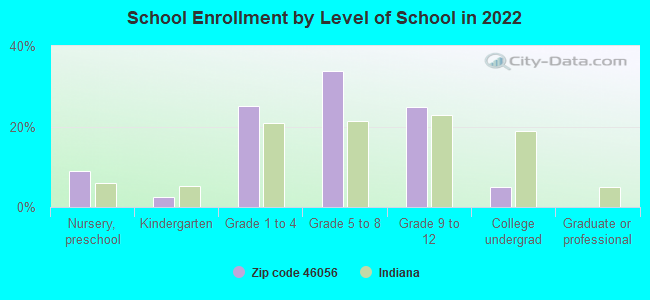
Private vs. public school enrollment:
Students in private schools in grades 1 to 8 (elementary and middle school):
Here:
0.0%
Indiana:
14.9%
Students in private schools in grades 9 to 12 (high school): 1
Here:
1.5%
Indiana:
11.4%
Students in private undergraduate colleges: 6
Here:
26.8%
Indiana:
22.3%
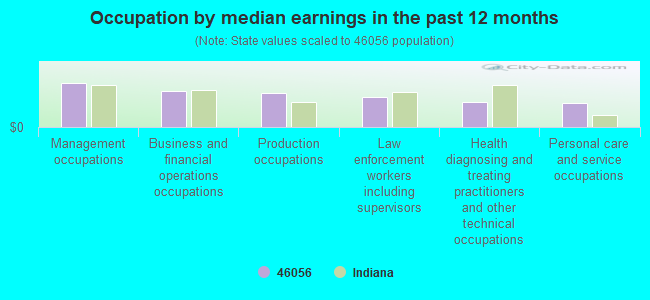
Occupation by median earnings in the past 12 months ($)
106,107Management occupations
87,971Business and financial operations occupations
80,891Production occupations
73,533Law enforcement workers including supervisors
60,066Health diagnosing and treating practitioners and other technical occupations
58,865Personal care and service occupations
Top industries in this zip code by the number of employees in 2005:
Construction: Poured Concrete Foundation and Structure Contractors (20-49 employees: 1 establishment, 1-4 employees: 4 establishments)
Construction: New Single-Family Housing Construction (except Operative Builders) (10-19: 1, 1-4: 1)
Administrative and Support and Waste Management and Remediation Services: Landscaping Services (10-19: 1, 1-4: 1)
Construction: Plumbing, Heating, and Air-Conditioning Contractors (5-9: 1, 1-4: 2)
Construction: Roofing Contractors (5-9: 1)
Construction: Masonry Contractors (5-9: 1)
Other Services (except Public Administration): Religious Organizations (5-9: 1)
Home Mortgage Disclosure Act Aggregated Statistics For Year 2009 (Based on 2 partial tracts)
A) FHA, FSA/RHS & VA Home Purchase Loans
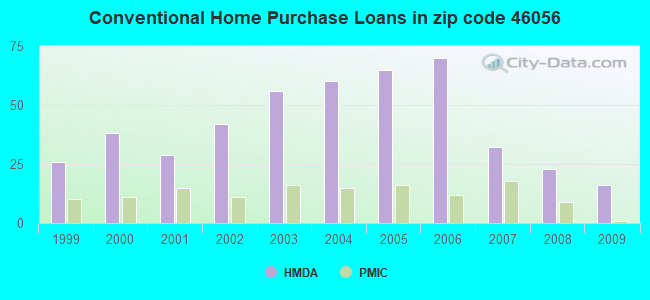
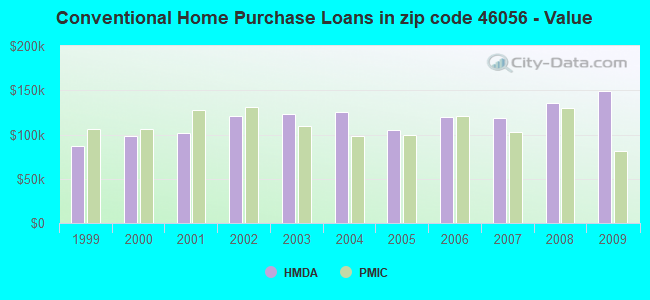
B) Conventional Home Purchase Loans
C) Refinancings
D) Home Improvement Loans
F) Non-occupant Loans on < 5 Family Dwellings (A B C & D)
G) Loans On Manufactured Home Dwelling (A B C & D)
Number
Average Value
Number
Average Value
Number
Average Value
Number
Average Value
Number
Average Value
Number
Average Value
LOANS ORIGINATED
23
$131,098
16
$149,495
109
$137,405
10
$23,671
5
$115,426
3
$92,053
APPLICATIONS APPROVED, NOT ACCEPTED
0
$0
1
$225,440
8
$139,350
0
$0
0
$0
0
$0
APPLICATIONS DENIED
5
$112,044
3
$95,060
44
$129,577
6
$15,217
1
$120,610
2
$80,595
APPLICATIONS WITHDRAWN
3
$165,323
1
$450,880
23
$138,253
0
$0
0
$0
0
$0
FILES CLOSED FOR INCOMPLETENESS
2
$153,300
0
$0
1
$264,890
0
$0
0
$0
0
$0
Aggregated Statistics For Year 2008 (Based on 2 partial tracts)
A) FHA, FSA/RHS & VA Home Purchase Loans
B) Conventional Home Purchase Loans
C) Refinancings
D) Home Improvement Loans
F) Non-occupant Loans on < 5 Family Dwellings (A B C & D)
G) Loans On Manufactured Home Dwelling (A B C & D)
Number
Average Value
Number
Average Value
Number
Average Value
Number
Average Value
Number
Average Value
Number
Average Value
LOANS ORIGINATED
17
$127,108
23
$135,166
60
$115,726
3
$56,737
1
$210,790
7
$86,956
APPLICATIONS APPROVED, NOT ACCEPTED
1
$123,990
3
$161,567
6
$147,475
3
$9,393
0
$0
1
$75,520
APPLICATIONS DENIED
1
$103,700
5
$84,314
45
$118,657
11
$34,738
1
$3,380
2
$134,700
APPLICATIONS WITHDRAWN
2
$116,665
1
$54,110
19
$136,747
1
$67,630
0
$0
2
$119,485
FILES CLOSED FOR INCOMPLETENESS
2
$170,770
1
$101,450
3
$172,460
0
$0
0
$0
0
$0
Aggregated Statistics For Year 2007 (Based on 2 partial tracts)
A) FHA, FSA/RHS & VA Home Purchase Loans
B) Conventional Home Purchase Loans
C) Refinancings
D) Home Improvement Loans
F) Non-occupant Loans on < 5 Family Dwellings (A B C & D)
G) Loans On Manufactured Home Dwelling (A B C & D)
Number
Average Value
Number
Average Value
Number
Average Value
Number
Average Value
Number
Average Value
Number
Average Value
LOANS ORIGINATED
7
$88,566
32
$118,673
67
$118,524
6
$38,325
5
$122,864
3
$53,353
APPLICATIONS APPROVED, NOT ACCEPTED
0
$0
6
$60,305
18
$133,761
2
$36,635
3
$47,343
0
$0
APPLICATIONS DENIED
5
$97,840
7
$77,294
63
$130,165
12
$55,139
0
$0
3
$96,187
APPLICATIONS WITHDRAWN
2
$77,775
2
$105,955
29
$108,794
0
$0
1
$214,170
2
$90,740
FILES CLOSED FOR INCOMPLETENESS
0
$0
0
$0
6
$153,863
0
$0
0
$0
0
$0
Aggregated Statistics For Year 2006 (Based on 2 partial tracts)
A) FHA, FSA/RHS & VA Home Purchase Loans
B) Conventional Home Purchase Loans
C) Refinancings
D) Home Improvement Loans
F) Non-occupant Loans on < 5 Family Dwellings (A B C & D)
G) Loans On Manufactured Home Dwelling (A B C & D)
Number
Average Value
Number
Average Value
Number
Average Value
Number
Average Value
Number
Average Value
Number
Average Value
LOANS ORIGINATED
10
$128,388
70
$119,499
63
$105,116
11
$38,632
2
$86,230
1
$129,630
APPLICATIONS APPROVED, NOT ACCEPTED
0
$0
15
$102,049
14
$81,400
3
$23,297
2
$45,650
1
$123,990
APPLICATIONS DENIED
0
$0
16
$89,119
65
$111,610
15
$58,239
12
$65,472
3
$86,793
APPLICATIONS WITHDRAWN
8
$137,941
16
$101,659
24
$113,706
3
$24,423
3
$71,767
1
$209,660
FILES CLOSED FOR INCOMPLETENESS
0
$0
0
$0
6
$140,712
1
$10,140
0
$0
0
$0
Aggregated Statistics For Year 2005 (Based on 2 partial tracts)
A) FHA, FSA/RHS & VA Home Purchase Loans
B) Conventional Home Purchase Loans
C) Refinancings
D) Home Improvement Loans
F) Non-occupant Loans on < 5 Family Dwellings (A B C & D)
G) Loans On Manufactured Home Dwelling (A B C & D)
Number
Average Value
Number
Average Value
Number
Average Value
Number
Average Value
Number
Average Value
Number
Average Value
LOANS ORIGINATED
24
$112,062
65
$104,604
130
$99,991
11
$28,795
8
$72,000
15
$86,118
APPLICATIONS APPROVED, NOT ACCEPTED
0
$0
8
$85,245
18
$91,679
5
$29,984
0
$0
0
$0
APPLICATIONS DENIED
5
$94,684
15
$81,083
86
$96,625
12
$21,417
1
$57,490
10
$75,184
APPLICATIONS WITHDRAWN
0
$0
3
$49,973
62
$106,793
8
$97,502
5
$77,326
2
$61,995
FILES CLOSED FOR INCOMPLETENESS
2
$96,940
2
$70,450
28
$117,068
0
$0
0
$0
2
$82,285
Aggregated Statistics For Year 2004 (Based on 2 partial tracts)
A) FHA, FSA/RHS & VA Home Purchase Loans
B) Conventional Home Purchase Loans
C) Refinancings
D) Home Improvement Loans
F) Non-occupant Loans on < 5 Family Dwellings (A B C & D)
G) Loans On Manufactured Home Dwelling (A B C & D)
Number
Average Value
Number
Average Value
Number
Average Value
Number
Average Value
Number
Average Value
Number
Average Value
LOANS ORIGINATED
15
$88,973
60
$124,969
123
$114,846
17
$24,997
5
$67,632
5
$66,730
APPLICATIONS APPROVED, NOT ACCEPTED
2
$149,920
6
$168,705
19
$95,515
2
$109,900
0
$0
3
$89,800
APPLICATIONS DENIED
3
$105,580
12
$91,867
72
$114,333
11
$45,805
1
$116,100
10
$72,592
APPLICATIONS WITHDRAWN
0
$0
2
$349,995
36
$103,483
0
$0
2
$349,995
1
$95,810
FILES CLOSED FOR INCOMPLETENESS
0
$0
1
$55,230
11
$131,063
0
$0
1
$55,230
1
$100,320
Aggregated Statistics For Year 2003 (Based on 2 partial tracts)
A) FHA, FSA/RHS & VA Home Purchase Loans
B) Conventional Home Purchase Loans
C) Refinancings
D) Home Improvement Loans
F) Non-occupant Loans on < 5 Family Dwellings (A B C & D)
Number
Average Value
Number
Average Value
Number
Average Value
Number
Average Value
Number
Average Value
LOANS ORIGINATED
16
$101,237
56
$123,549
268
$110,037
7
$20,129
11
$60,869
APPLICATIONS APPROVED, NOT ACCEPTED
0
$0
10
$154,088
35
$127,825
2
$9,020
0
$0
APPLICATIONS DENIED
6
$98,442
8
$123,992
77
$106,674
8
$37,761
1
$204,020
APPLICATIONS WITHDRAWN
1
$121,740
9
$95,938
44
$117,178
3
$30,433
2
$85,665
FILES CLOSED FOR INCOMPLETENESS
1
$121,740
1
$122,860
17
$105,758
0
$0
0
$0
Aggregated Statistics For Year 2002 (Based on 2 partial tracts)
A) FHA, FSA/RHS & VA Home Purchase Loans
B) Conventional Home Purchase Loans
C) Refinancings
D) Home Improvement Loans
F) Non-occupant Loans on < 5 Family Dwellings (A B C & D)
Number
Average Value
Number
Average Value
Number
Average Value
Number
Average Value
Number
Average Value
LOANS ORIGINATED
17
$93,756
42
$120,503
201
$108,890
17
$26,986
10
$62,560
APPLICATIONS APPROVED, NOT ACCEPTED
0
$0
3
$91,680
38
$111,919
5
$20,966
0
$0
APPLICATIONS DENIED
2
$100,320
8
$70,309
77
$91,157
7
$14,010
2
$123,430
APPLICATIONS WITHDRAWN
0
$0
5
$71,690
36
$110,152
1
$67,630
0
$0
FILES CLOSED FOR INCOMPLETENESS
0
$0
1
$139,770
14
$125,280
0
$0
1
$169,080
Aggregated Statistics For Year 2001 (Based on 2 partial tracts)
A) FHA, FSA/RHS & VA Home Purchase Loans
B) Conventional Home Purchase Loans
C) Refinancings
D) Home Improvement Loans
F) Non-occupant Loans on < 5 Family Dwellings (A B C & D)
Number
Average Value
Number
Average Value
Number
Average Value
Number
Average Value
Number
Average Value
LOANS ORIGINATED
14
$96,214
29
$102,109
203
$102,675
23
$20,437
6
$57,863
APPLICATIONS APPROVED, NOT ACCEPTED
1
$113,850
5
$77,326
32
$92,642
10
$46,441
1
$72,140
APPLICATIONS DENIED
1
$130,760
25
$144,913
80
$98,404
15
$30,435
0
$0
APPLICATIONS WITHDRAWN
2
$85,105
5
$94,684
38
$95,100
5
$41,480
0
$0
FILES CLOSED FOR INCOMPLETENESS
0
$0
2
$98,630
10
$92,881
0
$0
0
$0
Aggregated Statistics For Year 2000 (Based on 2 partial tracts)
A) FHA, FSA/RHS & VA Home Purchase Loans
B) Conventional Home Purchase Loans
C) Refinancings
D) Home Improvement Loans
F) Non-occupant Loans on < 5 Family Dwellings (A B C & D)
Number
Average Value
Number
Average Value
Number
Average Value
Number
Average Value
Number
Average Value
LOANS ORIGINATED
14
$61,271
38
$98,096
56
$79,367
30
$24,047
2
$80,030
APPLICATIONS APPROVED, NOT ACCEPTED
0
$0
6
$58,990
20
$89,162
8
$29,025
1
$102,580
APPLICATIONS DENIED
0
$0
20
$73,662
39
$74,048
17
$21,351
0
$0
APPLICATIONS WITHDRAWN
6
$105,957
2
$100,885
16
$66,646
2
$5,635
0
$0
FILES CLOSED FOR INCOMPLETENESS
0
$0
5
$81,158
14
$58,292
0
$0
0
$0
Aggregated Statistics For Year 1999 (Based on 1 partial tract)
A) FHA, FSA/RHS & VA Home Purchase Loans
B) Conventional Home Purchase Loans
C) Refinancings
D) Home Improvement Loans
F) Non-occupant Loans on < 5 Family Dwellings (A B C & D)
Detailed PMIC statistics for the following Tracts:0114.00
2002 - 2018 National Fire Incident Reporting System (NFIRS) incidents
According to the data from the years 2002 - 2018 the average number of fires per year is 14. The highest number of fire incidents - 23 took place in 2007, and the least - 2 in 2014. The data has a declining trend.
When looking into fire subcategories, the most incidents belonged to: Outside Fires (48.5%), and Structure Fires (33.9%).
Fire incident types reported to NFIRS in Zip Code 46056


 Nearest zip codes: 46186, 47384, 46017, 46013, 47351, 47356.


 According to the data from the years 2002 - 2018 the average number of fires per year is 14. The highest number of fire incidents - 23 took place in 2007, and the least - 2 in 2014. The data has a declining trend.
 When looking into fire subcategories, the most incidents belonged to: Outside Fires (48.5%), and Structure Fires (33.9%).