Estimated zip code population in 2022: 2,298 Zip code population in 2010: 2,000 Zip code population in 2000: 1,919
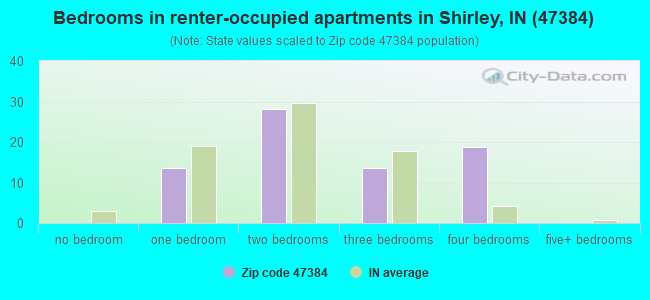
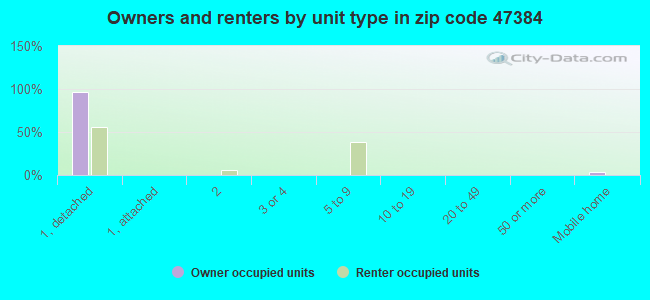
Houses and condos: 974 Renter-occupied apartments: 73
% of renters here:
9%
State:
29%
March 2022 cost of living index in zip code 47384: 84.1 (less than average, U.S. average is 100)
Land area: 32.8 sq. mi. Water area: 0.0 sq. mi.
Population density: 70 people per square mile
(very low).
OSM Map
General Map
Google Map
MSN Map
OSM Map
General Map
Google Map
MSN Map
OSM Map
General Map
Google Map
MSN Map
OSM Map
General Map
Google Map
MSN Map
Please wait while loading the map...
Real estate property taxes paid for housing units in 2022:
This zip code:
0.8% ($1,089)
Indiana:
0.7% ($1,467)
Median real estate property taxes paid for housing units with mortgages in 2022: $1,038 (0.7%) Median real estate property taxes paid for housing units with no mortgage in 2022: $1,194 (0.9%)
Business Search- 14 Million verified businesses
Males: 1,199
(52.2%)
Females: 1,099
(47.8%)
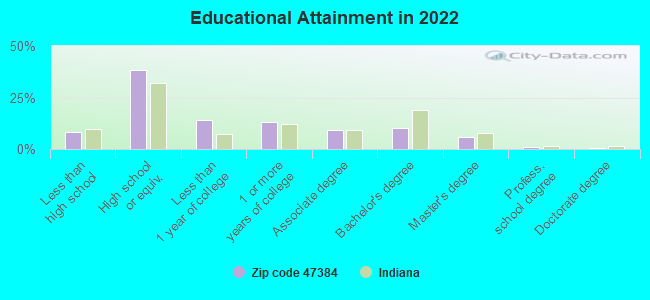
For population 25 years and over in 47384:
High school or higher: 90.9%
Bachelor's degree or higher: 16.9%
Graduate or professional degree: 7.0%
Unemployed: 5.9%
Mean travel time to work (commute): 33.5 minutes
For population 15 years and over in 47384:
Never married: 26.8%
Now married: 54.1%
Separated: 0.6%
Widowed: 7.5%
Divorced: 10.9%
Zip code 47384 compared to state average:
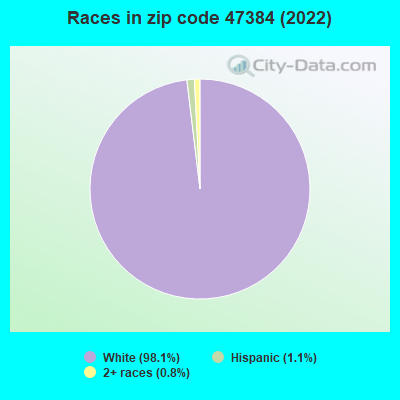
Black race population percentage significantly below state average.
Hispanic race population percentage significantly below state average.
Foreign-born population percentage significantly below state average.
Renting percentage significantly below state average.
Length of stay since moving in significantly above state average.
House age above state average.
Number of college students below state average.
Percentage of population with a bachelor's degree or higher below state average.
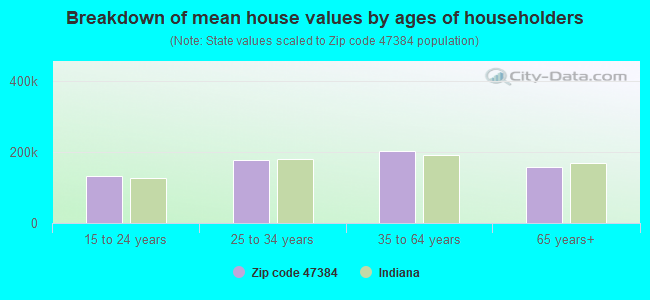
Estimated median house/condo value in 2022: $141,407
47384:
$141,407
Indiana:
$208,700
Median resident age:
This zip code:
38.6 years
Indiana median age:
38.2 years
Average household size:
This zip code:
2.8 people
Indiana:
2.4 people
Averages for the 2020 tax year for zip code 47384, filed in 2021:
Average Adjusted Gross Income (AGI) in 2020: $57,604 (Individual Income Tax Returns)
Here:
$57,604
State:
$64,978
Salary/wage: $51,441 (reported on 83.5% of returns)
Here:
$51,441
State:
$55,245
(% of AGI for various income ranges: 932.9% for AGIs below $25k, 3405.7% for AGIs $25k-50k, 6500.0% for AGIs $50k-75k, 10308.8% for AGIs $75k-100k, 17586.7% for AGIs $100k-200k)
Taxable interest for individuals: $589 (reported on 18.6% of returns)
This zip code:
$589
Indiana:
$1,351
(% of AGI for various income ranges: 13.8% for AGIs below $25k, 8.7% for AGIs $25k-50k, 23.3% for AGIs $50k-75k, 17.5% for AGIs $75k-100k, 16.7% for AGIs $100k-200k)
Ordinary dividends: $2,164 (reported on 11.3% of returns)
Here:
$2,164
State:
$5,827
(% of AGI for various income ranges: 9.5% for AGIs below $25k, 20.9% for AGIs $25k-50k, 42.5% for AGIs $50k-75k, 132.2% for AGIs $100k-200k)
Net capital gain/loss in AGI: +$4,836 (reported on 11.3% of returns)
Here:
+$4,836
State:
+$17,730
(% of AGI for various income ranges: 10.9% for AGIs $25k-50k, 65.0% for AGIs $50k-75k, 476.7% for AGIs $100k-200k)
Profit/loss from business: +$6,850 (reported on 10.3% of returns)
Here:
+$6,850
State:
+$12,144
(% of AGI for various income ranges: 67.6% for AGIs below $25k, 3.5% for AGIs $25k-50k, 242.5% for AGIs $50k-75k, 271.1% for AGIs $100k-200k)
Taxable individual retirement arrangement distribution: $12,443 (reported on 7.2% of returns)
47384:
$12,443
Indiana:
$18,302
(% of AGI for various income ranges: 189.1% for AGIs $25k-50k, 484.4% for AGIs $100k-200k)
Total itemized deductions: $27,900 (reported on 2.1% of returns)
Here:
$27,900
State:
$35,601
(% of AGI for various income ranges: 465.0% for AGIs $50k-75k)
Taxes paid: $6,950 (reported on 2.1% of returns)
47384:
$6,950
State:
$7,542
(% of AGI for various income ranges: 60.4% for AGIs $25k-50k)
Earned income credit: $1,950 (reported on 14.4% of returns)
Here:
$1,950
State:
$2,298
(% of AGI for various income ranges: 65.7% for AGIs below $25k, 58.7% for AGIs $25k-50k)
Percentage of individuals using paid preparers for their 2020 taxes: 95.9%
Here:
96%
State:
94%
(% for various income ranges: 92.6% for AGIs below $25k, 100.0% for AGIs $25k-50k, 94.1% for AGIs $50k-75k, 100.0% for AGIs $75k-100k, 93.3% for AGIs $100k-200k)
Averages for the 2012 tax year for zip code 47384, filed in 2013:
Average Adjusted Gross Income (AGI) in 2012: $49,157 (Individual Income Tax Returns)
Here:
$49,157
State:
$52,932
Salary/wage: $40,418 (reported on 85.1% of returns)
Here:
$40,418
State:
$45,173
(% of AGI for various income ranges: 63.4% for AGIs below $25k, 77.2% for AGIs $25k-50k, 76.8% for AGIs $50k-75k, 82.1% for AGIs $75k-100k, 58.5% for AGIs $100k-200k)
Taxable interest for individuals: $762 (reported on 27.7% of returns)
This zip code:
$762
Indiana:
$1,311
(% of AGI for various income ranges: 1.6% for AGIs below $25k, 0.7% for AGIs $25k-50k, 0.2% for AGIs $50k-75k, 0.2% for AGIs $75k-100k, 0.2% for AGIs $100k-200k)
Ordinary dividends: $1,133 (reported on 12.8% of returns)
Here:
$1,133
State:
$4,690
(% of AGI for various income ranges: 0.2% for AGIs below $25k, 0.8% for AGIs $25k-50k, 0.2% for AGIs $75k-100k, 0.2% for AGIs $100k-200k)
Net capital gain/loss in AGI: +$1,588 (reported on 8.5% of returns)
Here:
+$1,588
State:
+$10,406
Profit/loss from business: +$12,860 (reported on 16.0% of returns)
Here:
+$12,860
State:
+$11,105
(% of AGI for various income ranges: 6.0% for AGIs below $25k, 3.0% for AGIs $25k-50k, 5.7% for AGIs $75k-100k, 5.7% for AGIs $100k-200k)
Taxable individual retirement arrangement distribution: $7,786 (reported on 7.4% of returns)
47384:
$7,786
Indiana:
$13,841
Total itemized deductions: $16,892 (18% of AGI, reported on 25.5% of returns)
Here:
$16,892
State:
$20,913
Here:
18.1% of AGI
State:
18.2% of AGI
(% of AGI for various income ranges: 5.7% for AGIs below $25k, 7.8% for AGIs $25k-50k, 9.2% for AGIs $50k-75k, 9.7% for AGIs $75k-100k, 9.5% for AGIs $100k-200k)
Charity contributions: $3,176 (reported on 18.1% of returns)
Here:
$3,176
State:
$4,697
(% of AGI for various income ranges: 1.1% for AGIs below $25k, 0.8% for AGIs $25k-50k, 1.4% for AGIs $50k-75k, 1.2% for AGIs $75k-100k, 1.3% for AGIs $100k-200k)
Taxes paid: $5,521 (reported on 25.5% of returns)
47384:
$5,521
State:
$7,456
(% of AGI for various income ranges: 1.1% for AGIs below $25k, 1.7% for AGIs $25k-50k, 2.5% for AGIs $50k-75k, 3.0% for AGIs $75k-100k, 4.2% for AGIs $100k-200k)
Earned income credit: $2,400 (reported on 19.1% of returns)
Here:
$2,400
State:
$2,265
(% of AGI for various income ranges: 6.7% for AGIs below $25k, 1.4% for AGIs $25k-50k)
Percentage of individuals using paid preparers for their 2012 taxes: 57.4%
Here:
57%
State:
53%
(% for various income ranges: 51.4% for AGIs below $25k, 55.6% for AGIs $25k-50k, 61.5% for AGIs $50k-75k, 66.7% for AGIs $75k-100k, 70.0% for AGIs $100k-200k)
Averages for the 2004 tax year for zip code 47384, filed in 2005:
Average Adjusted Gross Income (AGI) in 2004: $40,487 (Individual Income Tax Returns)
Here:
$40,487
State:
$44,790
Salary/wage: $36,118 (reported on 89.1% of returns)
Here:
$36,118
State:
$39,615
(% of AGI for various income ranges: 69.2% for AGIs below $10k, 65.3% for AGIs $10k-25k, 79.8% for AGIs $25k-50k, 81.8% for AGIs $50k-75k, 87.7% for AGIs $75k-100k, 73.9% for AGIs over 100k)
Taxable interest for individuals: $1,048 (reported on 43.1% of returns)
This zip code:
$1,048
Indiana:
$1,535
(% of AGI for various income ranges: 4.5% for AGIs below $10k, 2.6% for AGIs $10k-25k, 1.5% for AGIs $25k-50k, 1.1% for AGIs $50k-75k, 0.2% for AGIs $75k-100k, 0.3% for AGIs over 100k)
Taxable dividends: $936 (reported on 15.5% of returns)
Here:
$936
State:
$2,998
(% of AGI for various income ranges: 1.6% for AGIs below $10k, 0.4% for AGIs $10k-25k, 0.4% for AGIs $25k-50k, 0.2% for AGIs $50k-75k, 0.1% for AGIs $75k-100k, 0.9% for AGIs over 100k)
Net capital gain/loss: +$1,089 (reported on 11.1% of returns)
Here:
+$1,089
State:
+$8,619
(% of AGI for various income ranges: 1.1% for AGIs below $10k, -0.2% for AGIs $10k-25k, 0.2% for AGIs $25k-50k, 0.0% for AGIs $50k-75k, 0.6% for AGIs $75k-100k, 0.7% for AGIs over 100k)
Profit/loss from business: +$4,457 (reported on 14.0% of returns)
Here:
+$4,457
State:
+$10,071
(% of AGI for various income ranges: 1.1% for AGIs below $10k, 3.8% for AGIs $10k-25k, 2.5% for AGIs $25k-50k, 3.3% for AGIs $50k-75k, -1.9% for AGIs $75k-100k)
IRA payment deduction: $3,000 (reported on 1.5% of returns)
47384:
$3,000
Indiana:
$2,840
Total itemized deductions: $14,228 (21% of AGI, reported on 28.5% of returns)
Here:
$14,228
State:
$17,065
Here:
20.8% of AGI
State:
19.5% of AGI
(% of AGI for various income ranges: 6.6% for AGIs $10k-25k, 9.3% for AGIs $25k-50k, 10.6% for AGIs $50k-75k, 11.2% for AGIs $75k-100k, 11.6% for AGIs over 100k)
Charity contributions deductions: $2,401 (3% of AGI, reported on 21.1% of returns)
Here:
$2,401
State:
$3,550
Here:
3.3% of AGI
State:
3.8% of AGI
(% of AGI for various income ranges: 1.4% for AGIs $25k-50k, 1.5% for AGIs $50k-75k, 1.2% for AGIs $75k-100k, 1.6% for AGIs over 100k)
Total tax: $4,657 (reported on 77.8% of returns)
47384:
$4,657
State:
$6,914
(% of AGI for various income ranges: 2.3% for AGIs below $10k, 4.1% for AGIs $10k-25k, 6.2% for AGIs $25k-50k, 8.8% for AGIs $50k-75k, 10.5% for AGIs $75k-100k, 15.4% for AGIs over 100k)
Earned income credit: $1,470 (reported on 11.0% of returns)
Here:
$1,470
State:
$1,685
Percentage of individuals using paid preparers for their 2004 taxes: 64.7%
Here:
65%
State:
59%
(% for various income ranges: 55.9% for AGIs below $10k, 58.5% for AGIs $10k-25k, 68.0% for AGIs $25k-50k, 71.6% for AGIs $50k-75k, 69.7% for AGIs $75k-100k, 69.8% for AGIs over 100k)
Household received Food Stamps/SNAP in the past 12 months: 34 Household did not receive Food Stamps/SNAP in the past 12 months: 792
Women who had a birth in the past 12 months: 51 (12 now married, 34 unmarried) Women who did not have a birth in the past 12 months: 440 (203 now married, 237 unmarried)
Housing units in zip code 47384 with a mortgage: 430 (23 second mortgage, 5 home equity loan, 15 both second mortgage and home equity loan) Houses without a mortgage: 29
Median monthly owner costs for units with a mortgage: $1,137 Median monthly owner costs for units without a mortgage: $502
Residents with income below the poverty level in 2022:
This zip code:
11.7%
Whole state:
12.6%
Residents with income below 50% of the poverty level in 2022:
This zip code:
6.7%
Whole state:
6.3%
Median number of rooms in houses and condos:
Here:
6.8
State:
6.6
Median number of rooms in apartments:
Here:
5.5
State:
4.3
Notable locations in this zip code not listed on our city pages
Streams, rivers, and creeks: Owner Run (A), Hendricks Brook (B), Grant Run (C), Grain Creek (D), Oats Run (E), Corn Run (F), Mont Branch (G), Bench Run (H). Display/hide their locations on the map
Size of family households: 246 2-persons, 221 3-persons, 93 4-persons, 54 5-persons, 52 6-persons, 17 7-or-more-persons
Size of nonfamily households: 131 1-person, 12 2-persons
337 married couples with children.
137 single-parent households (82 men, 55 women).
98.3% of residents of 47384 zip code speak English at home.
0.5% of residents speak Spanish at home (67% very well, 17% well, 17% not well).
Foreign born population: 23 (1.0%) (100.0% of them are naturalized citizens)
This zip code:
1.0%
Whole state:
6.1%
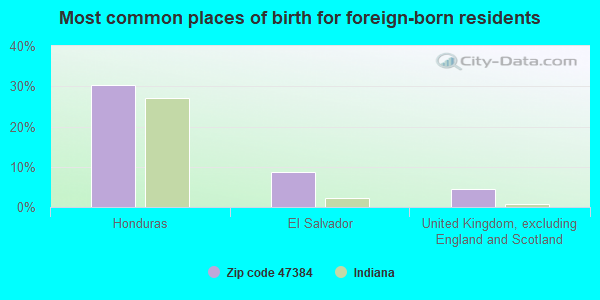
30%Honduras
9%El Salvador
4%United Kingdom, excluding England and Scotland
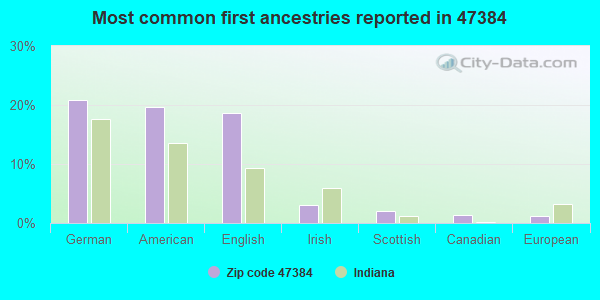
21%German
20%American
19%English
3%Irish
2%Scottish
1%Canadian
1%European
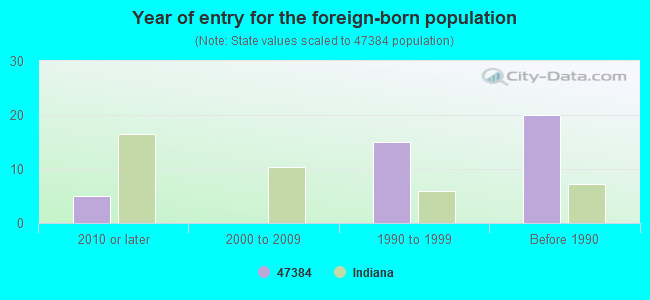
Year of entry for the foreign-born population
52010 or later
02000 to 2009
151990 to 1999
20Before 1990
Facilities with environmental interests located in this zip code:
SHIRLEY MUNICIPAL SEWAGE (COUNTY ROAD 650N 1/8 MI EAST in SHIRLEY, IN)
STATE MASTER (Indiana facility tracking) National Pollutant Discharge Elimination System NON-MAJOR (Tracking pollutant discharge elimination systems) - permit Business SIC classification: SEWERAGE SYSTEMS Organizations: DAVID RESLER CERT OPER (CONTACT/OPERATOR)
, SHIRLEY TOWN COUNCIL (CONTACT/OWNER)
Alternative names: SHIRLEY MUNICIPAL STP
METALS TECHNOLOGY CORPORATION (1102 WEST SOUTH STREET in SHIRLEY, IN)
STATE MASTER (Indiana facility tracking) Small Quantity Generators, between 100 kg and 1000 kg of hazardous waste/month (Resource Conservation and Recovery Act (tracking hazardous waste)) - notification
Housing units lacking complete plumbing facilities: 9.9% Housing units lacking complete kitchen facilities: 13.3%
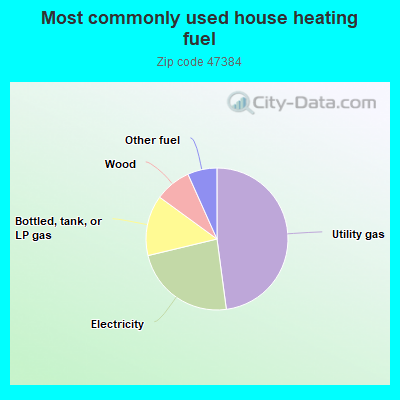
48.0%Utility gas
23.4%Electricity
13.8%Bottled, tank, or LP gas
8.3%Wood
6.7%Other fuel
Population in 1990: 2,292.
Place of birth for U.S.-born residents:
This state: 1,846
Northeast: 22
Midwest: 106
South: 212
West: 48
68% of the 47384 zip code residents lived in the same house 5 years ago. Out of people who lived in different houses, 52% lived in this county. Out of people who lived in different counties, 50% lived in Indiana.
94% of the 47384 zip code residents lived in the same house 1 year ago. Out of people who lived in different houses, 39% moved from this county. Out of people who lived in different houses, 65% moved from different county within same state.
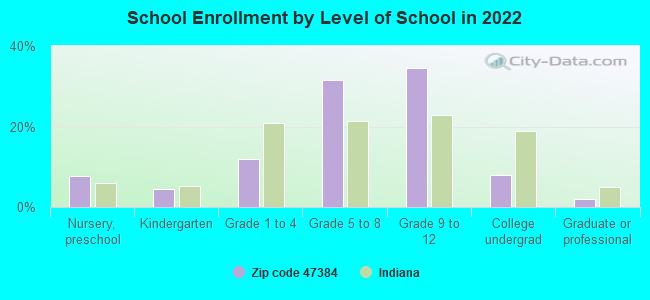
Private vs. public school enrollment:
Students in private schools in grades 1 to 8 (elementary and middle school): 14
Here:
5.5%
Indiana:
14.9%
Students in private schools in grades 9 to 12 (high school): 17
Here:
8.4%
Indiana:
11.4%
Students in private undergraduate colleges: 3
Here:
7.7%
Indiana:
22.3%
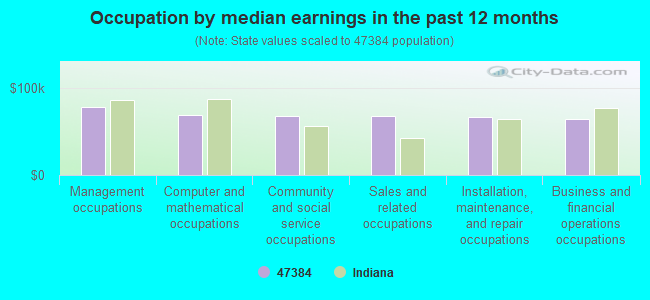
Occupation by median earnings in the past 12 months ($)
78,958Management occupations
69,716Computer and mathematical occupations
68,203Community and social service occupations
67,634Sales and related occupations
66,997Installation, maintenance, and repair occupations
64,786Business and financial operations occupations
Top industries in this zip code by the number of employees in 2005:
Health Care and Social Assistance: Home Health Care Services (10-19 employees: 1 establishment)
Accommodation and Food Services: Full-Service Restaurants (10-19: 1)
Other Services (except Public Administration): Religious Organizations (5-9: 1, 1-4: 2)
Finance and Insurance: Commercial Banking (5-9: 1)
Fatal accident statistics in 2014:
Fatal accident count: 1
Vehicles involved in fatal accidents: 2
Fatal accidents caused by drunken drivers: 0
Fatalities: 1
Persons involved in fatal accidents: 1
Pedestrians involved in fatal accidents: 1
Fatal accident statistics in 2011:
Fatal accident count: 1
Vehicles involved in fatal accidents: 1
Fatal accidents caused by drunken drivers: 0
Fatalities: 1
Persons involved in fatal accidents: 1
Pedestrians involved in fatal accidents: 0
2002 - 2018 National Fire Incident Reporting System (NFIRS) incidents
According to the data from the years 2002 - 2018 the average number of fire incidents per year is 12. The highest number of fire incidents - 29 took place in 2004, and the least - 0 in 2014. The data has a dropping trend.
When looking into fire subcategories, the most incidents belonged to: Structure Fires (43.6%), and Outside Fires (37.1%).
Fire incident types reported to NFIRS in Zip Code 47384


 Nearest zip codes: 47351, 46056, 47344, 46186, 46148, 46117.
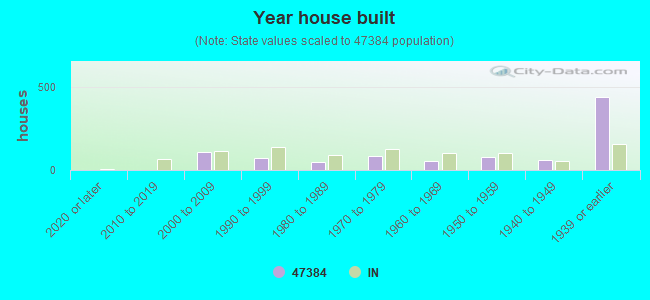


 According to the data from the years 2002 - 2018 the average number of fire incidents per year is 12. The highest number of fire incidents - 29 took place in 2004, and the least - 0 in 2014. The data has a dropping trend.
 When looking into fire subcategories, the most incidents belonged to: Structure Fires (43.6%), and Outside Fires (37.1%).