Estimated zip code population in 2022: 1,843 Zip code population in 2010: 1,696 Zip code population in 2000: 1,845
Houses and condos: 758 Renter-occupied apartments: 124
% of renters here:
17%
State:
29%
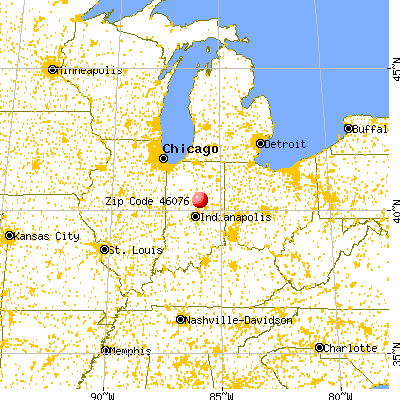
March 2022 cost of living index in zip code 46076: 85.0 (less than average, U.S. average is 100)
Land area: 44.4 sq. mi. Water area: 0.0 sq. mi.
Population density: 42 people per square mile
(very low).
OSM Map
General Map
Google Map
MSN Map
OSM Map
General Map
Google Map
MSN Map
OSM Map
General Map
Google Map
MSN Map
OSM Map
General Map
Google Map
MSN Map
Please wait while loading the map...
Real estate property taxes paid for housing units in 2022:
This zip code:
0.7% ($790)
Indiana:
0.7% ($1,467)
Median real estate property taxes paid for housing units with mortgages in 2022: $1,136 (0.6%) Median real estate property taxes paid for housing units with no mortgage in 2022: $552 (0.5%)
Business Search- 14 Million verified businesses
Males: 897
(48.7%)
Females: 945
(51.3%)
For population 25 years and over in 46076:
High school or higher: 83.0%
Bachelor's degree or higher: 23.1%
Graduate or professional degree: 9.5%
Unemployed: 0.7%
Mean travel time to work (commute): 26.1 minutes
For population 15 years and over in 46076:
Never married: 23.3%
Now married: 65.0%
Separated: 0.4%
Widowed: 6.2%
Divorced: 5.1%
Zip code 46076 compared to state average:
Median house value below state average.
Unemployed percentage significantly below state average.
Black race population percentage significantly below state average.
Foreign-born population percentage significantly below state average.
Renting percentage below state average.
Length of stay since moving in significantly above state average.
Number of college students significantly below state average.
Estimated median house/condo value in 2022: $110,375
46076:
$110,375
Indiana:
$208,700
Median resident age:
This zip code:
36.6 years
Indiana median age:
38.2 years
Average household size:
This zip code:
2.5 people
Indiana:
2.4 people
Averages for the 2020 tax year for zip code 46076, filed in 2021:
Average Adjusted Gross Income (AGI) in 2020: $60,241 (Individual Income Tax Returns)
Here:
$60,241
State:
$64,978
Salary/wage: $52,717 (reported on 80.0% of returns)
Here:
$52,717
State:
$55,245
(% of AGI for various income ranges: 1045.9% for AGIs below $25k, 3505.0% for AGIs $25k-50k, 5614.5% for AGIs $50k-75k, 8833.3% for AGIs $75k-100k, 17980.0% for AGIs $100k-200k)
Taxable interest for individuals: $1,200 (reported on 33.3% of returns)
This zip code:
$1,200
Indiana:
$1,351
(% of AGI for various income ranges: 8.2% for AGIs below $25k, 17.9% for AGIs $25k-50k, 20.9% for AGIs $50k-75k, 128.3% for AGIs $75k-100k, 268.3% for AGIs $100k-200k)
Ordinary dividends: $2,422 (reported on 12.0% of returns)
Here:
$2,422
State:
$5,827
(% of AGI for various income ranges: 40.0% for AGIs below $25k, 77.3% for AGIs $50k-75k, 108.3% for AGIs $100k-200k)
Net capital gain/loss in AGI: +$3,656 (reported on 12.0% of returns)
Here:
+$3,656
State:
+$17,730
(% of AGI for various income ranges: 24.1% for AGIs below $25k, 23.6% for AGIs $50k-75k, 436.7% for AGIs $100k-200k)
Profit/loss from business: +$10,962 (reported on 10.7% of returns)
Here:
+$10,962
State:
+$12,144
(% of AGI for various income ranges: 107.1% for AGIs below $25k, 157.1% for AGIs $25k-50k, 276.4% for AGIs $50k-75k, 285.0% for AGIs $100k-200k)
Taxable individual retirement arrangement distribution: $15,871 (reported on 9.3% of returns)
46076:
$15,871
Indiana:
$18,302
(% of AGI for various income ranges: 61.2% for AGIs below $25k, 162.9% for AGIs $25k-50k, 1298.3% for AGIs $75k-100k)
Taxes paid: $7,150 (reported on 2.7% of returns)
46076:
$7,150
State:
$7,542
(% of AGI for various income ranges: 84.1% for AGIs below $25k)
Earned income credit: $2,092 (reported on 16.0% of returns)
Here:
$2,092
State:
$2,298
(% of AGI for various income ranges: 83.5% for AGIs below $25k, 77.9% for AGIs $25k-50k)
Percentage of individuals using paid preparers for their 2020 taxes: 97.3%
Here:
97%
State:
94%
(% for various income ranges: 100.0% for AGIs below $25k, 94.4% for AGIs $25k-50k, 100.0% for AGIs $50k-75k, 88.9% for AGIs $75k-100k, 100.0% for AGIs $100k-200k, 100.0% for AGIs over 200k)
Averages for the 2012 tax year for zip code 46076, filed in 2013:
Average Adjusted Gross Income (AGI) in 2012: $50,259 (Individual Income Tax Returns)
Here:
$50,259
State:
$52,932
Salary/wage: $38,452 (reported on 86.8% of returns)
Here:
$38,452
State:
$45,173
(% of AGI for various income ranges: 65.8% for AGIs below $25k, 69.7% for AGIs $25k-50k, 79.8% for AGIs $50k-75k, 82.5% for AGIs $75k-100k, 52.0% for AGIs $100k-200k)
Taxable interest for individuals: $875 (reported on 31.6% of returns)
This zip code:
$875
Indiana:
$1,311
(% of AGI for various income ranges: 0.4% for AGIs below $25k, 0.3% for AGIs $25k-50k, 0.3% for AGIs $50k-75k, 0.1% for AGIs $75k-100k, 1.0% for AGIs $100k-200k)
Ordinary dividends: $1,627 (reported on 14.5% of returns)
Here:
$1,627
State:
$4,690
(% of AGI for various income ranges: 1.3% for AGIs below $25k, 0.5% for AGIs $50k-75k, 0.7% for AGIs $100k-200k)
Net capital gain/loss in AGI: +$4,050 (reported on 7.9% of returns)
Here:
+$4,050
State:
+$10,406
Profit/loss from business: +$5,862 (reported on 10.5% of returns)
Here:
+$5,862
State:
+$11,105
(% of AGI for various income ranges: 3.3% for AGIs below $25k, 3.1% for AGIs $25k-50k, 2.8% for AGIs $75k-100k)
Taxable individual retirement arrangement distribution: $7,762 (reported on 10.5% of returns)
46076:
$7,762
Indiana:
$13,841
Total itemized deductions: $18,959 (18% of AGI, reported on 22.4% of returns)
Here:
$18,959
State:
$20,913
Here:
18.0% of AGI
State:
18.2% of AGI
(% of AGI for various income ranges: 5.5% for AGIs $25k-50k, 8.1% for AGIs $50k-75k, 8.2% for AGIs $75k-100k, 11.6% for AGIs $100k-200k)
Charity contributions: $3,923 (reported on 17.1% of returns)
Here:
$3,923
State:
$4,697
(% of AGI for various income ranges: 1.9% for AGIs $50k-75k, 2.1% for AGIs $75k-100k, 1.6% for AGIs $100k-200k)
Taxes paid: $6,229 (reported on 22.4% of returns)
46076:
$6,229
State:
$7,456
(% of AGI for various income ranges: 1.2% for AGIs $25k-50k, 2.1% for AGIs $50k-75k, 2.4% for AGIs $75k-100k, 4.5% for AGIs $100k-200k)
Earned income credit: $2,083 (reported on 15.8% of returns)
Here:
$2,083
State:
$2,265
(% of AGI for various income ranges: 5.7% for AGIs below $25k, 1.2% for AGIs $25k-50k)
Percentage of individuals using paid preparers for their 2012 taxes: 65.8%
Here:
66%
State:
53%
(% for various income ranges: 58.6% for AGIs below $25k, 66.7% for AGIs $25k-50k, 69.2% for AGIs $50k-75k, 71.4% for AGIs $75k-100k, 77.8% for AGIs $100k-200k)
Averages for the 2004 tax year for zip code 46076, filed in 2005:
Average Adjusted Gross Income (AGI) in 2004: $41,781 (Individual Income Tax Returns)
Here:
$41,781
State:
$44,790
Salary/wage: $37,430 (reported on 87.7% of returns)
Here:
$37,430
State:
$39,615
(% of AGI for various income ranges: 84.0% for AGIs below $10k, 73.6% for AGIs $10k-25k, 79.0% for AGIs $25k-50k, 80.9% for AGIs $50k-75k, 83.6% for AGIs $75k-100k, 73.7% for AGIs over 100k)
Taxable interest for individuals: $771 (reported on 44.5% of returns)
This zip code:
$771
Indiana:
$1,535
(% of AGI for various income ranges: 6.4% for AGIs below $10k, 2.1% for AGIs $10k-25k, 0.9% for AGIs $25k-50k, 0.7% for AGIs $50k-75k, 0.4% for AGIs $75k-100k, 0.3% for AGIs over 100k)
Taxable dividends: $659 (reported on 16.0% of returns)
Here:
$659
State:
$2,998
(% of AGI for various income ranges: 0.5% for AGIs $10k-25k, 0.3% for AGIs $25k-50k, 0.4% for AGIs $50k-75k, 0.1% for AGIs $75k-100k, 0.1% for AGIs over 100k)
Net capital gain/loss: +$1,906 (reported on 10.8% of returns)
Here:
+$1,906
State:
+$8,619
(% of AGI for various income ranges: -0.4% for AGIs $10k-25k, 0.7% for AGIs $25k-50k, 0.1% for AGIs $50k-75k, 1.1% for AGIs $75k-100k, 0.7% for AGIs over 100k)
Profit/loss from business: +$6,933 (reported on 13.2% of returns)
Here:
+$6,933
State:
+$10,071
(% of AGI for various income ranges: 13.7% for AGIs below $10k, 3.3% for AGIs $10k-25k, 0.1% for AGIs $25k-50k, 3.6% for AGIs $50k-75k, 2.7% for AGIs over 100k)
Profit/loss from farming: +$1,500 (reported on 3.3% of returns)
Here:
+$1,500
State:
-$2,212
Total itemized deductions: $14,453 (19% of AGI, reported on 28.3% of returns)
Here:
$14,453
State:
$17,065
Here:
19.3% of AGI
State:
19.5% of AGI
(% of AGI for various income ranges: 9.5% for AGIs $10k-25k, 6.5% for AGIs $25k-50k, 10.4% for AGIs $50k-75k, 11.8% for AGIs $75k-100k, 11.2% for AGIs over 100k)
Charity contributions deductions: $3,117 (4% of AGI, reported on 21.7% of returns)
Here:
$3,117
State:
$3,550
Here:
4.0% of AGI
State:
3.8% of AGI
(% of AGI for various income ranges: 1.3% for AGIs $10k-25k, 1.1% for AGIs $25k-50k, 1.7% for AGIs $50k-75k, 2.1% for AGIs $75k-100k, 1.9% for AGIs over 100k)
Total tax: $5,579 (reported on 73.7% of returns)
46076:
$5,579
State:
$6,914
(% of AGI for various income ranges: 3.0% for AGIs below $10k, 3.9% for AGIs $10k-25k, 6.0% for AGIs $25k-50k, 9.1% for AGIs $50k-75k, 10.8% for AGIs $75k-100k, 16.2% for AGIs over 100k)
Earned income credit: $1,768 (reported on 14.2% of returns)
Here:
$1,768
State:
$1,685
Percentage of individuals using paid preparers for their 2004 taxes: 71.0%
Here:
71%
State:
59%
(% for various income ranges: 62.5% for AGIs below $10k, 77.4% for AGIs $10k-25k, 68.3% for AGIs $25k-50k, 68.3% for AGIs $50k-75k, 74.2% for AGIs $75k-100k, 83.3% for AGIs over 100k)
Household received Food Stamps/SNAP in the past 12 months: 37 Household did not receive Food Stamps/SNAP in the past 12 months: 689
Women who had a birth in the past 12 months: 50 (40 now married, 11 unmarried) Women who did not have a birth in the past 12 months: 413 (207 now married, 206 unmarried)
Housing units in zip code 46076 with a mortgage: 320 (47 second mortgage, 40 both second mortgage and home equity loan) Houses without a mortgage: 47
Median monthly owner costs for units with a mortgage: $1,185 Median monthly owner costs for units without a mortgage: $486
Residents with income below the poverty level in 2022:
This zip code:
18.1%
Whole state:
12.6%
Residents with income below 50% of the poverty level in 2022:
This zip code:
15.9%
Whole state:
6.3%
Median number of rooms in houses and condos:
Here:
6.0
State:
6.6
Median number of rooms in apartments:
Here:
5.0
State:
4.3
Notable locations in this zip code not listed on our city pages
Size of family households: 245 2-persons, 110 3-persons, 138 4-persons, 52 5-persons, 16 6-persons, 5 7-or-more-persons
Size of nonfamily households: 107 1-person, 45 2-persons, 4 3-persons
304 married couples with children.
64 single-parent households (54 men, 10 women).
95.3% of residents of 46076 zip code speak English at home.
3.8% of residents speak Spanish at home (95% very well, 5% well).
0.7% of residents speak Asian or Pacific Island language at home (100% very well).
Foreign born population: 0 (0.0%)
:
0.0%
Whole state:
6.1%
18%English
14%German
12%American
10%Irish
4%Dutch
0%Polish
0%Scottish
Year of entry for the foreign-born population
152010 or later
02000 to 2009
01990 to 1999
0Before 1990
Facilities with environmental interests located in this zip code:
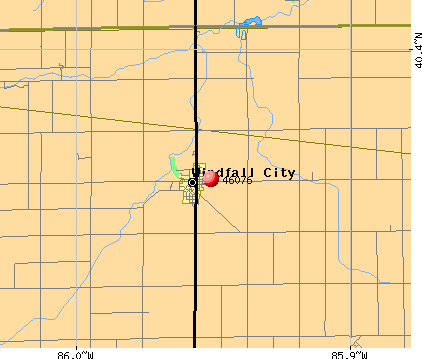
DEKALB PLANT GENETICS (SR 213 & SR 26 in WINDFALL, IN)
AIR SYNTHETIC MINOR (AIRS/AFS) STATE MASTER (Indiana facility tracking) - ACES-CP-15900010, AIR PROGRAM, CRTK-10001, EPCRA, LUST-199101544, LEAKING STORAGE TANK, UST-18500, UNDERGROUND STORAGE TANK PROGRAM Business SIC classification: MANUFACTURING INDUSTRIES
DEKALB GENETICS CORP (908 N INDEPENDENCE in WINDFALL, IN)
STATE MASTER (Indiana facility tracking) Conditionally Exempt Small Quantity Generators, less than 100 kg/month of hazardous waste (Resource Conservation and Recovery Act (tracking hazardous waste)) - notification
DEKALB GENETICS CORP (ST RD 213 N in WINDFALL, IN)
Conditionally Exempt Small Quantity Generators, less than 100 kg/month of hazardous waste (Resource Conservation and Recovery Act (tracking hazardous waste)) - notification
Housing units lacking complete plumbing facilities: 1.9% Housing units lacking complete kitchen facilities: 0.9%
42.6%Utility gas
33.4%Electricity
18.4%Bottled, tank, or LP gas
3.7%Fuel oil, kerosene, etc.
2.0%Wood
Population in 1990: 1,535. Population change in the 1990s: +310 (+20.2%).
Place of birth for U.S.-born residents:
This state: 1,537
Northeast: 10
Midwest: 83
South: 150
West: 33
69% of the 46076 zip code residents lived in the same house 5 years ago. Out of people who lived in different houses, 52% lived in this county. Out of people who lived in different counties, 50% lived in Indiana.
96% of the 46076 zip code residents lived in the same house 1 year ago. Out of people who lived in different houses, 43% moved from this county. Out of people who lived in different houses, 67% moved from different county within same state.
Private vs. public school enrollment:
Students in private schools in grades 1 to 8 (elementary and middle school):
Here:
0.0%
Indiana:
14.9%
Students in private schools in grades 9 to 12 (high school): 10
Here:
7.5%
Indiana:
11.4%
Students in private undergraduate colleges: 1
Here:
11.3%
Indiana:
22.3%
Occupation by median earnings in the past 12 months ($)
105,349Material moving occupations
102,261Business and financial operations occupations
80,608Management occupations
60,601Life, physical, and social science occupations
58,470Installation, maintenance, and repair occupations
52,987Production occupations
Top industries in this zip code by the number of employees in 2005:
Finance and Insurance: Insurance Agencies and Brokerages (10-19 employees: 1 establishment)
Other Services (except Public Administration): Other Personal and Household Goods Repair and Maintenance (10-19: 1)
Other Services (except Public Administration): Religious Organizations (5-9: 1, 1-4: 1)
Wholesale Trade: Grain and Field Bean Merchant Wholesalers (5-9: 1)
Accommodation and Food Services: Full-Service Restaurants (1-4: 2)
Administrative and Support and Waste Management and Remediation Services: Landscaping Services (1-4: 1)
Arts, Entertainment, and Recreation: All Other Amusement and Recreation Industries (1-4: 1)
2005 - 2018 National Fire Incident Reporting System (NFIRS) incidents
Based on the data from the years 2005 - 2018 the average number of fires per year is 10. The highest number of fires - 27 took place in 2010, and the least - 1 in 2014. The data has a rising trend.
When looking into fire subcategories, the most reports belonged to: Outside Fires (49.0%), and Structure Fires (40.8%).
Fire incident types reported to NFIRS in Zip Code 46076


+$1,500
-$2,212
 Nearest zip codes: 46047, 46036, 46936, 46072, 46031, 46986.


 Based on the data from the years 2005 - 2018 the average number of fires per year is 10. The highest number of fires - 27 took place in 2010, and the least - 1 in 2014. The data has a rising trend.
 When looking into fire subcategories, the most reports belonged to: Outside Fires (49.0%), and Structure Fires (40.8%).