Estimated zip code population in 2022: 4,760 Zip code population in 2010: 5,276 Zip code population in 2000: 4,349
Houses and condos: 2,080 Renter-occupied apartments: 189
% of renters here:
10%
State:
29%
March 2022 cost of living index in zip code 46121: 87.5 (less than average, U.S. average is 100)
Land area: 54.4 sq. mi. Water area: 0.6 sq. mi.
Population density: 87 people per square mile
(very low).
OSM Map
General Map
Google Map
MSN Map
OSM Map
General Map
Google Map
MSN Map
OSM Map
General Map
Google Map
MSN Map
OSM Map
General Map
Google Map
MSN Map
Please wait while loading the map...
Real estate property taxes paid for housing units in 2022:
This zip code:
0.5% ($1,312)
Indiana:
0.7% ($1,467)
Median real estate property taxes paid for housing units with mortgages in 2022: $1,222 (0.5%) Median real estate property taxes paid for housing units with no mortgage in 2022: $1,492 (0.6%)
Business Search- 14 Million verified businesses
Males: 2,319
(48.7%)
Females: 2,441
(51.3%)
For population 25 years and over in 46121:
High school or higher: 91.8%
Bachelor's degree or higher: 22.0%
Graduate or professional degree: 4.8%
Unemployed: 3.2%
Mean travel time to work (commute): 31.9 minutes
For population 15 years and over in 46121:
Never married: 30.6%
Now married: 51.4%
Separated: 0.9%
Widowed: 4.6%
Divorced: 12.6%
Zip code 46121 compared to state average:
Black race population percentage significantly below state average.
Hispanic race population percentage significantly below state average.
Median age below state average.
Foreign-born population percentage significantly below state average.
Renting percentage significantly below state average.
Length of stay since moving in above state average.
Estimated median house/condo value in 2022: $258,943
46121:
$258,943
Indiana:
$208,700
Median resident age:
This zip code:
33.7 years
Indiana median age:
38.2 years
Average household size:
This zip code:
2.5 people
Indiana:
2.4 people
Averages for the 2020 tax year for zip code 46121, filed in 2021:
Average Adjusted Gross Income (AGI) in 2020: $74,640 (Individual Income Tax Returns)
Here:
$74,640
State:
$64,978
Salary/wage: $66,091 (reported on 84.5% of returns)
Here:
$66,091
State:
$55,245
(% of AGI for various income ranges: 1122.3% for AGIs below $25k, 3638.8% for AGIs $25k-50k, 6886.1% for AGIs $50k-75k, 9550.0% for AGIs $75k-100k, 18255.3% for AGIs $100k-200k, 58477.5% for AGIs over 200k)
Taxable interest for individuals: $928 (reported on 29.1% of returns)
This zip code:
$928
Indiana:
$1,351
(% of AGI for various income ranges: 19.3% for AGIs below $25k, 21.0% for AGIs $25k-50k, 21.3% for AGIs $50k-75k, 21.2% for AGIs $75k-100k, 58.0% for AGIs $100k-200k, 580.0% for AGIs over 200k)
Ordinary dividends: $2,891 (reported on 16.7% of returns)
Here:
$2,891
State:
$5,827
(% of AGI for various income ranges: 26.7% for AGIs below $25k, 30.0% for AGIs $25k-50k, 36.5% for AGIs $50k-75k, 71.9% for AGIs $75k-100k, 105.0% for AGIs $100k-200k, 975.0% for AGIs over 200k)
Net capital gain/loss in AGI: +$9,522 (reported on 14.3% of returns)
Here:
+$9,522
State:
+$17,730
(% of AGI for various income ranges: 5.1% for AGIs below $25k, 24.1% for AGIs $25k-50k, 49.0% for AGIs $50k-75k, 100.4% for AGIs $75k-100k, 229.0% for AGIs $100k-200k, 5755.0% for AGIs over 200k)
Profit/loss from business: +$14,877 (reported on 13.6% of returns)
Here:
+$14,877
State:
+$12,144
(% of AGI for various income ranges: 69.1% for AGIs below $25k, 80.5% for AGIs $25k-50k, 196.5% for AGIs $50k-75k, 171.2% for AGIs $75k-100k, 646.3% for AGIs $100k-200k, 3967.5% for AGIs over 200k)
Taxable individual retirement arrangement distribution: $18,142 (reported on 10.1% of returns)
46121:
$18,142
Indiana:
$18,302
(% of AGI for various income ranges: 82.6% for AGIs below $25k, 148.8% for AGIs $25k-50k, 257.7% for AGIs $50k-75k, 306.2% for AGIs $75k-100k, 719.0% for AGIs $100k-200k)
Total itemized deductions: $29,267 (reported on 5.8% of returns)
Here:
$29,267
State:
$35,601
(% of AGI for various income ranges: 200.7% for AGIs $25k-50k, 216.2% for AGIs $75k-100k, 546.7% for AGIs $100k-200k, 3412.5% for AGIs over 200k)
Charity contributions: $11,590 (reported on 3.9% of returns)
Here:
$11,590
State:
$15,596
(% of AGI for various income ranges: 34.2% for AGIs $50k-75k, 140.7% for AGIs $100k-200k, 1577.5% for AGIs over 200k)
Taxes paid: $7,633 (reported on 5.8% of returns)
46121:
$7,633
State:
$7,542
(% of AGI for various income ranges: 34.6% for AGIs $25k-50k, 57.3% for AGIs $75k-100k, 164.7% for AGIs $100k-200k, 900.0% for AGIs over 200k)
Earned income credit: $2,052 (reported on 8.9% of returns)
Here:
$2,052
State:
$2,298
(% of AGI for various income ranges: 66.0% for AGIs below $25k, 45.9% for AGIs $25k-50k)
Percentage of individuals using paid preparers for their 2020 taxes: 94.2%
Here:
94%
State:
94%
(% for various income ranges: 92.3% for AGIs below $25k, 92.5% for AGIs $25k-50k, 95.2% for AGIs $50k-75k, 94.4% for AGIs $75k-100k, 96.0% for AGIs $100k-200k, 100.0% for AGIs over 200k)
Averages for the 2012 tax year for zip code 46121, filed in 2013:
Average Adjusted Gross Income (AGI) in 2012: $57,203 (Individual Income Tax Returns)
Here:
$57,203
State:
$52,932
Salary/wage: $51,232 (reported on 85.2% of returns)
Here:
$51,232
State:
$45,173
(% of AGI for various income ranges: 67.9% for AGIs below $25k, 76.2% for AGIs $25k-50k, 77.5% for AGIs $50k-75k, 81.0% for AGIs $75k-100k, 83.1% for AGIs $100k-200k, 54.5% for AGIs over 200k)
Taxable interest for individuals: $738 (reported on 31.0% of returns)
This zip code:
$738
Indiana:
$1,311
(% of AGI for various income ranges: 1.1% for AGIs below $25k, 0.5% for AGIs $25k-50k, 0.4% for AGIs $50k-75k, 0.2% for AGIs $75k-100k, 0.3% for AGIs $100k-200k, 0.5% for AGIs over 200k)
Ordinary dividends: $1,713 (reported on 16.6% of returns)
Here:
$1,713
State:
$4,690
(% of AGI for various income ranges: 0.9% for AGIs below $25k, 0.7% for AGIs $25k-50k, 0.6% for AGIs $50k-75k, 0.2% for AGIs $75k-100k, 0.4% for AGIs $100k-200k, 0.7% for AGIs over 200k)
Net capital gain/loss in AGI: +$4,244 (reported on 11.8% of returns)
Here:
+$4,244
State:
+$10,406
(% of AGI for various income ranges: 0.7% for AGIs $75k-100k, 1.0% for AGIs $100k-200k, 4.2% for AGIs over 200k)
Profit/loss from business: +$8,632 (reported on 14.8% of returns)
Here:
+$8,632
State:
+$11,105
(% of AGI for various income ranges: 6.7% for AGIs below $25k, 2.6% for AGIs $25k-50k, 1.3% for AGIs $50k-75k, 2.2% for AGIs $75k-100k, 2.6% for AGIs $100k-200k)
Taxable individual retirement arrangement distribution: $14,712 (reported on 11.4% of returns)
46121:
$14,712
Indiana:
$13,841
(% of AGI for various income ranges: 3.8% for AGIs below $25k, 2.6% for AGIs $25k-50k, 2.8% for AGIs $50k-75k, 2.7% for AGIs $75k-100k, 4.2% for AGIs $100k-200k)
Total itemized deductions: $18,720 (19% of AGI, reported on 34.5% of returns)
Here:
$18,720
State:
$20,913
Here:
19.1% of AGI
State:
18.2% of AGI
(% of AGI for various income ranges: 7.2% for AGIs below $25k, 8.2% for AGIs $25k-50k, 10.3% for AGIs $50k-75k, 13.2% for AGIs $75k-100k, 13.5% for AGIs $100k-200k, 10.2% for AGIs over 200k)
Charity contributions: $2,934 (reported on 25.8% of returns)
Here:
$2,934
State:
$4,697
(% of AGI for various income ranges: 0.6% for AGIs below $25k, 0.6% for AGIs $25k-50k, 0.8% for AGIs $50k-75k, 1.3% for AGIs $75k-100k, 2.0% for AGIs $100k-200k, 1.7% for AGIs over 200k)
Taxes paid: $6,341 (reported on 34.5% of returns)
46121:
$6,341
State:
$7,456
(% of AGI for various income ranges: 1.1% for AGIs below $25k, 1.9% for AGIs $25k-50k, 2.9% for AGIs $50k-75k, 3.9% for AGIs $75k-100k, 5.4% for AGIs $100k-200k, 5.0% for AGIs over 200k)
Earned income credit: $2,056 (reported on 14.0% of returns)
Here:
$2,056
State:
$2,265
(% of AGI for various income ranges: 5.4% for AGIs below $25k, 1.0% for AGIs $25k-50k)
Percentage of individuals using paid preparers for their 2012 taxes: 54.1%
Here:
54%
State:
53%
(% for various income ranges: 50.0% for AGIs below $25k, 55.1% for AGIs $25k-50k, 55.0% for AGIs $50k-75k, 55.2% for AGIs $75k-100k, 56.7% for AGIs $100k-200k, 80.0% for AGIs over 200k)
Averages for the 2004 tax year for zip code 46121, filed in 2005:
Average Adjusted Gross Income (AGI) in 2004: $46,890 (Individual Income Tax Returns)
Here:
$46,890
State:
$44,790
Salary/wage: $44,749 (reported on 87.5% of returns)
Here:
$44,749
State:
$39,615
(% of AGI for various income ranges: 116.6% for AGIs below $10k, 64.6% for AGIs $10k-25k, 81.0% for AGIs $25k-50k, 86.0% for AGIs $50k-75k, 89.5% for AGIs $75k-100k, 81.8% for AGIs over 100k)
Taxable interest for individuals: $1,169 (reported on 47.0% of returns)
This zip code:
$1,169
Indiana:
$1,535
(% of AGI for various income ranges: 6.0% for AGIs below $10k, 3.4% for AGIs $10k-25k, 0.9% for AGIs $25k-50k, 0.7% for AGIs $50k-75k, 0.9% for AGIs $75k-100k, 1.3% for AGIs over 100k)
Taxable dividends: $968 (reported on 18.6% of returns)
Here:
$968
State:
$2,998
(% of AGI for various income ranges: 1.1% for AGIs below $10k, 0.7% for AGIs $10k-25k, 0.4% for AGIs $25k-50k, 0.4% for AGIs $50k-75k, 0.2% for AGIs $75k-100k, 0.5% for AGIs over 100k)
Net capital gain/loss: +$2,000 (reported on 14.4% of returns)
Here:
+$2,000
State:
+$8,619
(% of AGI for various income ranges: -0.5% for AGIs below $10k, 0.8% for AGIs $10k-25k, 0.4% for AGIs $25k-50k, 0.7% for AGIs $50k-75k, -0.0% for AGIs $75k-100k, 1.3% for AGIs over 100k)
Profit/loss from business: +$8,234 (reported on 15.5% of returns)
Here:
+$8,234
State:
+$10,071
(% of AGI for various income ranges: 4.1% for AGIs below $10k, 5.3% for AGIs $10k-25k, 3.9% for AGIs $25k-50k, 1.7% for AGIs $50k-75k, 1.3% for AGIs $75k-100k, 3.4% for AGIs over 100k)
IRA payment deduction: $2,238 (reported on 1.9% of returns)
46121:
$2,238
Indiana:
$2,840
Total itemized deductions: $16,242 (23% of AGI, reported on 43.7% of returns)
Here:
$16,242
State:
$17,065
Here:
22.7% of AGI
State:
19.5% of AGI
(% of AGI for various income ranges: 13.3% for AGIs below $10k, 14.6% for AGIs $10k-25k, 14.0% for AGIs $25k-50k, 15.3% for AGIs $50k-75k, 16.2% for AGIs $75k-100k, 15.1% for AGIs over 100k)
Charity contributions deductions: $2,160 (3% of AGI, reported on 34.0% of returns)
Here:
$2,160
State:
$3,550
Here:
2.9% of AGI
State:
3.8% of AGI
(% of AGI for various income ranges: 1.3% for AGIs $10k-25k, 1.3% for AGIs $25k-50k, 1.3% for AGIs $50k-75k, 2.0% for AGIs $75k-100k, 1.9% for AGIs over 100k)
Total tax: $5,776 (reported on 78.3% of returns)
46121:
$5,776
State:
$6,914
(% of AGI for various income ranges: 2.7% for AGIs below $10k, 4.0% for AGIs $10k-25k, 6.5% for AGIs $25k-50k, 8.1% for AGIs $50k-75k, 10.1% for AGIs $75k-100k, 15.5% for AGIs over 100k)
Earned income credit: $1,638 (reported on 10.5% of returns)
Here:
$1,638
State:
$1,685
Percentage of individuals using paid preparers for their 2004 taxes: 60.3%
Here:
60%
State:
59%
(% for various income ranges: 52.3% for AGIs below $10k, 66.9% for AGIs $10k-25k, 61.1% for AGIs $25k-50k, 62.1% for AGIs $50k-75k, 55.2% for AGIs $75k-100k, 59.9% for AGIs over 100k)
Likely homosexual households (counted as self-reported same-sex unmarried-partner households)
Lesbian couples: 0.0% of all households
Gay men: 0.1% of all households
Household received Food Stamps/SNAP in the past 12 months: 83 Household did not receive Food Stamps/SNAP in the past 12 months: 1,793
Women who had a birth in the past 12 months: 58 (34 now married, 22 unmarried) Women who did not have a birth in the past 12 months: 1,141 (505 now married, 636 unmarried)
Housing units in zip code 46121 with a mortgage: 1,245 (78 second mortgage, 59 both second mortgage and home equity loan) Houses without a mortgage: 18
Median monthly owner costs for units with a mortgage: $1,390 Median monthly owner costs for units without a mortgage: $587
Residents with income below the poverty level in 2022:
This zip code:
13.4%
Whole state:
12.6%
Residents with income below 50% of the poverty level in 2022:
This zip code:
5.4%
Whole state:
6.3%
Median number of rooms in houses and condos:
Here:
6.7
State:
6.6
Median number of rooms in apartments:
Here:
5.3
State:
4.3
Notable locations in this zip code not listed on our city pages
Notable locations in zip code 46121: Sunny Slope Farm (A), Mill Creek Fire Department Station 61 (B), Jefferson Township Volunteer Fire Department (C), Mill Creek Fire Department Station 51 (D). Display/hide their locations on the map
Size of family households: 531 2-persons, 448 3-persons, 178 4-persons, 132 5-persons, 36 6-persons, 77 7-or-more-persons
Size of nonfamily households: 316 1-person, 147 2-persons, 10 3-persons
593 married couples with children.
454 single-parent households (253 men, 201 women).
97.2% of residents of 46121 zip code speak English at home.
0.5% of residents speak Spanish at home (50% very well, 50% well).
1.1% of residents speak other Indo-European language at home (52% very well, 19% well, 29% not well).
Foreign born population: 39 (0.8%) (45.7% of them are naturalized citizens)
This zip code:
0.8%
Whole state:
6.1%
64%Chile
46%Serbia
34%American
20%European
11%English
10%German
6%Irish
4%Scotch-Irish
2%Polish
Year of entry for the foreign-born population
252010 or later
82000 to 2009
71990 to 1999
16Before 1990
Facilities with environmental interests located in this zip code:
CLEAR CREEK CONSERVANCY DISTRICT (HERITAGE DRIVE SOUTH OF DAM in COATESVILLE, IN)
STATE MASTER (Indiana facility tracking) - IN-NPDES-IN0045527, National Pollutant Discharge Elimination System Permit National Pollutant Discharge Elimination System NON-MAJOR (Tracking pollutant discharge elimination systems) - permit Business SIC classification: SEWERAGE SYSTEMS Organizations: DOUG CLODFELTER 9478 (CONTACT/OPERATOR)
, CLEAR CREEK CONSERVANCY DSTRCT (CONTACT/OWNER)
Alternative names: CLEAR CREEK CONSERVANCY DSTRCT
AMERICAN HERITAGE ACADEMY 67 (RR 2 in COATESVILLE, IN)
STATE MASTER (Indiana facility tracking) COMPLIANCE ACTIVITY (Tracking inspections of insecticide, fungicide, and rodenticide, and toxic substances)
Housing units lacking complete plumbing facilities: 1.1% Housing units lacking complete kitchen facilities: 1.4%
52.5%Electricity
33.3%Bottled, tank, or LP gas
4.7%Wood
4.6%Fuel oil, kerosene, etc.
2.7%Utility gas
1.5%Solar energy
0.9%No fuel used
Population in 1990: 1,992. Population change in the 1990s: +2,357 (+118.3%).
Place of birth for U.S.-born residents:
This state: 3,912
Northeast: 76
Midwest: 288
South: 215
West: 186
59% of the 46121 zip code residents lived in the same house 5 years ago. Out of people who lived in different houses, 29% lived in this county. Out of people who lived in different counties, 50% lived in Indiana.
93% of the 46121 zip code residents lived in the same house 1 year ago. Out of people who lived in different houses, 36% moved from this county. Out of people who lived in different houses, 36% moved from different county within same state. Out of people who lived in different houses, 28% moved from different state. Out of people who lived in different houses, 3% moved from abroad.
Private vs. public school enrollment:
Students in private schools in grades 1 to 8 (elementary and middle school): 47
Here:
8.3%
Indiana:
14.9%
Students in private schools in grades 9 to 12 (high school): 66
Here:
29.4%
Indiana:
11.4%
Students in private undergraduate colleges: 59
Here:
23.5%
Indiana:
22.3%
Occupation by median earnings in the past 12 months ($)
99,631Health diagnosing and treating practitioners and other technical occupations
90,297Community and social service occupations
87,153Architecture and engineering occupations
79,569Personal care and service occupations
71,586Management occupations
71,501Transportation occupations
Top industries in this zip code by the number of employees in 2005:
Construction: Poured Concrete Foundation and Structure Contractors (10-19 employees: 1 establishment, 1-4 employees: 2 establishments)
Accommodation and Food Services: Full-Service Restaurants (10-19: 1)
Finance and Insurance: Insurance Agencies and Brokerages (5-9: 1, 1-4: 1)
Construction: Site Preparation Contractors (5-9: 1, 1-4: 1)
Other Services (except Public Administration): Other Similar Organizations (except Business, Professional, Labor, and Political Organizations) (5-9: 1)
Arts, Entertainment, and Recreation: Independent Artists, Writers, and Performers (5-9: 1)
Other Services (except Public Administration): Home and Garden Equipment Repair and Maintenance (5-9: 1)
Home Mortgage Disclosure Act Aggregated Statistics For Year 2009 (Based on 6 partial tracts)
A) FHA, FSA/RHS & VA Home Purchase Loans
B) Conventional Home Purchase Loans
C) Refinancings
D) Home Improvement Loans
F) Non-occupant Loans on < 5 Family Dwellings (A B C & D)
G) Loans On Manufactured Home Dwelling (A B C & D)
Number
Average Value
Number
Average Value
Number
Average Value
Number
Average Value
Number
Average Value
Number
Average Value
LOANS ORIGINATED
35
$105,889
26
$122,040
201
$143,859
11
$42,118
21
$145,075
12
$74,169
APPLICATIONS APPROVED, NOT ACCEPTED
0
$0
2
$140,895
14
$135,730
1
$37,800
2
$138,930
0
$0
APPLICATIONS DENIED
11
$103,266
11
$143,357
82
$142,952
7
$39,826
6
$111,460
7
$83,643
APPLICATIONS WITHDRAWN
6
$99,930
3
$83,577
41
$148,609
3
$79,617
2
$136,995
2
$78,295
FILES CLOSED FOR INCOMPLETENESS
2
$160,550
1
$143,420
14
$159,754
0
$0
1
$129,640
2
$87,665
Aggregated Statistics For Year 2008 (Based on 6 partial tracts)
A) FHA, FSA/RHS & VA Home Purchase Loans
B) Conventional Home Purchase Loans
C) Refinancings
D) Home Improvement Loans
F) Non-occupant Loans on < 5 Family Dwellings (A B C & D)
G) Loans On Manufactured Home Dwelling (A B C & D)
Number
Average Value
Number
Average Value
Number
Average Value
Number
Average Value
Number
Average Value
Number
Average Value
LOANS ORIGINATED
37
$118,562
48
$129,812
128
$136,052
22
$26,501
25
$134,033
13
$63,265
APPLICATIONS APPROVED, NOT ACCEPTED
1
$48,190
2
$96,765
21
$126,918
3
$14,263
1
$147,080
2
$66,155
APPLICATIONS DENIED
8
$77,714
12
$134,444
89
$131,849
26
$49,097
6
$108,980
4
$75,230
APPLICATIONS WITHDRAWN
3
$67,650
5
$110,476
37
$132,566
1
$120,610
3
$100,673
1
$126,050
FILES CLOSED FOR INCOMPLETENESS
2
$96,995
2
$91,545
11
$160,254
1
$67,500
1
$138,150
0
$0
Aggregated Statistics For Year 2007 (Based on 6 partial tracts)
A) FHA, FSA/RHS & VA Home Purchase Loans
B) Conventional Home Purchase Loans
C) Refinancings
D) Home Improvement Loans
F) Non-occupant Loans on < 5 Family Dwellings (A B C & D)
G) Loans On Manufactured Home Dwelling (A B C & D)
Number
Average Value
Number
Average Value
Number
Average Value
Number
Average Value
Number
Average Value
Number
Average Value
LOANS ORIGINATED
25
$104,547
98
$115,921
133
$131,618
25
$45,496
24
$123,951
19
$69,092
APPLICATIONS APPROVED, NOT ACCEPTED
2
$63,000
6
$90,320
34
$112,544
10
$28,720
3
$62,437
2
$58,015
APPLICATIONS DENIED
6
$85,423
22
$99,758
112
$126,138
38
$41,920
7
$150,091
7
$87,843
APPLICATIONS WITHDRAWN
2
$109,465
15
$151,963
49
$126,317
6
$123,548
4
$89,098
2
$59,700
FILES CLOSED FOR INCOMPLETENESS
0
$0
4
$86,785
12
$122,352
0
$0
0
$0
0
$0
Aggregated Statistics For Year 2006 (Based on 6 partial tracts)
A) FHA, FSA/RHS & VA Home Purchase Loans
B) Conventional Home Purchase Loans
C) Refinancings
D) Home Improvement Loans
F) Non-occupant Loans on < 5 Family Dwellings (A B C & D)
G) Loans On Manufactured Home Dwelling (A B C & D)
Number
Average Value
Number
Average Value
Number
Average Value
Number
Average Value
Number
Average Value
Number
Average Value
LOANS ORIGINATED
21
$105,998
127
$115,669
156
$130,700
39
$51,952
37
$101,849
15
$78,865
APPLICATIONS APPROVED, NOT ACCEPTED
1
$119,730
15
$97,227
30
$121,325
4
$23,595
2
$136,680
2
$60,645
APPLICATIONS DENIED
5
$84,176
36
$88,407
146
$118,177
34
$43,529
7
$70,606
14
$68,714
APPLICATIONS WITHDRAWN
4
$89,498
24
$110,487
75
$121,701
4
$74,198
5
$79,676
3
$57,337
FILES CLOSED FOR INCOMPLETENESS
0
$0
5
$64,618
23
$129,390
0
$0
0
$0
0
$0
Aggregated Statistics For Year 2005 (Based on 6 partial tracts)
A) FHA, FSA/RHS & VA Home Purchase Loans
B) Conventional Home Purchase Loans
C) Refinancings
D) Home Improvement Loans
F) Non-occupant Loans on < 5 Family Dwellings (A B C & D)
G) Loans On Manufactured Home Dwelling (A B C & D)
Number
Average Value
Number
Average Value
Number
Average Value
Number
Average Value
Number
Average Value
Number
Average Value
LOANS ORIGINATED
26
$107,054
107
$120,295
208
$112,498
27
$53,570
37
$109,901
17
$82,604
APPLICATIONS APPROVED, NOT ACCEPTED
3
$131,557
12
$75,708
30
$98,017
3
$45,323
2
$92,430
2
$59,020
APPLICATIONS DENIED
4
$86,455
40
$103,114
167
$111,260
37
$54,085
8
$95,470
15
$94,817
APPLICATIONS WITHDRAWN
3
$104,823
20
$110,122
85
$117,477
15
$119,890
5
$112,012
4
$89,370
FILES CLOSED FOR INCOMPLETENESS
2
$100,760
9
$92,553
36
$148,789
0
$0
1
$141,400
1
$95,550
Aggregated Statistics For Year 2004 (Based on 6 partial tracts)
A) FHA, FSA/RHS & VA Home Purchase Loans
B) Conventional Home Purchase Loans
C) Refinancings
D) Home Improvement Loans
F) Non-occupant Loans on < 5 Family Dwellings (A B C & D)
G) Loans On Manufactured Home Dwelling (A B C & D)
Number
Average Value
Number
Average Value
Number
Average Value
Number
Average Value
Number
Average Value
Number
Average Value
LOANS ORIGINATED
30
$99,993
98
$117,806
211
$113,001
27
$61,816
30
$88,458
15
$75,989
APPLICATIONS APPROVED, NOT ACCEPTED
3
$98,443
18
$102,748
36
$105,484
4
$36,812
6
$98,195
5
$71,006
APPLICATIONS DENIED
6
$86,133
30
$78,466
146
$104,248
25
$30,958
9
$80,386
14
$60,018
APPLICATIONS WITHDRAWN
5
$86,996
10
$99,870
70
$114,833
3
$48,227
5
$80,310
3
$95,223
FILES CLOSED FOR INCOMPLETENESS
1
$106,180
5
$85,422
23
$119,254
1
$29,370
1
$42,120
2
$44,665
Aggregated Statistics For Year 2003 (Based on 2 partial tracts)
A) FHA, FSA/RHS & VA Home Purchase Loans
B) Conventional Home Purchase Loans
C) Refinancings
D) Home Improvement Loans
F) Non-occupant Loans on < 5 Family Dwellings (A B C & D)
Number
Average Value
Number
Average Value
Number
Average Value
Number
Average Value
Number
Average Value
LOANS ORIGINATED
19
$110,088
35
$134,262
192
$104,254
6
$15,188
8
$73,991
APPLICATIONS APPROVED, NOT ACCEPTED
1
$56,630
5
$95,028
20
$106,044
4
$28,092
0
$0
APPLICATIONS DENIED
2
$103,080
14
$63,389
55
$92,357
10
$46,275
2
$39,375
APPLICATIONS WITHDRAWN
1
$73,440
6
$215,743
26
$111,621
2
$123,870
0
$0
FILES CLOSED FOR INCOMPLETENESS
0
$0
2
$80,515
11
$105,130
1
$13,270
1
$63,710
Aggregated Statistics For Year 2002 (Based on 2 partial tracts)
A) FHA, FSA/RHS & VA Home Purchase Loans
B) Conventional Home Purchase Loans
C) Refinancings
D) Home Improvement Loans
F) Non-occupant Loans on < 5 Family Dwellings (A B C & D)
Number
Average Value
Number
Average Value
Number
Average Value
Number
Average Value
Number
Average Value
LOANS ORIGINATED
8
$83,502
28
$111,169
132
$110,312
8
$17,142
11
$101,189
APPLICATIONS APPROVED, NOT ACCEPTED
0
$0
1
$168,110
26
$91,747
4
$27,870
1
$40,700
APPLICATIONS DENIED
3
$96,443
4
$53,530
73
$94,940
9
$10,126
8
$54,084
APPLICATIONS WITHDRAWN
1
$72,550
4
$103,522
15
$89,483
2
$13,270
4
$36,498
FILES CLOSED FOR INCOMPLETENESS
0
$0
4
$103,742
12
$110,305
0
$0
1
$60,170
Aggregated Statistics For Year 2001 (Based on 2 partial tracts)
A) FHA, FSA/RHS & VA Home Purchase Loans
B) Conventional Home Purchase Loans
C) Refinancings
D) Home Improvement Loans
F) Non-occupant Loans on < 5 Family Dwellings (A B C & D)
Number
Average Value
Number
Average Value
Number
Average Value
Number
Average Value
Number
Average Value
LOANS ORIGINATED
13
$114,343
35
$104,027
134
$99,243
12
$26,839
4
$88,922
APPLICATIONS APPROVED, NOT ACCEPTED
3
$87,890
4
$177,402
27
$80,910
2
$24,775
1
$72,550
APPLICATIONS DENIED
4
$81,622
9
$101,850
58
$84,056
14
$25,280
0
$0
APPLICATIONS WITHDRAWN
0
$0
4
$149,752
24
$103,632
2
$15,485
1
$46,890
FILES CLOSED FOR INCOMPLETENESS
0
$0
2
$55,740
20
$94,231
0
$0
1
$66,360
Aggregated Statistics For Year 2000 (Based on 2 partial tracts)
A) FHA, FSA/RHS & VA Home Purchase Loans
B) Conventional Home Purchase Loans
C) Refinancings
D) Home Improvement Loans
F) Non-occupant Loans on < 5 Family Dwellings (A B C & D)
Number
Average Value
Number
Average Value
Number
Average Value
Number
Average Value
Number
Average Value
LOANS ORIGINATED
13
$88,072
35
$98,339
52
$78,084
10
$13,626
2
$48,665
APPLICATIONS APPROVED, NOT ACCEPTED
1
$61,050
4
$120,112
12
$61,125
8
$32,185
0
$0
APPLICATIONS DENIED
3
$78,453
18
$77,273
35
$56,450
10
$30,968
0
$0
APPLICATIONS WITHDRAWN
0
$0
3
$63,117
14
$100,361
2
$30,970
0
$0
FILES CLOSED FOR INCOMPLETENESS
1
$92,020
2
$76,980
3
$43,060
1
$14,160
0
$0
Aggregated Statistics For Year 1999 (Based on 1 partial tract)
A) FHA, FSA/RHS & VA Home Purchase Loans
B) Conventional Home Purchase Loans
C) Refinancings
D) Home Improvement Loans
F) Non-occupant Loans on < 5 Family Dwellings (A B C & D)
2002 - 2018 National Fire Incident Reporting System (NFIRS) incidents
According to the data from the years 2002 - 2018 the average number of fire incidents per year is 26. The highest number of fire incidents - 57 took place in 2007, and the least - 4 in 2014. The data has a declining trend.
When looking into fire subcategories, the most incidents belonged to: Structure Fires (45.4%), and Outside Fires (34.0%).
Fire incident types reported to NFIRS in Zip Code 46121

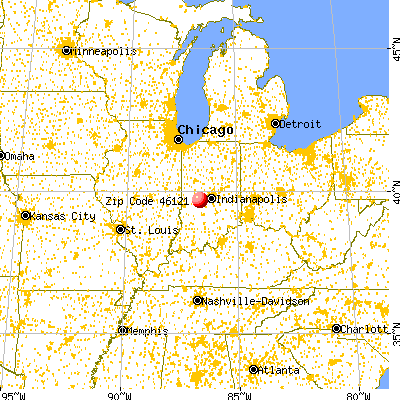


 Nearest zip codes: 46103, 46128, 46180, 46105, 46122, 46118.


 According to the data from the years 2002 - 2018 the average number of fire incidents per year is 26. The highest number of fire incidents - 57 took place in 2007, and the least - 4 in 2014. The data has a declining trend.
 When looking into fire subcategories, the most incidents belonged to: Structure Fires (45.4%), and Outside Fires (34.0%).