Estimated zip code population in 2022: 836 Zip code population in 2010: 1,028 Zip code population in 2000: 957
Houses and condos: 415 Renter-occupied apartments: 14
% of renters here:
4%
State:
29%
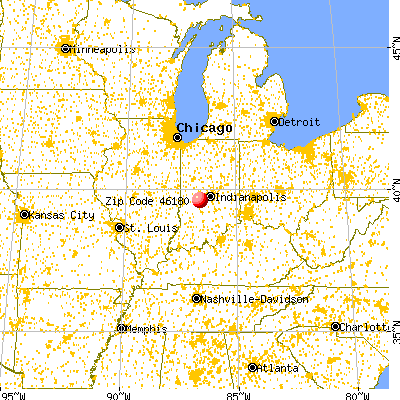
March 2022 cost of living index in zip code 46180: 82.7 (low, U.S. average is 100)
Land area: 25.6 sq. mi. Water area: 0.0 sq. mi.
Population density: 33 people per square mile
(very low).
OSM Map
General Map
Google Map
MSN Map
OSM Map
General Map
Google Map
MSN Map
OSM Map
General Map
Google Map
MSN Map
OSM Map
General Map
Google Map
MSN Map
Please wait while loading the map...
Real estate property taxes paid for housing units in 2022:
This zip code:
0.7% ($1,201)
Indiana:
0.7% ($1,467)
Median real estate property taxes paid for housing units with mortgages in 2022: $816 (0.5%) Median real estate property taxes paid for housing units with no mortgage in 2022: $1,629 (0.9%)
Business Search- 14 Million verified businesses
Males: 451
(53.9%)
Females: 385
(46.1%)
For population 25 years and over in 46180:
High school or higher: 83.9%
Bachelor's degree or higher: 17.4%
Graduate or professional degree: 4.2%
Unemployed: 1.2%
Mean travel time to work (commute): 27.7 minutes
For population 15 years and over in 46180:
Never married: 17.1%
Now married: 68.1%
Separated: 0.0%
Widowed: 8.7%
Divorced: 6.1%
Zip code 46180 compared to state average:
Unemployed percentage below state average.
Black race population percentage significantly below state average.
Hispanic race population percentage significantly below state average.
Median age significantly above state average.
Foreign-born population percentage significantly below state average.
Renting percentage significantly below state average.
Length of stay since moving in significantly above state average.
Estimated median house/condo value in 2022: $176,417
46180:
$176,417
Indiana:
$208,700
Median resident age:
This zip code:
51.6 years
Indiana median age:
38.2 years
Average household size:
This zip code:
2.3 people
Indiana:
2.4 people
Averages for the 2020 tax year for zip code 46180, filed in 2021:
Average Adjusted Gross Income (AGI) in 2020: $57,780 (Individual Income Tax Returns)
Here:
$57,780
State:
$64,978
Salary/wage: $57,005 (reported on 76.0% of returns)
Here:
$57,005
State:
$55,245
(% of AGI for various income ranges: 989.0% for AGIs below $25k, 3237.0% for AGIs $25k-50k, 6600.0% for AGIs $50k-75k, 9800.0% for AGIs $75k-100k, 17026.7% for AGIs $100k-200k)
Taxable interest for individuals: $327 (reported on 30.0% of returns)
This zip code:
$327
Indiana:
$1,351
(% of AGI for various income ranges: 8.0% for AGIs below $25k, 25.0% for AGIs $25k-50k, 20.0% for AGIs $75k-100k, 13.3% for AGIs $100k-200k)
Ordinary dividends: $1,043 (reported on 14.0% of returns)
Here:
$1,043
State:
$5,827
(% of AGI for various income ranges: 54.0% for AGIs $25k-50k, 47.5% for AGIs $75k-100k)
Net capital gain/loss in AGI: +$2,120 (reported on 10.0% of returns)
Here:
+$2,120
State:
+$17,730
(% of AGI for various income ranges: 32.0% for AGIs $25k-50k, 185.0% for AGIs $75k-100k)
Profit/loss from business: +$11,717 (reported on 12.0% of returns)
Here:
+$11,717
State:
+$12,144
(% of AGI for various income ranges: 284.0% for AGIs $25k-50k, 1047.5% for AGIs $75k-100k)
Taxable individual retirement arrangement distribution: $15,767 (reported on 6.0% of returns)
46180:
$15,767
Indiana:
$18,302
(% of AGI for various income ranges: 473.0% for AGIs $25k-50k)
Earned income credit: $2,220 (reported on 10.0% of returns)
Here:
$2,220
State:
$2,298
(% of AGI for various income ranges: 111.0% for AGIs below $25k)
Percentage of individuals using paid preparers for their 2020 taxes: 92.0%
Here:
92%
State:
94%
(% for various income ranges: 93.3% for AGIs below $25k, 92.3% for AGIs $25k-50k, 85.7% for AGIs $50k-75k, 100.0% for AGIs $75k-100k, 88.9% for AGIs $100k-200k)
Averages for the 2012 tax year for zip code 46180, filed in 2013:
Average Adjusted Gross Income (AGI) in 2012: $47,339 (Individual Income Tax Returns)
Here:
$47,339
State:
$52,932
Salary/wage: $40,248 (reported on 81.6% of returns)
Here:
$40,248
State:
$45,173
(% of AGI for various income ranges: 63.1% for AGIs below $25k, 72.4% for AGIs $25k-50k, 75.1% for AGIs $50k-75k, 72.6% for AGIs $75k-100k, 63.2% for AGIs $100k-200k)
Taxable interest for individuals: $492 (reported on 26.5% of returns)
This zip code:
$492
Indiana:
$1,311
(% of AGI for various income ranges: 0.8% for AGIs below $25k, 0.5% for AGIs $25k-50k, 0.3% for AGIs $50k-75k)
Ordinary dividends: $633 (reported on 12.2% of returns)
Here:
$633
State:
$4,690
Net capital gain/loss in AGI: +$625 (reported on 8.2% of returns)
Here:
+$625
State:
+$10,406
Profit/loss from business: +$4,486 (reported on 14.3% of returns)
Here:
+$4,486
State:
+$11,105
Taxable individual retirement arrangement distribution: $7,275 (reported on 8.2% of returns)
46180:
$7,275
Indiana:
$13,841
Total itemized deductions: $18,438 (22% of AGI, reported on 26.5% of returns)
Here:
$18,438
State:
$20,913
Here:
21.7% of AGI
State:
18.2% of AGI
(% of AGI for various income ranges: 8.7% for AGIs $25k-50k, 9.5% for AGIs $50k-75k, 11.3% for AGIs $75k-100k, 14.5% for AGIs $100k-200k)
Charity contributions: $3,133 (reported on 18.4% of returns)
Here:
$3,133
State:
$4,697
(% of AGI for various income ranges: 2.5% for AGIs below $25k, 0.8% for AGIs $50k-75k, 1.3% for AGIs $75k-100k, 2.0% for AGIs $100k-200k)
Taxes paid: $6,123 (reported on 26.5% of returns)
46180:
$6,123
State:
$7,456
(% of AGI for various income ranges: 1.9% for AGIs $25k-50k, 3.3% for AGIs $50k-75k, 3.7% for AGIs $75k-100k, 5.5% for AGIs $100k-200k)
Earned income credit: $2,071 (reported on 14.3% of returns)
Here:
$2,071
State:
$2,265
(% of AGI for various income ranges: 4.6% for AGIs below $25k, 1.0% for AGIs $25k-50k)
Percentage of individuals using paid preparers for their 2012 taxes: 55.1%
Here:
55%
State:
53%
(% for various income ranges: 47.1% for AGIs below $25k, 57.1% for AGIs $25k-50k, 62.5% for AGIs $50k-75k, 60.0% for AGIs $75k-100k, 60.0% for AGIs $100k-200k)
Averages for the 2004 tax year for zip code 46180, filed in 2005:
Average Adjusted Gross Income (AGI) in 2004: $43,114 (Individual Income Tax Returns)
Here:
$43,114
State:
$44,790
Salary/wage: $40,904 (reported on 85.1% of returns)
Here:
$40,904
State:
$39,615
(% of AGI for various income ranges: 93.8% for AGIs below $10k, 70.4% for AGIs $10k-25k, 80.3% for AGIs $25k-50k, 85.7% for AGIs $50k-75k, 88.7% for AGIs $75k-100k, 71.9% for AGIs over 100k)
Taxable interest for individuals: $782 (reported on 44.8% of returns)
This zip code:
$782
Indiana:
$1,535
(% of AGI for various income ranges: 10.3% for AGIs below $10k, 3.2% for AGIs $10k-25k, 1.1% for AGIs $25k-50k, 0.3% for AGIs $50k-75k, 0.1% for AGIs $75k-100k, 0.1% for AGIs over 100k)
Taxable dividends: $314 (reported on 13.9% of returns)
Here:
$314
State:
$2,998
(% of AGI for various income ranges: 0.8% for AGIs below $10k, 0.2% for AGIs $25k-50k, 0.1% for AGIs $50k-75k, 0.1% for AGIs $75k-100k)
Net capital gain/loss: +$429 (reported on 8.4% of returns)
Here:
+$429
State:
+$8,619
Profit/loss from business: +$4,662 (reported on 12.9% of returns)
Here:
+$4,662
State:
+$10,071
(% of AGI for various income ranges: 5.4% for AGIs $10k-25k, 2.9% for AGIs $25k-50k, 0.5% for AGIs $50k-75k, 0.8% for AGIs $75k-100k)
Profit/loss from farming: +$842 (reported on 3.8% of returns)
Here:
+$842
State:
-$2,212
Total itemized deductions: $15,385 (21% of AGI, reported on 31.1% of returns)
Here:
$15,385
State:
$17,065
Here:
20.8% of AGI
State:
19.5% of AGI
(% of AGI for various income ranges: 7.9% for AGIs $10k-25k, 11.1% for AGIs $25k-50k, 11.3% for AGIs $50k-75k, 12.6% for AGIs $75k-100k, 11.5% for AGIs over 100k)
Charity contributions deductions: $1,637 (2% of AGI, reported on 22.5% of returns)
Here:
$1,637
State:
$3,550
Here:
2.2% of AGI
State:
3.8% of AGI
(% of AGI for various income ranges: 0.9% for AGIs $25k-50k, 1.1% for AGIs $50k-75k, 1.3% for AGIs $75k-100k, 0.6% for AGIs over 100k)
Total tax: $5,814 (reported on 76.1% of returns)
46180:
$5,814
State:
$6,914
(% of AGI for various income ranges: 3.0% for AGIs below $10k, 3.6% for AGIs $10k-25k, 6.3% for AGIs $25k-50k, 8.7% for AGIs $50k-75k, 10.6% for AGIs $75k-100k, 18.3% for AGIs over 100k)
Earned income credit: $1,435 (reported on 12.4% of returns)
Here:
$1,435
State:
$1,685
Percentage of individuals using paid preparers for their 2004 taxes: 58.4%
Here:
58%
State:
59%
(% for various income ranges: 50.5% for AGIs below $10k, 70.7% for AGIs $10k-25k, 52.7% for AGIs $25k-50k, 60.5% for AGIs $50k-75k, 56.0% for AGIs $75k-100k, 66.7% for AGIs over 100k)
Household received Food Stamps/SNAP in the past 12 months: 0 Household did not receive Food Stamps/SNAP in the past 12 months: 363
Women who had a birth in the past 12 months: 2 (2 now married, 0 unmarried) Women who did not have a birth in the past 12 months: 139 (92 now married, 47 unmarried)
Housing units in zip code 46180 with a mortgage: 154 (6 second mortgage, 6 both second mortgage and home equity loan) Houses without a mortgage: 4
Median monthly owner costs for units with a mortgage: $1,173 Median monthly owner costs for units without a mortgage: $470
Residents with income below the poverty level in 2022:
This zip code:
5.5%
Whole state:
12.6%
Residents with income below 50% of the poverty level in 2022:
This zip code:
1.3%
Whole state:
6.3%
Median number of rooms in houses and condos:
Here:
5.7
State:
6.6
Median number of rooms in apartments:
Here:
5.9
State:
4.3
Notable locations in this zip code not listed on our city pages
Cemeteries: Snoddy Family Cemetery (1), Stilesville Cemetery (2), Walnut Grove Cemetery (3), Crown Center Cemetery (4). Display/hide their locations on the map
Size of family households: 196 2-persons, 29 3-persons, 27 4-persons, 29 5-persons, 1 6-persons, 2 7-or-more-persons
Size of nonfamily households: 73 1-person, 5 2-persons
68 married couples with children.
2 single-parent households (2 women).
99.2% of residents of 46180 zip code speak English at home.
0.3% of residents speak Spanish at home (100% very well).
Foreign born population: 0 (0.0%)
:
0.0%
Whole state:
6.1%
41%American
20%English
18%German
10%Irish
7%Scottish
1%Scandinavian
0%Italian
Year of entry for the foreign-born population
02010 or later
02000 to 2009
01990 to 1999
15Before 1990
Facilities with environmental interests located in this zip code:
MIDLAND CO OP INC (10226 E SR 240 in STILESVILLE, IN)
ENFORCEMENT/COMPLIANCE ACTIVITY (Integrated Compliance Information System) STATE MASTER (Indiana facility tracking) - CRTK-2950, EPCRA, UST-16035, UNDERGROUND STORAGE TANK PROGRAM Alternative names: STILESVILLE CROPS
RADER BODY SHOP (6103 SOUTH ST in STILESVILLE, IN)
STATE MASTER (Indiana facility tracking) Conditionally Exempt Small Quantity Generators, less than 100 kg/month of hazardous waste (Resource Conservation and Recovery Act (tracking hazardous waste)) - notification Organizations: RADER EDWIN R (CONTACT/OWNER)
MIDLAND COOP (JCT 75 & US 40 in STILESVILLE, IN)
COMPLIANCE ACTIVITY (Tracking inspections of insecticide, fungicide, and rodenticide, and toxic substances)
Housing units lacking complete plumbing facilities: 3.0% Housing units lacking complete kitchen facilities: 1.9%
59.0%Bottled, tank, or LP gas
27.0%Electricity
8.2%Fuel oil, kerosene, etc.
3.4%Wood
3.1%Utility gas
Population in 1990: 1,135.
Place of birth for U.S.-born residents:
This state: 699
Midwest: 64
South: 40
West: 10
71% of the 46180 zip code residents lived in the same house 5 years ago. Out of people who lived in different houses, 37% lived in this county. Out of people who lived in different counties, 50% lived in Indiana.
94% of the 46180 zip code residents lived in the same house 1 year ago. Out of people who lived in different houses, 43% moved from this county. Out of people who lived in different houses, 9% moved from different county within same state. Out of people who lived in different houses, 52% moved from different state.
Private vs. public school enrollment:
Students in private schools in grades 1 to 8 (elementary and middle school): 4
Here:
9.5%
Indiana:
14.9%
Students in private schools in grades 9 to 12 (high school):
Here:
0.0%
Indiana:
11.4%
Students in private undergraduate colleges:
Here:
0.0%
Indiana:
22.3%
Occupation by median earnings in the past 12 months ($)
231,555Education, training, and library occupations
171,621Transportation occupations
110,330Management occupations
76,133Installation, maintenance, and repair occupations
73,045Health diagnosing and treating practitioners and other technical occupations
65,037Construction and extraction occupations
Top industries in this zip code by the number of employees in 2005:
Other Services (except Public Administration): General Automotive Repair (10-19 employees: 1 establishment, 5-9 employees: 1 establishment, 1-4 employees: 2 establishments)
Real Estate and Rental and Leasing: Formal Wear and Costume Rental (5-9: 1)
Construction: Masonry Contractors (5-9: 1)
Accommodation and Food Services: Full-Service Restaurants (5-9: 1)
Other Services (except Public Administration): Automotive Body, Paint, and Interior Repair and Maintenance (1-4: 2)
Administrative and Support and Waste Management and Remediation Services: Landscaping Services (1-4: 1)
Fatal accident statistics in 2012:
Fatal accident count: 2
Vehicles involved in fatal accidents: 3
Fatal accidents caused by drunken drivers: 1
Fatalities: 2
Persons involved in fatal accidents: 5
Pedestrians involved in fatal accidents: 1
Fatal accident statistics in 2011:
Fatal accident count: 1
Vehicles involved in fatal accidents: 1
Fatal accidents caused by drunken drivers: 0
Fatalities: 1
Persons involved in fatal accidents: 3
Pedestrians involved in fatal accidents: 0
Home Mortgage Disclosure Act Aggregated Statistics For Year 2009 (Based on 4 partial tracts)
A) FHA, FSA/RHS & VA Home Purchase Loans
B) Conventional Home Purchase Loans
C) Refinancings
D) Home Improvement Loans
F) Non-occupant Loans on < 5 Family Dwellings (A B C & D)
G) Loans On Manufactured Home Dwelling (A B C & D)
Number
Average Value
Number
Average Value
Number
Average Value
Number
Average Value
Number
Average Value
Number
Average Value
LOANS ORIGINATED
25
$121,235
13
$129,722
114
$154,266
6
$60,880
2
$118,010
4
$90,910
APPLICATIONS APPROVED, NOT ACCEPTED
2
$92,290
1
$129,170
7
$139,469
0
$0
0
$0
1
$56,400
APPLICATIONS DENIED
6
$110,920
4
$110,605
45
$154,648
4
$30,992
2
$100,015
2
$115,150
APPLICATIONS WITHDRAWN
4
$104,840
2
$86,560
24
$153,692
1
$117,950
1
$83,540
1
$119,390
FILES CLOSED FOR INCOMPLETENESS
1
$76,150
0
$0
5
$182,204
0
$0
0
$0
0
$0
Aggregated Statistics For Year 2008 (Based on 4 partial tracts)
A) FHA, FSA/RHS & VA Home Purchase Loans
B) Conventional Home Purchase Loans
C) Refinancings
D) Home Improvement Loans
F) Non-occupant Loans on < 5 Family Dwellings (A B C & D)
G) Loans On Manufactured Home Dwelling (A B C & D)
Number
Average Value
Number
Average Value
Number
Average Value
Number
Average Value
Number
Average Value
Number
Average Value
LOANS ORIGINATED
26
$127,113
28
$130,742
71
$144,651
11
$38,953
8
$116,542
6
$82,865
APPLICATIONS APPROVED, NOT ACCEPTED
2
$80,680
2
$115,815
12
$130,687
1
$72,980
1
$64,840
0
$0
APPLICATIONS DENIED
5
$116,302
7
$104,316
51
$130,795
12
$42,194
4
$85,378
5
$74,656
APPLICATIONS WITHDRAWN
1
$96,510
2
$108,000
24
$141,377
2
$73,890
1
$133,630
1
$106,770
FILES CLOSED FOR INCOMPLETENESS
1
$181,430
1
$97,750
5
$166,470
0
$0
0
$0
0
$0
Aggregated Statistics For Year 2007 (Based on 4 partial tracts)
A) FHA, FSA/RHS & VA Home Purchase Loans
B) Conventional Home Purchase Loans
C) Refinancings
D) Home Improvement Loans
F) Non-occupant Loans on < 5 Family Dwellings (A B C & D)
G) Loans On Manufactured Home Dwelling (A B C & D)
Number
Average Value
Number
Average Value
Number
Average Value
Number
Average Value
Number
Average Value
Number
Average Value
LOANS ORIGINATED
18
$123,913
62
$116,422
67
$138,644
18
$53,813
9
$72,791
8
$70,400
APPLICATIONS APPROVED, NOT ACCEPTED
1
$112,800
4
$90,970
16
$109,998
4
$60,242
1
$103,130
1
$44,340
APPLICATIONS DENIED
3
$106,930
13
$112,808
58
$145,813
20
$44,959
4
$142,805
4
$98,848
APPLICATIONS WITHDRAWN
2
$140,845
6
$141,407
26
$136,145
3
$73,520
1
$175,250
0
$0
FILES CLOSED FOR INCOMPLETENESS
1
$120,640
3
$63,677
6
$174,355
1
$139,940
0
$0
0
$0
Aggregated Statistics For Year 2006 (Based on 4 partial tracts)
A) FHA, FSA/RHS & VA Home Purchase Loans
B) Conventional Home Purchase Loans
C) Refinancings
D) Home Improvement Loans
F) Non-occupant Loans on < 5 Family Dwellings (A B C & D)
G) Loans On Manufactured Home Dwelling (A B C & D)
Number
Average Value
Number
Average Value
Number
Average Value
Number
Average Value
Number
Average Value
Number
Average Value
LOANS ORIGINATED
13
$128,133
68
$129,027
78
$141,594
18
$46,988
11
$76,354
7
$102,500
APPLICATIONS APPROVED, NOT ACCEPTED
0
$0
8
$106,265
16
$132,854
1
$65,150
1
$121,500
1
$55,490
APPLICATIONS DENIED
3
$117,783
14
$108,900
73
$128,151
18
$35,209
4
$77,132
4
$72,522
APPLICATIONS WITHDRAWN
2
$122,425
10
$103,651
39
$116,790
3
$93,187
2
$57,690
1
$81,130
FILES CLOSED FOR INCOMPLETENESS
0
$0
0
$0
10
$159,743
0
$0
0
$0
0
$0
Aggregated Statistics For Year 2005 (Based on 4 partial tracts)
A) FHA, FSA/RHS & VA Home Purchase Loans
B) Conventional Home Purchase Loans
C) Refinancings
D) Home Improvement Loans
F) Non-occupant Loans on < 5 Family Dwellings (A B C & D)
G) Loans On Manufactured Home Dwelling (A B C & D)
Number
Average Value
Number
Average Value
Number
Average Value
Number
Average Value
Number
Average Value
Number
Average Value
LOANS ORIGINATED
7
$126,026
55
$123,014
112
$122,042
17
$56,379
8
$80,626
8
$93,539
APPLICATIONS APPROVED, NOT ACCEPTED
2
$104,150
11
$98,163
17
$99,751
2
$46,900
2
$152,310
1
$47,050
APPLICATIONS DENIED
1
$117,620
24
$102,350
83
$118,956
19
$54,180
5
$124,986
9
$86,702
APPLICATIONS WITHDRAWN
1
$82,040
10
$103,462
46
$115,058
7
$153,213
2
$124,385
2
$83,540
FILES CLOSED FOR INCOMPLETENESS
0
$0
3
$86,330
21
$163,820
0
$0
0
$0
0
$0
Aggregated Statistics For Year 2004 (Based on 4 partial tracts)
A) FHA, FSA/RHS & VA Home Purchase Loans
B) Conventional Home Purchase Loans
C) Refinancings
D) Home Improvement Loans
F) Non-occupant Loans on < 5 Family Dwellings (A B C & D)
G) Loans On Manufactured Home Dwelling (A B C & D)
Number
Average Value
Number
Average Value
Number
Average Value
Number
Average Value
Number
Average Value
Number
Average Value
LOANS ORIGINATED
13
$115,264
49
$126,278
117
$125,305
19
$48,138
8
$84,662
9
$80,596
APPLICATIONS APPROVED, NOT ACCEPTED
0
$0
10
$103,732
18
$104,854
2
$38,850
2
$138,720
1
$68,130
APPLICATIONS DENIED
3
$76,127
16
$84,957
72
$116,648
10
$50,439
3
$54,830
7
$54,521
APPLICATIONS WITHDRAWN
3
$77,173
5
$92,924
37
$121,950
1
$77,040
2
$55,185
1
$139,850
FILES CLOSED FOR INCOMPLETENESS
0
$0
3
$61,143
14
$126,821
0
$0
1
$36,490
1
$92,510
Aggregated Statistics For Year 2003 (Based on 4 partial tracts)
A) FHA, FSA/RHS & VA Home Purchase Loans
B) Conventional Home Purchase Loans
C) Refinancings
D) Home Improvement Loans
F) Non-occupant Loans on < 5 Family Dwellings (A B C & D)
Number
Average Value
Number
Average Value
Number
Average Value
Number
Average Value
Number
Average Value
LOANS ORIGINATED
18
$117,149
44
$137,277
240
$111,589
7
$27,279
9
$80,330
APPLICATIONS APPROVED, NOT ACCEPTED
1
$60,410
5
$141,916
27
$112,907
3
$24,943
2
$63,940
APPLICATIONS DENIED
2
$117,565
17
$73,731
86
$111,371
11
$35,185
5
$54,332
APPLICATIONS WITHDRAWN
1
$69,060
7
$178,091
37
$119,155
1
$123,090
1
$58,810
FILES CLOSED FOR INCOMPLETENESS
0
$0
2
$152,350
11
$109,838
1
$47,310
1
$90,160
Aggregated Statistics For Year 2002 (Based on 4 partial tracts)
A) FHA, FSA/RHS & VA Home Purchase Loans
B) Conventional Home Purchase Loans
C) Refinancings
D) Home Improvement Loans
F) Non-occupant Loans on < 5 Family Dwellings (A B C & D)
Number
Average Value
Number
Average Value
Number
Average Value
Number
Average Value
Number
Average Value
LOANS ORIGINATED
11
$106,285
36
$114,924
175
$119,223
10
$22,165
10
$95,535
APPLICATIONS APPROVED, NOT ACCEPTED
1
$119,130
3
$90,977
30
$108,411
4
$22,292
1
$50,980
APPLICATIONS DENIED
3
$82,500
6
$55,632
71
$99,550
10
$16,713
5
$66,638
APPLICATIONS WITHDRAWN
1
$98,180
5
$92,116
23
$94,783
1
$28,870
2
$55,270
FILES CLOSED FOR INCOMPLETENESS
0
$0
2
$128,875
19
$110,362
0
$0
1
$49,800
Aggregated Statistics For Year 2001 (Based on 4 partial tracts)
A) FHA, FSA/RHS & VA Home Purchase Loans
B) Conventional Home Purchase Loans
C) Refinancings
D) Home Improvement Loans
F) Non-occupant Loans on < 5 Family Dwellings (A B C & D)
Number
Average Value
Number
Average Value
Number
Average Value
Number
Average Value
Number
Average Value
LOANS ORIGINATED
14
$111,349
41
$103,948
158
$105,014
18
$24,858
6
$67,153
APPLICATIONS APPROVED, NOT ACCEPTED
2
$113,455
6
$118,728
31
$89,047
4
$31,038
1
$119,890
APPLICATIONS DENIED
2
$81,105
10
$72,144
67
$88,131
14
$28,545
2
$63,940
APPLICATIONS WITHDRAWN
1
$165,580
5
$116,584
30
$97,539
1
$28,050
1
$32,350
FILES CLOSED FOR INCOMPLETENESS
0
$0
1
$87,660
17
$102,626
1
$25,640
0
$0
Aggregated Statistics For Year 2000 (Based on 4 partial tracts)
A) FHA, FSA/RHS & VA Home Purchase Loans
B) Conventional Home Purchase Loans
C) Refinancings
D) Home Improvement Loans
F) Non-occupant Loans on < 5 Family Dwellings (A B C & D)
Number
Average Value
Number
Average Value
Number
Average Value
Number
Average Value
Number
Average Value
LOANS ORIGINATED
13
$95,331
39
$102,536
62
$83,912
18
$25,258
4
$56,500
APPLICATIONS APPROVED, NOT ACCEPTED
1
$123,530
6
$88,945
20
$78,466
9
$27,518
1
$51,570
APPLICATIONS DENIED
3
$80,700
16
$68,091
44
$78,983
11
$37,375
2
$66,955
APPLICATIONS WITHDRAWN
1
$99,830
4
$93,188
20
$92,872
3
$22,423
0
$0
FILES CLOSED FOR INCOMPLETENESS
0
$0
2
$92,685
7
$94,004
0
$0
0
$0
Aggregated Statistics For Year 1999 (Based on 2 partial tracts)
A) FHA, FSA/RHS & VA Home Purchase Loans
B) Conventional Home Purchase Loans
C) Refinancings
D) Home Improvement Loans
F) Non-occupant Loans on < 5 Family Dwellings (A B C & D)
Detailed PMIC statistics for the following Tracts:2111.00
, 5104.00
2002 - 2018 National Fire Incident Reporting System (NFIRS) incidents
According to the data from the years 2002 - 2018 the average number of fire incidents per year is 26. The highest number of fire incidents - 60 took place in 2007, and the least - 4 in 2016. The data has a decreasing trend.
When looking into fire subcategories, the most reports belonged to: Outside Fires (49.1%), and Structure Fires (24.4%).
Fire incident types reported to NFIRS in Zip Code 46180


+$842
-$2,212
 Nearest zip codes: 46125, 46103, 46157, 46121, 46118, 46128.


 According to the data from the years 2002 - 2018 the average number of fire incidents per year is 26. The highest number of fire incidents - 60 took place in 2007, and the least - 4 in 2016. The data has a decreasing trend.
 When looking into fire subcategories, the most reports belonged to: Outside Fires (49.1%), and Structure Fires (24.4%).