Estimated zip code population in 2022: 2,099 Zip code population in 2010: 2,508 Zip code population in 2000: 2,219
Houses and condos: 804 Renter-occupied apartments: 33
% of renters here:
4%
State:
29%
March 2022 cost of living index in zip code 46130: 87.5 (less than average, U.S. average is 100)
Land area: 29.8 sq. mi. Water area: 0.0 sq. mi.
Population density: 70 people per square mile
(very low).
OSM Map
General Map
Google Map
MSN Map
OSM Map
General Map
Google Map
MSN Map
OSM Map
General Map
Google Map
MSN Map
OSM Map
General Map
Google Map
MSN Map
Please wait while loading the map...
Real estate property taxes paid for housing units in 2022:
This zip code:
0.5% ($1,421)
Indiana:
0.7% ($1,467)
Median real estate property taxes paid for housing units with mortgages in 2022: $1,370 (0.4%) Median real estate property taxes paid for housing units with no mortgage in 2022: $1,558 (0.6%)
Business Search- 14 Million verified businesses
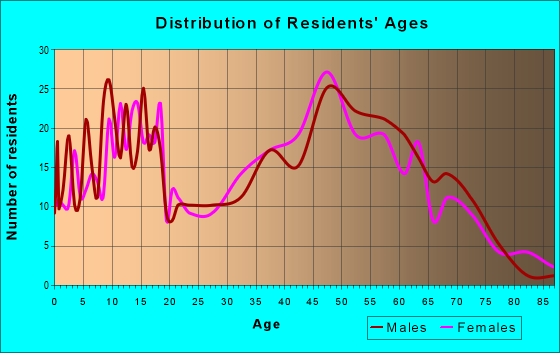
Males: 1,173
(55.9%)
Females: 926
(44.1%)
For population 25 years and over in 46130:
High school or higher: 89.8%
Bachelor's degree or higher: 41.4%
Graduate or professional degree: 14.9%
Unemployed: 3.4%
Mean travel time to work (commute): 37.5 minutes
For population 15 years and over in 46130:
Never married: 24.3%
Now married: 62.1%
Separated: 0.0%
Widowed: 7.5%
Divorced: 6.1%
Zip code 46130 compared to state average:
Black race population percentage significantly below state average.
Hispanic race population percentage significantly below state average.
Median age above state average.
Foreign-born population percentage significantly below state average.
Renting percentage significantly below state average.
Length of stay since moving in significantly above state average.
Estimated median house/condo value in 2022: $292,248
46130:
$292,248
Indiana:
$208,700
According to our research of Indiana and other state lists, there was 1 registered sex offender living in 46130 zip code as of May 28, 2024. The ratio of all residents to sex offenders in zip code 46130 is 2,448 to 1. The ratio of registered sex offenders to all residents in this zip code is much lower than the state average.
Median resident age:
This zip code:
43.6 years
Indiana median age:
38.2 years
Average household size:
This zip code:
2.6 people
Indiana:
2.4 people
Averages for the 2020 tax year for zip code 46130, filed in 2021:
Average Adjusted Gross Income (AGI) in 2020: $70,485 (Individual Income Tax Returns)
Here:
$70,485
State:
$64,978
Salary/wage: $64,268 (reported on 80.0% of returns)
Here:
$64,268
State:
$55,245
(% of AGI for various income ranges: 931.2% for AGIs below $25k, 3663.2% for AGIs $25k-50k, 5928.0% for AGIs $50k-75k, 9091.8% for AGIs $75k-100k, 16653.8% for AGIs $100k-200k)
Taxable interest for individuals: $1,100 (reported on 31.2% of returns)
This zip code:
$1,100
Indiana:
$1,351
(% of AGI for various income ranges: 13.2% for AGIs below $25k, 16.3% for AGIs $25k-50k, 38.0% for AGIs $50k-75k, 32.7% for AGIs $75k-100k, 146.9% for AGIs $100k-200k)
Ordinary dividends: $2,657 (reported on 18.4% of returns)
Here:
$2,657
State:
$5,827
(% of AGI for various income ranges: 10.8% for AGIs below $25k, 51.6% for AGIs $25k-50k, 84.0% for AGIs $50k-75k, 17.3% for AGIs $75k-100k, 213.1% for AGIs $100k-200k)
Net capital gain/loss in AGI: +$5,050 (reported on 16.0% of returns)
Here:
+$5,050
State:
+$17,730
(% of AGI for various income ranges: 18.4% for AGIs below $25k, 92.7% for AGIs $50k-75k, 516.2% for AGIs $100k-200k)
Profit/loss from business: +$10,100 (reported on 13.6% of returns)
Here:
+$10,100
State:
+$12,144
(% of AGI for various income ranges: 102.4% for AGIs below $25k, 110.0% for AGIs $25k-50k, 230.7% for AGIs $50k-75k, 267.3% for AGIs $75k-100k, 382.5% for AGIs $100k-200k)
Taxable individual retirement arrangement distribution: $16,587 (reported on 12.0% of returns)
46130:
$16,587
Indiana:
$18,302
(% of AGI for various income ranges: 90.8% for AGIs below $25k, 164.7% for AGIs $25k-50k, 185.3% for AGIs $50k-75k, 583.6% for AGIs $75k-100k, 642.5% for AGIs $100k-200k)
Total itemized deductions: $30,440 (reported on 4.0% of returns)
Here:
$30,440
State:
$35,601
(% of AGI for various income ranges: 951.2% for AGIs $100k-200k)
Charity contributions: $10,350 (reported on 3.2% of returns)
Here:
$10,350
State:
$15,596
(% of AGI for various income ranges: 258.8% for AGIs $100k-200k)
Taxes paid: $8,500 (reported on 4.0% of returns)
46130:
$8,500
State:
$7,542
(% of AGI for various income ranges: 265.6% for AGIs $100k-200k)
Earned income credit: $1,815 (reported on 10.4% of returns)
Here:
$1,815
State:
$2,298
(% of AGI for various income ranges: 60.8% for AGIs below $25k, 44.2% for AGIs $25k-50k)
Percentage of individuals using paid preparers for their 2020 taxes: 93.6%
Here:
94%
State:
94%
(% for various income ranges: 91.7% for AGIs below $25k, 96.0% for AGIs $25k-50k, 95.0% for AGIs $50k-75k, 93.3% for AGIs $75k-100k, 92.0% for AGIs $100k-200k, 100.0% for AGIs over 200k)
Averages for the 2012 tax year for zip code 46130, filed in 2013:
Average Adjusted Gross Income (AGI) in 2012: $61,680 (Individual Income Tax Returns)
Here:
$61,680
State:
$52,932
Salary/wage: $49,783 (reported on 85.5% of returns)
Here:
$49,783
State:
$45,173
(% of AGI for various income ranges: 65.1% for AGIs below $25k, 71.6% for AGIs $25k-50k, 77.9% for AGIs $50k-75k, 70.8% for AGIs $75k-100k, 78.2% for AGIs $100k-200k, 38.9% for AGIs over 200k)
Taxable interest for individuals: $683 (reported on 35.0% of returns)
This zip code:
$683
Indiana:
$1,311
(% of AGI for various income ranges: 0.7% for AGIs below $25k, 0.8% for AGIs $25k-50k, 0.7% for AGIs $50k-75k, 0.2% for AGIs $75k-100k, 0.2% for AGIs $100k-200k, 0.2% for AGIs over 200k)
Ordinary dividends: $1,946 (reported on 20.5% of returns)
Here:
$1,946
State:
$4,690
(% of AGI for various income ranges: 0.6% for AGIs below $25k, 0.9% for AGIs $25k-50k, 0.8% for AGIs $50k-75k, 0.4% for AGIs $75k-100k, 0.9% for AGIs $100k-200k)
Net capital gain/loss in AGI: +$4,763 (reported on 16.2% of returns)
Here:
+$4,763
State:
+$10,406
(% of AGI for various income ranges: 0.8% for AGIs $75k-100k, 3.9% for AGIs $100k-200k)
Profit/loss from business: +$12,544 (reported on 15.4% of returns)
Here:
+$12,544
State:
+$11,105
(% of AGI for various income ranges: 6.4% for AGIs below $25k, 2.9% for AGIs $25k-50k, 2.0% for AGIs $50k-75k, 5.2% for AGIs $75k-100k, 4.2% for AGIs $100k-200k)
Taxable individual retirement arrangement distribution: $14,507 (reported on 12.0% of returns)
46130:
$14,507
Indiana:
$13,841
(% of AGI for various income ranges: 4.1% for AGIs below $25k, 2.4% for AGIs $25k-50k, 2.0% for AGIs $50k-75k, 5.0% for AGIs $75k-100k, 3.8% for AGIs $100k-200k)
Total itemized deductions: $17,898 (17% of AGI, reported on 34.2% of returns)
Here:
$17,898
State:
$20,913
Here:
16.7% of AGI
State:
18.2% of AGI
(% of AGI for various income ranges: 11.4% for AGIs $25k-50k, 9.1% for AGIs $50k-75k, 11.1% for AGIs $75k-100k, 11.8% for AGIs $100k-200k, 8.0% for AGIs over 200k)
Charity contributions: $2,993 (reported on 25.6% of returns)
Here:
$2,993
State:
$4,697
(% of AGI for various income ranges: 1.0% for AGIs $25k-50k, 1.0% for AGIs $50k-75k, 1.7% for AGIs $75k-100k, 1.6% for AGIs $100k-200k, 0.9% for AGIs over 200k)
Taxes paid: $6,378 (reported on 34.2% of returns)
46130:
$6,378
State:
$7,456
(% of AGI for various income ranges: 2.5% for AGIs $25k-50k, 2.6% for AGIs $50k-75k, 3.6% for AGIs $75k-100k, 4.8% for AGIs $100k-200k, 4.2% for AGIs over 200k)
Earned income credit: $1,906 (reported on 13.7% of returns)
Here:
$1,906
State:
$2,265
(% of AGI for various income ranges: 5.1% for AGIs below $25k, 1.2% for AGIs $25k-50k)
Percentage of individuals using paid preparers for their 2012 taxes: 51.3%
Here:
51%
State:
53%
(% for various income ranges: 45.7% for AGIs below $25k, 48.1% for AGIs $25k-50k, 52.2% for AGIs $50k-75k, 58.3% for AGIs $75k-100k, 58.8% for AGIs $100k-200k, 66.7% for AGIs over 200k)
Averages for the 2004 tax year for zip code 46130, filed in 2005:
Average Adjusted Gross Income (AGI) in 2004: $48,389 (Individual Income Tax Returns)
Here:
$48,389
State:
$44,790
Salary/wage: $44,707 (reported on 84.0% of returns)
Here:
$44,707
State:
$39,615
(% of AGI for various income ranges: 83.3% for AGIs below $10k, 68.8% for AGIs $10k-25k, 78.2% for AGIs $25k-50k, 79.1% for AGIs $50k-75k, 85.0% for AGIs $75k-100k, 73.2% for AGIs over 100k)
Taxable interest for individuals: $1,437 (reported on 46.3% of returns)
This zip code:
$1,437
Indiana:
$1,535
(% of AGI for various income ranges: 2.6% for AGIs below $10k, 3.2% for AGIs $10k-25k, 1.6% for AGIs $25k-50k, 2.3% for AGIs $50k-75k, 0.3% for AGIs $75k-100k, 0.7% for AGIs over 100k)
Taxable dividends: $1,161 (reported on 22.7% of returns)
Here:
$1,161
State:
$2,998
(% of AGI for various income ranges: 2.5% for AGIs below $10k, 0.5% for AGIs $10k-25k, 0.6% for AGIs $25k-50k, 0.4% for AGIs $50k-75k, 0.2% for AGIs $75k-100k, 0.7% for AGIs over 100k)
Net capital gain/loss: +$3,881 (reported on 15.4% of returns)
Here:
+$3,881
State:
+$8,619
(% of AGI for various income ranges: -1.4% for AGIs below $10k, 0.0% for AGIs $10k-25k, 0.0% for AGIs $25k-50k, 0.5% for AGIs $50k-75k, 0.2% for AGIs $75k-100k, 3.6% for AGIs over 100k)
Profit/loss from business: +$8,842 (reported on 14.9% of returns)
Here:
+$8,842
State:
+$10,071
(% of AGI for various income ranges: 8.2% for AGIs below $10k, 7.9% for AGIs $10k-25k, 4.7% for AGIs $25k-50k, 4.0% for AGIs $50k-75k, 0.9% for AGIs $75k-100k, 0.2% for AGIs over 100k)
IRA payment deduction: $2,560 (reported on 2.2% of returns)
46130:
$2,560
Indiana:
$2,840
Total itemized deductions: $15,816 (21% of AGI, reported on 40.2% of returns)
Here:
$15,816
State:
$17,065
Here:
20.7% of AGI
State:
19.5% of AGI
(% of AGI for various income ranges: 13.3% for AGIs $10k-25k, 11.4% for AGIs $25k-50k, 14.5% for AGIs $50k-75k, 14.5% for AGIs $75k-100k, 13.0% for AGIs over 100k)
Charity contributions deductions: $2,477 (3% of AGI, reported on 32.7% of returns)
Here:
$2,477
State:
$3,550
Here:
3.0% of AGI
State:
3.8% of AGI
(% of AGI for various income ranges: 0.4% for AGIs $10k-25k, 1.3% for AGIs $25k-50k, 1.7% for AGIs $50k-75k, 1.7% for AGIs $75k-100k, 2.2% for AGIs over 100k)
Total tax: $6,352 (reported on 80.1% of returns)
46130:
$6,352
State:
$6,914
(% of AGI for various income ranges: 2.5% for AGIs below $10k, 4.7% for AGIs $10k-25k, 7.1% for AGIs $25k-50k, 8.9% for AGIs $50k-75k, 10.3% for AGIs $75k-100k, 15.7% for AGIs over 100k)
Earned income credit: $1,654 (reported on 9.1% of returns)
Here:
$1,654
State:
$1,685
Percentage of individuals using paid preparers for their 2004 taxes: 58.7%
Here:
59%
State:
59%
(% for various income ranges: 52.8% for AGIs below $10k, 55.8% for AGIs $10k-25k, 61.0% for AGIs $25k-50k, 59.4% for AGIs $50k-75k, 61.7% for AGIs $75k-100k, 63.8% for AGIs over 100k)
Household received Food Stamps/SNAP in the past 12 months: 32 Household did not receive Food Stamps/SNAP in the past 12 months: 771
Women who had a birth in the past 12 months: 33 (22 now married, 10 unmarried) Women who did not have a birth in the past 12 months: 396 (228 now married, 168 unmarried)
Housing units in zip code 46130 with a mortgage: 532 (71 second mortgage, 73 both second mortgage and home equity loan) Median monthly owner costs for units with a mortgage: $1,463 Median monthly owner costs for units without a mortgage: $546
Residents with income below the poverty level in 2022:
This zip code:
10.8%
Whole state:
12.6%
Residents with income below 50% of the poverty level in 2022:
This zip code:
6.4%
Whole state:
6.3%
Median number of rooms in houses and condos:
Here:
7.2
State:
6.6
Median number of rooms in apartments:
Here:
5.3
State:
4.3
Notable locations in this zip code not listed on our city pages
Cemeteries: Mohr Cemetery (1), Murnan Cemetery (2), Fairview Cemetery (3), Cummingham Cemetery (4), Old Sugar Creek Cemetery (5). Display/hide their locations on the map
In group quarters: 7 (-1 institutionalized population)
Size of family households: 199 2-persons, 130 3-persons, 76 4-persons, 129 5-persons, 10 7-or-more-persons
Size of nonfamily households: 230 1-person, 17 2-persons, 11 3-persons
489 married couples with children.
11 single-parent households (11 women).
96.4% of residents of 46130 zip code speak English at home.
1.7% of residents speak Spanish at home (46% very well, 43% well, 11% not at all).
1.5% of residents speak other Indo-European language at home (52% very well, 48% well).
Foreign born population: 4 (0.2%) (0.0% of them are naturalized citizens)
:
0.2%
Whole state:
6.1%
100%Honduras
31%German
20%American
14%Polish
11%English
4%Irish
2%French
2%European
Year of entry for the foreign-born population
52010 or later
02000 to 2009
01990 to 1999
0Before 1990
Facilities with environmental interests located in this zip code:
NORRIS CORNER RESTAURANT (11493 N DIVISION RD in FOUNTAINTOWN, IN)
(Integrated Compliance Information System) - ICIS-05-1997-0648, FORMAL ENFORCEMENT ACTION STATE MASTER (Indiana facility tracking)
38.7%Electricity
25.9%Utility gas
18.1%Bottled, tank, or LP gas
12.2%Fuel oil, kerosene, etc.
2.6%Wood
1.7%Other fuel
1.4%No fuel used
Population in 1990: 1,555. Population change in the 1990s: +664 (+42.7%).
Place of birth for U.S.-born residents:
This state: 1,518
Northeast: 142
Midwest: 314
South: 97
West: 10
68% of the 46130 zip code residents lived in the same house 5 years ago. Out of people who lived in different houses, 25% lived in this county. Out of people who lived in different counties, 50% lived in Indiana.
96% of the 46130 zip code residents lived in the same house 1 year ago. Out of people who lived in different houses, 13% moved from this county. Out of people who lived in different houses, 82% moved from different county within same state. Out of people who lived in different houses, 16% moved from abroad.
Private vs. public school enrollment:
Students in private schools in grades 1 to 8 (elementary and middle school): 64
Here:
25.1%
Indiana:
14.9%
Students in private schools in grades 9 to 12 (high school):
Here:
0.0%
Indiana:
11.4%
Students in private undergraduate colleges: 23
Here:
71.7%
Indiana:
22.3%
Occupation by median earnings in the past 12 months ($)
115,337Construction and extraction occupations
79,994Management occupations
76,945Business and financial operations occupations
64,463Health diagnosing and treating practitioners and other technical occupations
62,524Production occupations
58,706Sales and related occupations
Top industries in this zip code by the number of employees in 2005:
Administrative and Support and Waste Management and Remediation Services: Landscaping Services (10-19 employees: 3 establishments, 5-9 employees: 3 establishments, 1-4 employees: 1 establishment)
Real Estate and Rental and Leasing: All Other Consumer Goods Rental (20-49: 1)
Construction: Poured Concrete Foundation and Structure Contractors (10-19: 1)
Construction: Site Preparation Contractors (5-9: 1, 1-4: 2)
Professional, Scientific, and Technical Services: Offices of Lawyers (5-9: 1)
Health Care and Social Assistance: Residential Mental Retardation Facilities (5-9: 1)
People in group quarters in 2010:
6 people in group homes intended for adults
Fatal accident statistics in 2013:
Fatal accident count: 1
Vehicles involved in fatal accidents: 1
Fatal accidents caused by drunken drivers: 0
Fatalities: 1
Persons involved in fatal accidents: 1
Pedestrians involved in fatal accidents: 0
Fatal accident statistics in 2010:
Fatal accident count: 1
Vehicles involved in fatal accidents: 1
Fatal accidents caused by drunken drivers: 0
Fatalities: 1
Persons involved in fatal accidents: 1
Pedestrians involved in fatal accidents: 0
Home Mortgage Disclosure Act Aggregated Statistics For Year 2009 (Based on 4 partial tracts)
A) FHA, FSA/RHS & VA Home Purchase Loans
B) Conventional Home Purchase Loans
C) Refinancings
D) Home Improvement Loans
F) Non-occupant Loans on < 5 Family Dwellings (A B C & D)
G) Loans On Manufactured Home Dwelling (A B C & D)
Number
Average Value
Number
Average Value
Number
Average Value
Number
Average Value
Number
Average Value
Number
Average Value
LOANS ORIGINATED
13
$127,259
9
$128,729
83
$150,476
6
$96,983
2
$101,560
1
$150,510
APPLICATIONS APPROVED, NOT ACCEPTED
0
$0
0
$0
9
$136,646
0
$0
0
$0
0
$0
APPLICATIONS DENIED
4
$105,285
1
$101,850
30
$167,590
3
$32,840
2
$43,405
1
$110,660
APPLICATIONS WITHDRAWN
2
$79,160
1
$47,270
19
$164,329
1
$118,770
0
$0
0
$0
FILES CLOSED FOR INCOMPLETENESS
1
$61,530
0
$0
2
$196,605
0
$0
0
$0
0
$0
Aggregated Statistics For Year 2008 (Based on 4 partial tracts)
A) FHA, FSA/RHS & VA Home Purchase Loans
B) Conventional Home Purchase Loans
C) Refinancings
D) Home Improvement Loans
F) Non-occupant Loans on < 5 Family Dwellings (A B C & D)
G) Loans On Manufactured Home Dwelling (A B C & D)
Number
Average Value
Number
Average Value
Number
Average Value
Number
Average Value
Number
Average Value
Number
Average Value
LOANS ORIGINATED
14
$133,769
17
$168,912
50
$136,533
7
$37,060
3
$136,137
1
$185,550
APPLICATIONS APPROVED, NOT ACCEPTED
1
$84,650
2
$203,305
13
$114,537
2
$13,565
0
$0
0
$0
APPLICATIONS DENIED
6
$85,908
4
$59,412
44
$134,504
11
$51,287
2
$51,885
0
$0
APPLICATIONS WITHDRAWN
1
$89,040
3
$94,000
19
$137,340
2
$127,750
0
$0
0
$0
FILES CLOSED FOR INCOMPLETENESS
0
$0
0
$0
5
$143,766
0
$0
0
$0
0
$0
Aggregated Statistics For Year 2007 (Based on 4 partial tracts)
A) FHA, FSA/RHS & VA Home Purchase Loans
B) Conventional Home Purchase Loans
C) Refinancings
D) Home Improvement Loans
F) Non-occupant Loans on < 5 Family Dwellings (A B C & D)
G) Loans On Manufactured Home Dwelling (A B C & D)
Number
Average Value
Number
Average Value
Number
Average Value
Number
Average Value
Number
Average Value
Number
Average Value
LOANS ORIGINATED
6
$129,402
39
$117,773
61
$119,987
10
$37,390
5
$123,688
0
$0
APPLICATIONS APPROVED, NOT ACCEPTED
0
$0
7
$99,626
12
$125,133
2
$14,480
1
$160,100
0
$0
APPLICATIONS DENIED
1
$93,760
7
$120,783
53
$136,655
16
$38,062
1
$64,440
2
$112,470
APPLICATIONS WITHDRAWN
0
$0
6
$102,943
22
$126,025
2
$70,100
0
$0
0
$0
FILES CLOSED FOR INCOMPLETENESS
0
$0
2
$153,170
7
$164,056
0
$0
0
$0
0
$0
Aggregated Statistics For Year 2006 (Based on 4 partial tracts)
A) FHA, FSA/RHS & VA Home Purchase Loans
B) Conventional Home Purchase Loans
C) Refinancings
D) Home Improvement Loans
F) Non-occupant Loans on < 5 Family Dwellings (A B C & D)
G) Loans On Manufactured Home Dwelling (A B C & D)
Number
Average Value
Number
Average Value
Number
Average Value
Number
Average Value
Number
Average Value
Number
Average Value
LOANS ORIGINATED
5
$103,830
57
$105,433
73
$105,437
13
$51,272
8
$68,390
1
$112,930
APPLICATIONS APPROVED, NOT ACCEPTED
0
$0
6
$86,247
17
$89,851
1
$29,370
1
$78,520
1
$98,050
APPLICATIONS DENIED
0
$0
15
$83,510
64
$126,030
7
$44,590
5
$89,936
2
$104,200
APPLICATIONS WITHDRAWN
0
$0
8
$92,700
25
$114,454
3
$80,620
1
$49,140
0
$0
FILES CLOSED FOR INCOMPLETENESS
0
$0
2
$71,550
11
$172,358
0
$0
1
$173,970
0
$0
Aggregated Statistics For Year 2005 (Based on 4 partial tracts)
A) FHA, FSA/RHS & VA Home Purchase Loans
B) Conventional Home Purchase Loans
C) Refinancings
D) Home Improvement Loans
F) Non-occupant Loans on < 5 Family Dwellings (A B C & D)
G) Loans On Manufactured Home Dwelling (A B C & D)
Number
Average Value
Number
Average Value
Number
Average Value
Number
Average Value
Number
Average Value
Number
Average Value
LOANS ORIGINATED
7
$108,199
50
$114,039
90
$110,396
12
$47,620
6
$68,677
0
$0
APPLICATIONS APPROVED, NOT ACCEPTED
0
$0
3
$129,333
13
$118,023
3
$64,713
2
$61,645
0
$0
APPLICATIONS DENIED
1
$162,080
22
$84,543
75
$146,245
12
$139,612
2
$125,545
1
$178,550
APPLICATIONS WITHDRAWN
0
$0
4
$127,395
40
$115,742
6
$107,405
2
$76,105
0
$0
FILES CLOSED FOR INCOMPLETENESS
0
$0
3
$91,900
27
$162,600
0
$0
1
$73,170
0
$0
Aggregated Statistics For Year 2004 (Based on 4 partial tracts)
A) FHA, FSA/RHS & VA Home Purchase Loans
B) Conventional Home Purchase Loans
C) Refinancings
D) Home Improvement Loans
F) Non-occupant Loans on < 5 Family Dwellings (A B C & D)
G) Loans On Manufactured Home Dwelling (A B C & D)
Number
Average Value
Number
Average Value
Number
Average Value
Number
Average Value
Number
Average Value
Number
Average Value
LOANS ORIGINATED
9
$120,299
47
$113,019
91
$115,950
9
$55,209
6
$71,530
3
$81,533
APPLICATIONS APPROVED, NOT ACCEPTED
0
$0
8
$117,770
14
$110,990
1
$14,970
0
$0
1
$78,470
APPLICATIONS DENIED
2
$108,575
15
$106,042
52
$109,978
10
$36,162
2
$97,035
2
$47,690
APPLICATIONS WITHDRAWN
2
$91,315
5
$84,910
34
$114,999
2
$65,975
1
$99,550
2
$105,830
FILES CLOSED FOR INCOMPLETENESS
0
$0
3
$102,557
15
$140,541
1
$40,020
0
$0
0
$0
Aggregated Statistics For Year 2003 (Based on 4 partial tracts)
A) FHA, FSA/RHS & VA Home Purchase Loans
B) Conventional Home Purchase Loans
C) Refinancings
D) Home Improvement Loans
E) Loans on Dwellings For 5+ Families
F) Non-occupant Loans on < 5 Family Dwellings (A B C & D)
Number
Average Value
Number
Average Value
Number
Average Value
Number
Average Value
Number
Average Value
Number
Average Value
LOANS ORIGINATED
11
$107,917
37
$112,114
231
$107,448
15
$20,577
1
$229,910
7
$78,484
APPLICATIONS APPROVED, NOT ACCEPTED
1
$95,880
3
$116,193
31
$103,073
3
$23,763
0
$0
1
$86,600
APPLICATIONS DENIED
1
$114,540
10
$146,801
68
$107,520
9
$26,476
0
$0
3
$71,073
APPLICATIONS WITHDRAWN
1
$89,810
4
$137,618
32
$103,451
1
$22,250
0
$0
2
$61,600
FILES CLOSED FOR INCOMPLETENESS
0
$0
1
$45,230
9
$115,557
0
$0
0
$0
0
$0
Aggregated Statistics For Year 2002 (Based on 4 partial tracts)
A) FHA, FSA/RHS & VA Home Purchase Loans
B) Conventional Home Purchase Loans
C) Refinancings
D) Home Improvement Loans
F) Non-occupant Loans on < 5 Family Dwellings (A B C & D)
Number
Average Value
Number
Average Value
Number
Average Value
Number
Average Value
Number
Average Value
LOANS ORIGINATED
9
$112,731
35
$113,096
170
$106,669
19
$22,119
7
$75,430
APPLICATIONS APPROVED, NOT ACCEPTED
2
$61,875
3
$137,933
26
$97,875
3
$10,660
2
$60,670
APPLICATIONS DENIED
2
$92,835
6
$90,837
46
$91,145
9
$17,932
1
$27,660
APPLICATIONS WITHDRAWN
2
$103,030
4
$95,265
32
$89,534
1
$17,900
0
$0
FILES CLOSED FOR INCOMPLETENESS
0
$0
1
$118,770
9
$108,753
0
$0
0
$0
Aggregated Statistics For Year 2001 (Based on 4 partial tracts)
A) FHA, FSA/RHS & VA Home Purchase Loans
B) Conventional Home Purchase Loans
C) Refinancings
D) Home Improvement Loans
F) Non-occupant Loans on < 5 Family Dwellings (A B C & D)
Number
Average Value
Number
Average Value
Number
Average Value
Number
Average Value
Number
Average Value
LOANS ORIGINATED
17
$96,716
34
$120,318
154
$94,876
17
$23,110
6
$63,562
APPLICATIONS APPROVED, NOT ACCEPTED
1
$65,830
5
$82,154
21
$79,064
5
$24,654
3
$61,507
APPLICATIONS DENIED
1
$114,370
5
$65,266
65
$89,449
18
$16,743
1
$57,240
APPLICATIONS WITHDRAWN
0
$0
5
$105,912
35
$97,408
4
$22,870
0
$0
FILES CLOSED FOR INCOMPLETENESS
1
$76,420
1
$126,550
14
$87,529
0
$0
0
$0
Aggregated Statistics For Year 2000 (Based on 4 partial tracts)
A) FHA, FSA/RHS & VA Home Purchase Loans
B) Conventional Home Purchase Loans
C) Refinancings
D) Home Improvement Loans
F) Non-occupant Loans on < 5 Family Dwellings (A B C & D)
Number
Average Value
Number
Average Value
Number
Average Value
Number
Average Value
Number
Average Value
LOANS ORIGINATED
11
$97,499
40
$104,406
53
$79,819
23
$17,221
5
$63,804
APPLICATIONS APPROVED, NOT ACCEPTED
2
$88,270
7
$90,986
16
$80,879
8
$19,744
1
$87,400
APPLICATIONS DENIED
2
$94,270
13
$48,366
49
$61,540
14
$14,223
3
$62,850
APPLICATIONS WITHDRAWN
1
$101,520
3
$97,123
15
$58,732
3
$56,463
0
$0
FILES CLOSED FOR INCOMPLETENESS
0
$0
0
$0
6
$82,567
0
$0
0
$0
Aggregated Statistics For Year 1999 (Based on 2 partial tracts)
A) FHA, FSA/RHS & VA Home Purchase Loans
B) Conventional Home Purchase Loans
C) Refinancings
D) Home Improvement Loans
F) Non-occupant Loans on < 5 Family Dwellings (A B C & D)
Detailed PMIC statistics for the following Tracts:7101.00
, 7102.00
2003 - 2018 National Fire Incident Reporting System (NFIRS) incidents
Based on the data from the years 2003 - 2018 the average number of fire incidents per year is 10. The highest number of fire incidents - 20 took place in 2017, and the least - 3 in 2003. The data has an increasing trend.
When looking into fire subcategories, the most reports belonged to: Structure Fires (44.2%), and Outside Fires (43.0%).
Fire incident types reported to NFIRS in Zip Code 46130


 Nearest zip codes: 46126, 46163, 46161, 46140, 46259, 46110.


 Based on the data from the years 2003 - 2018 the average number of fire incidents per year is 10. The highest number of fire incidents - 20 took place in 2017, and the least - 3 in 2003. The data has an increasing trend.
 When looking into fire subcategories, the most reports belonged to: Structure Fires (44.2%), and Outside Fires (43.0%).