Estimated zip code population in 2022: 2,196 Zip code population in 2010: 2,655 Zip code population in 2000: 2,606
Houses and condos: 920 Renter-occupied apartments: 208
% of renters here:
23%
State:
29%
March 2022 cost of living index in zip code 46161: 86.3 (less than average, U.S. average is 100)
Land area: 36.4 sq. mi. Water area: 0.2 sq. mi.
Population density: 60 people per square mile
(very low).
OSM Map
General Map
Google Map
MSN Map
OSM Map
General Map
Google Map
MSN Map
OSM Map
General Map
Google Map
MSN Map
OSM Map
General Map
Google Map
MSN Map
Please wait while loading the map...
Real estate property taxes paid for housing units in 2022:
This zip code:
0.6% ($1,273)
Indiana:
0.7% ($1,467)
Median real estate property taxes paid for housing units with mortgages in 2022: $1,277 (0.6%) Median real estate property taxes paid for housing units with no mortgage in 2022: $1,310 (0.9%)
Estimated median house/condo value in 2022: $198,242
46161:
$198,242
Indiana:
$208,700
Median resident age:
This zip code:
44.6 years
Indiana median age:
38.2 years
Average household size:
This zip code:
2.3 people
Indiana:
2.4 people
Averages for the 2020 tax year for zip code 46161, filed in 2021:
Average Adjusted Gross Income (AGI) in 2020: $65,166 (Individual Income Tax Returns)
Here:
$65,166
State:
$64,978
Salary/wage: $55,117 (reported on 82.6% of returns)
Here:
$55,117
State:
$55,245
(% of AGI for various income ranges: 1027.3% for AGIs below $25k, 3425.6% for AGIs $25k-50k, 6053.1% for AGIs $50k-75k, 9281.7% for AGIs $75k-100k, 16520.0% for AGIs $100k-200k)
Taxable interest for individuals: $877 (reported on 25.6% of returns)
This zip code:
$877
Indiana:
$1,351
(% of AGI for various income ranges: 9.5% for AGIs below $25k, 19.6% for AGIs $25k-50k, 17.5% for AGIs $50k-75k, 10.0% for AGIs $75k-100k, 50.9% for AGIs $100k-200k)
Ordinary dividends: $4,990 (reported on 16.5% of returns)
Here:
$4,990
State:
$5,827
(% of AGI for various income ranges: 30.9% for AGIs below $25k, 16.4% for AGIs $25k-50k, 38.1% for AGIs $50k-75k, 50.0% for AGIs $75k-100k, 100.9% for AGIs $100k-200k)
Net capital gain/loss in AGI: +$34,488 (reported on 13.2% of returns)
Here:
+$34,488
State:
+$17,730
(% of AGI for various income ranges: 12.8% for AGIs $25k-50k, 66.9% for AGIs $50k-75k, 30.0% for AGIs $75k-100k, 4861.8% for AGIs $100k-200k)
Profit/loss from business: +$8,800 (reported on 11.6% of returns)
Here:
+$8,800
State:
+$12,144
(% of AGI for various income ranges: 63.6% for AGIs below $25k, 137.6% for AGIs $25k-50k, 189.4% for AGIs $50k-75k, 261.7% for AGIs $75k-100k, 119.1% for AGIs $100k-200k)
Taxable individual retirement arrangement distribution: $13,333 (reported on 9.9% of returns)
46161:
$13,333
Indiana:
$18,302
(% of AGI for various income ranges: 79.1% for AGIs below $25k, 136.0% for AGIs $25k-50k, 176.2% for AGIs $50k-75k, 670.0% for AGIs $75k-100k)
Total itemized deductions: $55,625 (reported on 3.3% of returns)
Here:
$55,625
State:
$35,601
(% of AGI for various income ranges: 2022.7% for AGIs $100k-200k)
Charity contributions: $7,100 (reported on 2.5% of returns)
Here:
$7,100
State:
$15,596
(% of AGI for various income ranges: 193.6% for AGIs $100k-200k)
Taxes paid: $7,100 (reported on 3.3% of returns)
46161:
$7,100
State:
$7,542
(% of AGI for various income ranges: 258.2% for AGIs $100k-200k)
Earned income credit: $2,256 (reported on 13.2% of returns)
Here:
$2,256
State:
$2,298
(% of AGI for various income ranges: 85.0% for AGIs below $25k, 69.6% for AGIs $25k-50k)
Percentage of individuals using paid preparers for their 2020 taxes: 95.0%
Here:
95%
State:
94%
(% for various income ranges: 93.8% for AGIs below $25k, 96.8% for AGIs $25k-50k, 90.5% for AGIs $50k-75k, 94.1% for AGIs $75k-100k, 100.0% for AGIs $100k-200k, 100.0% for AGIs over 200k)
Averages for the 2012 tax year for zip code 46161, filed in 2013:
Average Adjusted Gross Income (AGI) in 2012: $47,796 (Individual Income Tax Returns)
Here:
$47,796
State:
$52,932
Salary/wage: $42,838 (reported on 83.9% of returns)
Here:
$42,838
State:
$45,173
(% of AGI for various income ranges: 66.8% for AGIs below $25k, 79.2% for AGIs $25k-50k, 78.0% for AGIs $50k-75k, 80.0% for AGIs $75k-100k, 105.4% for AGIs $100k-200k)
Taxable interest for individuals: $767 (reported on 26.6% of returns)
This zip code:
$767
Indiana:
$1,311
(% of AGI for various income ranges: 1.4% for AGIs below $25k, 0.3% for AGIs $25k-50k, 0.4% for AGIs $50k-75k, 0.1% for AGIs $75k-100k, 0.7% for AGIs $100k-200k)
Ordinary dividends: $3,047 (reported on 15.3% of returns)
Here:
$3,047
State:
$4,690
(% of AGI for various income ranges: 1.0% for AGIs below $25k, 0.2% for AGIs $25k-50k, 0.9% for AGIs $50k-75k, 0.4% for AGIs $75k-100k, 2.7% for AGIs $100k-200k)
Profit/loss from business: +$7,918 (reported on 13.7% of returns)
Here:
+$7,918
State:
+$11,105
(% of AGI for various income ranges: 6.8% for AGIs below $25k, 2.3% for AGIs $25k-50k, 1.7% for AGIs $50k-75k, 1.2% for AGIs $75k-100k, 2.8% for AGIs $100k-200k)
Taxable individual retirement arrangement distribution: $10,829 (reported on 11.3% of returns)
46161:
$10,829
Indiana:
$13,841
(% of AGI for various income ranges: 3.9% for AGIs below $25k, 3.1% for AGIs $25k-50k, 2.0% for AGIs $50k-75k, 7.1% for AGIs $75k-100k)
Total itemized deductions: $18,533 (20% of AGI, reported on 24.2% of returns)
Here:
$18,533
State:
$20,913
Here:
19.8% of AGI
State:
18.2% of AGI
(% of AGI for various income ranges: 9.7% for AGIs below $25k, 6.9% for AGIs $25k-50k, 7.6% for AGIs $50k-75k, 9.6% for AGIs $75k-100k, 17.3% for AGIs $100k-200k)
Charity contributions: $3,427 (reported on 17.7% of returns)
Here:
$3,427
State:
$4,697
(% of AGI for various income ranges: 1.0% for AGIs $25k-50k, 0.5% for AGIs $50k-75k, 1.7% for AGIs $75k-100k, 2.8% for AGIs $100k-200k)
Taxes paid: $5,732 (reported on 25.0% of returns)
46161:
$5,732
State:
$7,456
(% of AGI for various income ranges: 0.9% for AGIs below $25k, 1.4% for AGIs $25k-50k, 1.9% for AGIs $50k-75k, 3.0% for AGIs $75k-100k, 7.6% for AGIs $100k-200k)
Earned income credit: $2,126 (reported on 15.3% of returns)
Here:
$2,126
State:
$2,265
(% of AGI for various income ranges: 5.0% for AGIs below $25k, 1.1% for AGIs $25k-50k)
Percentage of individuals using paid preparers for their 2012 taxes: 54.0%
Here:
54%
State:
53%
(% for various income ranges: 50.0% for AGIs below $25k, 50.0% for AGIs $25k-50k, 55.6% for AGIs $50k-75k, 63.6% for AGIs $75k-100k, 81.8% for AGIs $100k-200k)
Averages for the 2004 tax year for zip code 46161, filed in 2005:
Average Adjusted Gross Income (AGI) in 2004: $42,138 (Individual Income Tax Returns)
Here:
$42,138
State:
$44,790
Salary/wage: $38,433 (reported on 87.4% of returns)
Here:
$38,433
State:
$39,615
(% of AGI for various income ranges: 91.3% for AGIs below $10k, 63.8% for AGIs $10k-25k, 84.8% for AGIs $25k-50k, 84.0% for AGIs $50k-75k, 86.7% for AGIs $75k-100k, 69.4% for AGIs over 100k)
Taxable interest for individuals: $1,048 (reported on 41.1% of returns)
This zip code:
$1,048
Indiana:
$1,535
(% of AGI for various income ranges: 5.3% for AGIs below $10k, 2.8% for AGIs $10k-25k, 0.9% for AGIs $25k-50k, 1.0% for AGIs $50k-75k, 0.3% for AGIs $75k-100k, 0.7% for AGIs over 100k)
Taxable dividends: $1,359 (reported on 17.0% of returns)
Here:
$1,359
State:
$2,998
(% of AGI for various income ranges: 2.1% for AGIs below $10k, 1.6% for AGIs $10k-25k, 0.5% for AGIs $25k-50k, 0.2% for AGIs $50k-75k, 0.2% for AGIs $75k-100k, 0.7% for AGIs over 100k)
Net capital gain/loss: +$2,434 (reported on 14.4% of returns)
Here:
+$2,434
State:
+$8,619
(% of AGI for various income ranges: -2.0% for AGIs below $10k, 0.1% for AGIs $10k-25k, -0.1% for AGIs $25k-50k, 0.0% for AGIs $50k-75k, -0.1% for AGIs $75k-100k, 4.0% for AGIs over 100k)
Profit/loss from business: +$5,094 (reported on 15.8% of returns)
Here:
+$5,094
State:
+$10,071
(% of AGI for various income ranges: 9.5% for AGIs below $10k, 6.4% for AGIs $10k-25k, 2.6% for AGIs $25k-50k, 2.0% for AGIs $50k-75k, 0.6% for AGIs $75k-100k, -0.3% for AGIs over 100k)
IRA payment deduction: $1,947 (reported on 1.6% of returns)
46161:
$1,947
Indiana:
$2,840
Total itemized deductions: $17,056 (23% of AGI, reported on 32.6% of returns)
Here:
$17,056
State:
$17,065
Here:
23.1% of AGI
State:
19.5% of AGI
(% of AGI for various income ranges: 11.7% for AGIs $10k-25k, 14.9% for AGIs $25k-50k, 13.3% for AGIs $50k-75k, 13.7% for AGIs $75k-100k, 12.5% for AGIs over 100k)
Charity contributions deductions: $2,270 (3% of AGI, reported on 25.1% of returns)
Here:
$2,270
State:
$3,550
Here:
3.0% of AGI
State:
3.8% of AGI
(% of AGI for various income ranges: 1.1% for AGIs $10k-25k, 0.9% for AGIs $25k-50k, 1.6% for AGIs $50k-75k, 1.4% for AGIs $75k-100k, 1.8% for AGIs over 100k)
Total tax: $5,126 (reported on 76.9% of returns)
46161:
$5,126
State:
$6,914
(% of AGI for various income ranges: 2.6% for AGIs below $10k, 4.1% for AGIs $10k-25k, 6.8% for AGIs $25k-50k, 7.8% for AGIs $50k-75k, 9.8% for AGIs $75k-100k, 15.9% for AGIs over 100k)
Earned income credit: $1,702 (reported on 13.3% of returns)
Here:
$1,702
State:
$1,685
Percentage of individuals using paid preparers for their 2004 taxes: 62.0%
Here:
62%
State:
59%
(% for various income ranges: 51.3% for AGIs below $10k, 65.8% for AGIs $10k-25k, 65.0% for AGIs $25k-50k, 62.1% for AGIs $50k-75k, 62.4% for AGIs $75k-100k, 66.7% for AGIs over 100k)
Likely homosexual households (counted as self-reported same-sex unmarried-partner households)
Lesbian couples: 1.5% of all households
Gay men: 1.3% of all households
Household received Food Stamps/SNAP in the past 12 months: 56 Household did not receive Food Stamps/SNAP in the past 12 months: 830
Women who had a birth in the past 12 months: 19 (11 now married, 7 unmarried) Women who did not have a birth in the past 12 months: 503 (223 now married, 280 unmarried)
Housing units in zip code 46161 with a mortgage: 460 (61 second mortgage, 63 both second mortgage and home equity loan) Houses without a mortgage: 6
Median monthly owner costs for units with a mortgage: $1,186 Median monthly owner costs for units without a mortgage: $438
Residents with income below the poverty level in 2022:
This zip code:
9.0%
Whole state:
12.6%
Residents with income below 50% of the poverty level in 2022:
This zip code:
4.8%
Whole state:
6.3%
Median number of rooms in houses and condos:
Here:
6.9
State:
6.6
Median number of rooms in apartments:
Here:
5.5
State:
4.3
Notable locations in this zip code not listed on our city pages
299 married couples with children.
129 single-parent households (26 men, 103 women).
98.5% of residents of 46161 zip code speak English at home.
0.1% of residents speak Spanish at home (100% very well).
0.7% of residents speak other Indo-European language at home (100% very well).
Foreign born population: 12 (0.6%) (100.0% of them are naturalized citizens)
This zip code:
0.6%
Whole state:
6.1%
92%Honduras
26%American
18%German
16%English
12%Irish
4%Dutch
2%British
2%European
Year of entry for the foreign-born population
02010 or later
02000 to 2009
01990 to 1999
11Before 1990
Facilities with environmental interests located in this zip code:
CALDWELL GRAVEL SALES & SANITARY LANDFILL (11380 N 300 E in MORRISTOWN, IN)
AIR MAJOR (AIRS/AFS) AIR SYNTHETIC MINOR (AIRS/AFS) STATE MASTER (Indiana facility tracking) - ACES-OP-14500049, AIR PROGRAM, ACES-OP-14500050, ACES-OP-14500051, ACES-OP-14505056, ACES-OP-14505202, UST-12583, UNDERGROUND STORAGE TANK PROGRAM CRITERIA AND HAZARDOUS AIR POLLUTANT INVENTORY (Inventory of air pollution sources) National Pollutant Discharge Elimination System NON-MAJOR (Tracking pollutant discharge elimination systems) - permit Business SIC classification: CONSTRUCTION SAND AND GRAVEL; ASPHALT PAVING MIXTURES AND BLOCKS; ASPHALT FELTS AND COATINGS; CUT STONE AND STONE PRODUCTS Business NAICS classification: CUT STONE AND STONE PRODUCT MANUFACTURING. Organizations: DANA CALDWELL PRESIDENT (CONTACT/OPERATOR)
, CGS SERVICES INC (CONTACT/OWNER)
Alternative names: ASPHALT PAVERS SUPPLY, INC., CALDWEELL GRAVEL SALES, INC., CALDWELL GRAVEL SALES, INC., CALDWELL GRAVEL SALES (CGS), CALDWELL LANDFIL
CENTRAL SOYA COMPANY INCORPORATED (700 N. RANGELINE RD. in MORRISTOWN, IN)
AIR MAJOR (AIRS/AFS) STATE MASTER (Indiana facility tracking) CRITERIA AND HAZARDOUS AIR POLLUTANT INVENTORY (Inventory of air pollution sources) National Pollutant Discharge Elimination System NON-MAJOR (Tracking pollutant discharge elimination systems) - permit Conditionally Exempt Small Quantity Generators, less than 100 kg/month of hazardous waste (Resource Conservation and Recovery Act (tracking hazardous waste)) - notification USED OIL PROGRAM (Resource Conservation and Recovery Act (tracking hazardous waste)) TRI REPORTER (Tracking of toxic chemicals releasing facilities) Business SIC classification: SOYBEAN OIL MILLS Business NAICS classification: SOYBEAN PROCESSING.; FATS AND OILS REFINING AND BLENDING. Organizations: BUNGE NORTH AMERICA (CONTACT/OPERATOR)
, DAVID SMITH (CONTACT/OPERATOR)
, CENTRAL SOYA COMPANY, INC. (CONTACT/OWNER)
, CENTRAL SOYA CO INC (CONTACT/OWNER)
, BUNGE NORTH AMERICA (CONTACT/OWNER)
Alternative names: BUNGE NORTH AMERICA, CENTRAL SOYA CO., INC. SHELBY
MORRISTOWN HEALTH CENTER (219 E MAIN ST in MORRISTOWN, IN)
STATE MASTER (Indiana facility tracking) - UST-7800, UNDERGROUND STORAGE TANK PROGRAM (Resource Conservation and Recovery Act (tracking hazardous waste)) Organizations: PADGETT JOE (CONTACT/OWNER)
Alternative names: PADGETT CHEV INC
MORRISTOWN JR SR HIGH SCHOOL (223 S PATTERSON in MORRISTOWN, IN)
(National Center for Education Statistics) - STATE ID-7661 Conditionally Exempt Small Quantity Generators, less than 100 kg/month of hazardous waste (Resource Conservation and Recovery Act (tracking hazardous waste)) Organizations: SHELBY EASTERN SCHOOLS (SCHOOL DISTRICT)
CGS SERVICES INC RECYCLING SITE (805 E INDUSTRIAL DR in MORRISTOWN, IN)
STATE MASTER (Indiana facility tracking) - CRTK-3744, EPCRA TSD (Resource Conservation and Recovery Act (tracking hazardous waste)) TRI REPORTER (Tracking of toxic chemicals releasing facilities) Business SIC classification: WOOD PRESERVING Organizations: INDIANA WOOD PRESERVING INC (CONTACT/OWNER)
Alternative names: INDIANA WOOD PRESERVING INC
MORRISTOWN ELEMENTARY SCHOOL (307 W MAIN ST - PO BOX 910 in MORRISTOWN, IN)
(National Center for Education Statistics) - STATE ID-7663 Organizations: SHELBY EASTERN SCHOOLS (SCHOOL DISTRICT)
PSEG AMERICAS DEVELOP (MORRISTOWN INDUSTRIAL PARK in MORRISTOWN, IN)
AIR MINOR (AIRS/AFS) AIR PROGRAM (Clean Air Markets Division Business System) STATE MASTER (Indiana facility tracking) Business SIC classification: ELECTRIC SERVICES Organizations: PSEG MORRISTOWN ENERGY COMPANY, LLC (OWNER/OPERATOR)
Alternative names: PSEG MORRISTOWN ENERGY FACILITY
RESOURCE RECOVERY OF INDIANA (INDUSTRIAL PK in MORRISTOWN, IN)
STATE MASTER (Indiana facility tracking) (Resource Conservation and Recovery Act (tracking hazardous waste))
MORRISTOWN MUNICIPAL WWTP (461 WASTEWATER DR in MORRISTOWN, IN)
STATE MASTER (Indiana facility tracking) National Pollutant Discharge Elimination System NON-MAJOR (Tracking pollutant discharge elimination systems) - permit Business SIC classification: SEWERAGE SYSTEMS Organizations: SHAWN MASSINGALE CERT# 16926 (CONTACT/OPERATOR)
, TOWN COUNCIL PRESIDENT (CONTACT/OWNER)
Alternative names: MORRISTOWN MUNICIPAL STP
NABISCO INC (COUNTRY RD 500 E in MORRISTOWN, IN)
STATE MASTER (Indiana facility tracking) (Resource Conservation and Recovery Act (tracking hazardous waste))
MACMILLAN BLOEDEL (INDUSTRIAL DR in MORRISTOWN, IN)
STATE MASTER (Indiana facility tracking) (Resource Conservation and Recovery Act (tracking hazardous waste))
DETROIT STEEL PRODUCTS CO INC (511 RANGELINE RD in MORRISTOWN, IN)
STATE MASTER (Indiana facility tracking) Conditionally Exempt Small Quantity Generators, less than 100 kg/month of hazardous waste (Resource Conservation and Recovery Act (tracking hazardous waste)) - notification
Housing units lacking complete plumbing facilities: 1.6% Housing units lacking complete kitchen facilities: 1.8%
52.2%Utility gas
26.9%Electricity
17.7%Bottled, tank, or LP gas
3.4%Wood
Population in 1990: 2,215. Population change in the 1990s: +391 (+17.7%).
Place of birth for U.S.-born residents:
This state: 1,858
Northeast: 18
Midwest: 106
South: 146
West: 35
61% of the 46161 zip code residents lived in the same house 5 years ago. Out of people who lived in different houses, 48% lived in this county. Out of people who lived in different counties, 50% lived in Indiana.
87% of the 46161 zip code residents lived in the same house 1 year ago. Out of people who lived in different houses, 25% moved from this county. Out of people who lived in different houses, 68% moved from different county within same state. Out of people who lived in different houses, 1% moved from different state. Out of people who lived in different houses, 4% moved from abroad.
Private vs. public school enrollment:
Students in private schools in grades 1 to 8 (elementary and middle school): 28
Here:
11.7%
Indiana:
14.9%
Students in private schools in grades 9 to 12 (high school): 17
Here:
12.6%
Indiana:
11.4%
Students in private undergraduate colleges:
Here:
0.0%
Indiana:
22.3%
Occupation by median earnings in the past 12 months ($)
91,558Computer and mathematical occupations
89,152Transportation occupations
78,273Construction and extraction occupations
77,800Health diagnosing and treating practitioners and other technical occupations
54,223Health technologists and technicians
54,109Architecture and engineering occupations
Top industries in this zip code by the number of employees in 2005:
Health Care and Social Assistance: Nursing Care Facilities (100-249 employees: 1 establishment)
Mining: Support Activities for Nonmetallic Minerals (except Fuels) (50-99: 1)
Accommodation and Food Services: Full-Service Restaurants (20-49: 2)
Accommodation and Food Services: Limited-Service Restaurants (20-49: 1, 1-4: 2)
Construction: Electrical Contractors (20-49: 1)
People in group quarters in 2010:
91 people in nursing facilities/skilled-nursing facilities
People in group quarters in 2000:
36 people in nursing homes
Fatal accident statistics in 2011:
Fatal accident count: 1
Vehicles involved in fatal accidents: 1
Fatal accidents caused by drunken drivers: 1
Fatalities: 1
Persons involved in fatal accidents: 1
Pedestrians involved in fatal accidents: 1
Fatal accident statistics in 2010:
Fatal accident count: 1
Vehicles involved in fatal accidents: 1
Fatal accidents caused by drunken drivers: 0
Fatalities: 1
Persons involved in fatal accidents: 1
Pedestrians involved in fatal accidents: 0
Home Mortgage Disclosure Act Aggregated Statistics For Year 2009 (Based on 2 partial tracts)
A) FHA, FSA/RHS & VA Home Purchase Loans
B) Conventional Home Purchase Loans
C) Refinancings
D) Home Improvement Loans
E) Loans on Dwellings For 5+ Families
F) Non-occupant Loans on < 5 Family Dwellings (A B C & D)
G) Loans On Manufactured Home Dwelling (A B C & D)
Number
Average Value
Number
Average Value
Number
Average Value
Number
Average Value
Number
Average Value
Number
Average Value
Number
Average Value
LOANS ORIGINATED
12
$108,760
11
$103,575
82
$145,111
5
$76,310
1
$3,145,890
3
$80,773
2
$139,760
APPLICATIONS APPROVED, NOT ACCEPTED
0
$0
1
$69,080
11
$110,821
0
$0
0
$0
1
$70,140
0
$0
APPLICATIONS DENIED
6
$113,012
0
$0
32
$159,818
4
$9,565
0
$0
4
$48,358
2
$123,285
APPLICATIONS WITHDRAWN
2
$92,995
1
$69,080
18
$168,572
0
$0
0
$0
0
$0
0
$0
FILES CLOSED FOR INCOMPLETENESS
2
$68,550
0
$0
1
$96,710
0
$0
0
$0
0
$0
0
$0
Aggregated Statistics For Year 2008 (Based on 2 partial tracts)
A) FHA, FSA/RHS & VA Home Purchase Loans
B) Conventional Home Purchase Loans
C) Refinancings
D) Home Improvement Loans
F) Non-occupant Loans on < 5 Family Dwellings (A B C & D)
G) Loans On Manufactured Home Dwelling (A B C & D)
Number
Average Value
Number
Average Value
Number
Average Value
Number
Average Value
Number
Average Value
Number
Average Value
LOANS ORIGINATED
18
$106,871
16
$129,396
58
$128,819
2
$11,690
4
$81,038
3
$137,810
APPLICATIONS APPROVED, NOT ACCEPTED
1
$89,280
2
$107,875
14
$80,469
1
$19,130
1
$165,800
0
$0
APPLICATIONS DENIED
10
$83,961
6
$60,580
56
$123,569
11
$48,889
3
$47,827
1
$57,390
APPLICATIONS WITHDRAWN
1
$136,040
5
$105,218
28
$134,368
2
$145,070
0
$0
1
$136,040
FILES CLOSED FOR INCOMPLETENESS
1
$99,900
0
$0
9
$129,543
0
$0
0
$0
1
$151,980
Aggregated Statistics For Year 2007 (Based on 2 partial tracts)
A) FHA, FSA/RHS & VA Home Purchase Loans
B) Conventional Home Purchase Loans
C) Refinancings
D) Home Improvement Loans
F) Non-occupant Loans on < 5 Family Dwellings (A B C & D)
G) Loans On Manufactured Home Dwelling (A B C & D)
Number
Average Value
Number
Average Value
Number
Average Value
Number
Average Value
Number
Average Value
Number
Average Value
LOANS ORIGINATED
9
$129,780
46
$105,402
58
$109,377
10
$37,198
6
$150,387
1
$125,410
APPLICATIONS APPROVED, NOT ACCEPTED
1
$76,520
11
$90,242
13
$108,732
0
$0
0
$0
0
$0
APPLICATIONS DENIED
1
$105,220
5
$141,564
53
$122,964
18
$34,541
1
$61,640
2
$136,040
APPLICATIONS WITHDRAWN
0
$0
3
$107,343
17
$91,714
2
$95,650
1
$106,280
0
$0
FILES CLOSED FOR INCOMPLETENESS
0
$0
2
$164,735
6
$204,235
0
$0
0
$0
0
$0
Aggregated Statistics For Year 2006 (Based on 2 partial tracts)
A) FHA, FSA/RHS & VA Home Purchase Loans
B) Conventional Home Purchase Loans
C) Refinancings
D) Home Improvement Loans
F) Non-occupant Loans on < 5 Family Dwellings (A B C & D)
G) Loans On Manufactured Home Dwelling (A B C & D)
Number
Average Value
Number
Average Value
Number
Average Value
Number
Average Value
Number
Average Value
Number
Average Value
LOANS ORIGINATED
4
$105,748
71
$104,828
84
$95,968
10
$55,053
15
$73,971
1
$184,930
APPLICATIONS APPROVED, NOT ACCEPTED
0
$0
6
$71,208
14
$94,361
1
$7,440
1
$53,140
2
$57,390
APPLICATIONS DENIED
0
$0
17
$82,336
80
$117,360
6
$43,043
9
$71,208
3
$104,510
APPLICATIONS WITHDRAWN
0
$0
12
$69,968
20
$111,594
4
$68,020
0
$0
0
$0
FILES CLOSED FOR INCOMPLETENESS
0
$0
4
$79,710
10
$141,778
0
$0
1
$213,620
0
$0
Aggregated Statistics For Year 2005 (Based on 2 partial tracts)
A) FHA, FSA/RHS & VA Home Purchase Loans
B) Conventional Home Purchase Loans
C) Refinancings
D) Home Improvement Loans
F) Non-occupant Loans on < 5 Family Dwellings (A B C & D)
G) Loans On Manufactured Home Dwelling (A B C & D)
Number
Average Value
Number
Average Value
Number
Average Value
Number
Average Value
Number
Average Value
Number
Average Value
LOANS ORIGINATED
2
$115,845
58
$106,665
102
$98,663
13
$42,839
6
$63,237
1
$119,030
APPLICATIONS APPROVED, NOT ACCEPTED
0
$0
3
$94,590
15
$109,823
1
$58,450
3
$84,317
0
$0
APPLICATIONS DENIED
1
$153,040
30
$81,658
101
$105,712
11
$53,623
1
$58,450
1
$211,500
APPLICATIONS WITHDRAWN
0
$0
3
$114,073
55
$101,565
5
$100,116
3
$75,103
0
$0
FILES CLOSED FOR INCOMPLETENESS
0
$0
1
$85,020
37
$164,849
0
$0
1
$97,780
1
$100,970
Aggregated Statistics For Year 2004 (Based on 2 partial tracts)
A) FHA, FSA/RHS & VA Home Purchase Loans
B) Conventional Home Purchase Loans
C) Refinancings
D) Home Improvement Loans
F) Non-occupant Loans on < 5 Family Dwellings (A B C & D)
G) Loans On Manufactured Home Dwelling (A B C & D)
Number
Average Value
Number
Average Value
Number
Average Value
Number
Average Value
Number
Average Value
Number
Average Value
LOANS ORIGINATED
12
$97,955
51
$108,343
92
$105,633
11
$59,516
7
$75,914
3
$112,303
APPLICATIONS APPROVED, NOT ACCEPTED
0
$0
10
$145,178
14
$99,599
0
$0
0
$0
1
$73,330
APPLICATIONS DENIED
3
$121,160
18
$119,919
62
$103,606
10
$31,778
2
$79,180
2
$60,580
APPLICATIONS WITHDRAWN
2
$105,215
5
$82,898
46
$99,626
1
$30,820
1
$111,590
3
$125,057
FILES CLOSED FOR INCOMPLETENESS
0
$0
4
$144,010
17
$108,093
0
$0
0
$0
1
$130,720
Aggregated Statistics For Year 2003 (Based on 2 partial tracts)
A) FHA, FSA/RHS & VA Home Purchase Loans
B) Conventional Home Purchase Loans
C) Refinancings
D) Home Improvement Loans
E) Loans on Dwellings For 5+ Families
F) Non-occupant Loans on < 5 Family Dwellings (A B C & D)
Number
Average Value
Number
Average Value
Number
Average Value
Number
Average Value
Number
Average Value
Number
Average Value
LOANS ORIGINATED
10
$94,695
41
$95,704
247
$101,534
15
$19,697
2
$256,135
9
$45,464
APPLICATIONS APPROVED, NOT ACCEPTED
2
$106,810
2
$27,635
31
$91,435
4
$14,880
0
$0
1
$73,330
APPLICATIONS DENIED
0
$0
15
$150,776
79
$101,612
10
$28,802
0
$0
6
$79,178
APPLICATIONS WITHDRAWN
0
$0
2
$52,075
38
$105,021
2
$17,535
0
$0
2
$83,960
FILES CLOSED FOR INCOMPLETENESS
0
$0
0
$0
11
$128,599
0
$0
0
$0
0
$0
Aggregated Statistics For Year 2002 (Based on 2 partial tracts)
A) FHA, FSA/RHS & VA Home Purchase Loans
B) Conventional Home Purchase Loans
C) Refinancings
D) Home Improvement Loans
F) Non-occupant Loans on < 5 Family Dwellings (A B C & D)
Number
Average Value
Number
Average Value
Number
Average Value
Number
Average Value
Number
Average Value
LOANS ORIGINATED
9
$111,003
47
$95,064
192
$102,566
18
$25,921
7
$92,767
APPLICATIONS APPROVED, NOT ACCEPTED
3
$80,063
2
$137,635
29
$88,762
5
$13,816
1
$49,950
APPLICATIONS DENIED
2
$138,695
6
$78,293
55
$89,411
7
$17,916
0
$0
APPLICATIONS WITHDRAWN
4
$114,782
4
$77,585
39
$81,590
0
$0
0
$0
FILES CLOSED FOR INCOMPLETENESS
1
$83,960
0
$0
10
$109,256
0
$0
0
$0
Aggregated Statistics For Year 2001 (Based on 2 partial tracts)
A) FHA, FSA/RHS & VA Home Purchase Loans
B) Conventional Home Purchase Loans
C) Refinancings
D) Home Improvement Loans
F) Non-occupant Loans on < 5 Family Dwellings (A B C & D)
Number
Average Value
Number
Average Value
Number
Average Value
Number
Average Value
Number
Average Value
LOANS ORIGINATED
24
$95,032
36
$105,867
164
$87,649
23
$27,309
5
$56,116
APPLICATIONS APPROVED, NOT ACCEPTED
2
$73,335
7
$71,814
22
$72,222
5
$29,120
4
$54,202
APPLICATIONS DENIED
1
$78,650
9
$52,431
91
$88,715
19
$17,788
3
$42,513
APPLICATIONS WITHDRAWN
0
$0
4
$105,748
45
$93,692
4
$22,320
1
$148,790
FILES CLOSED FOR INCOMPLETENESS
1
$97,780
1
$205,120
15
$77,230
0
$0
0
$0
Aggregated Statistics For Year 2000 (Based on 2 partial tracts)
A) FHA, FSA/RHS & VA Home Purchase Loans
B) Conventional Home Purchase Loans
C) Refinancings
D) Home Improvement Loans
F) Non-occupant Loans on < 5 Family Dwellings (A B C & D)
Number
Average Value
Number
Average Value
Number
Average Value
Number
Average Value
Number
Average Value
LOANS ORIGINATED
17
$91,776
49
$97,778
63
$70,634
27
$11,848
7
$67,260
APPLICATIONS APPROVED, NOT ACCEPTED
3
$98,487
12
$88,832
23
$85,579
10
$19,024
1
$106,280
APPLICATIONS DENIED
3
$83,960
19
$42,176
69
$59,440
21
$13,462
3
$78,647
APPLICATIONS WITHDRAWN
0
$0
4
$105,748
20
$52,396
3
$51,370
0
$0
FILES CLOSED FOR INCOMPLETENESS
0
$0
1
$63,770
7
$73,789
0
$0
0
$0
Aggregated Statistics For Year 1999 (Based on 1 partial tract)
A) FHA, FSA/RHS & VA Home Purchase Loans
B) Conventional Home Purchase Loans
C) Refinancings
D) Home Improvement Loans
F) Non-occupant Loans on < 5 Family Dwellings (A B C & D)
Detailed PMIC statistics for the following Tracts:7101.00
2003 - 2018 National Fire Incident Reporting System (NFIRS) incidents
According to the data from the years 2003 - 2018 the average number of fire incidents per year is 17. The highest number of fire incidents - 34 took place in 2010, and the least - 2 in 2014. The data has an increasing trend.
When looking into fire subcategories, the most reports belonged to: Structure Fires (45.9%), and Outside Fires (39.4%).
Fire incident types reported to NFIRS in Zip Code 46161

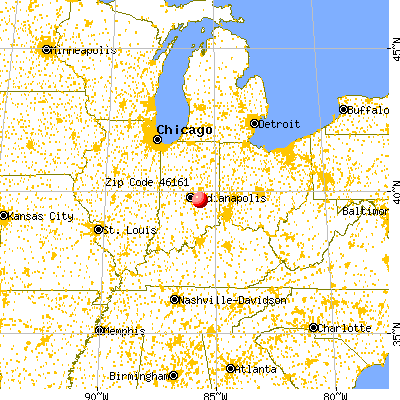


 Nearest zip codes: 46144, 46104, 46130, 46115, 46140, 46146.


 According to the data from the years 2003 - 2018 the average number of fire incidents per year is 17. The highest number of fire incidents - 34 took place in 2010, and the least - 2 in 2014. The data has an increasing trend.
 When looking into fire subcategories, the most reports belonged to: Structure Fires (45.9%), and Outside Fires (39.4%).