Estimated zip code population in 2022: 8,331 Zip code population in 2010: 7,957 Zip code population in 2000: 6,410
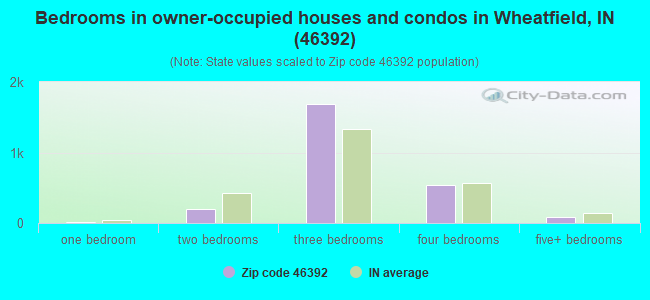
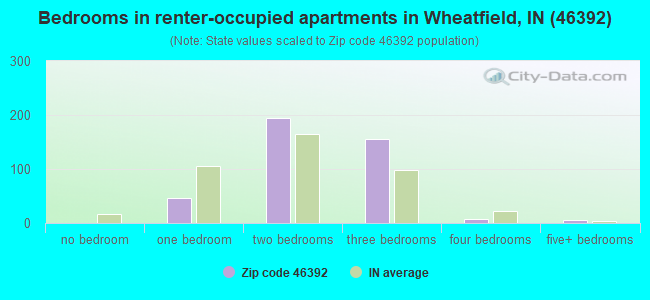
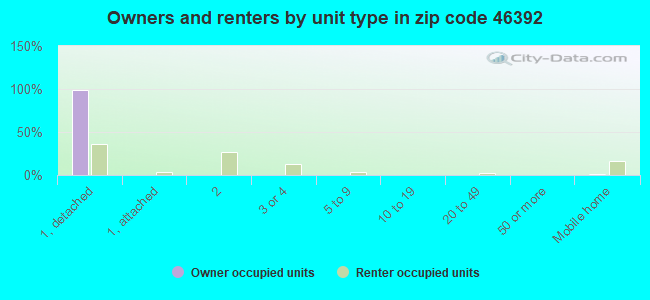
Houses and condos: 3,058 Renter-occupied apartments: 414
% of renters here:
14%
State:
29%
March 2022 cost of living index in zip code 46392: 85.4 (less than average, U.S. average is 100)
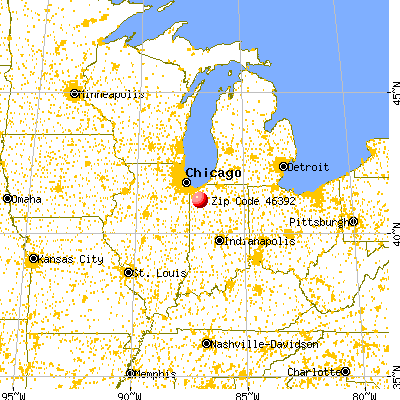
Land area: 109.5 sq. mi. Water area: 1.1 sq. mi.
Population density: 76 people per square mile
(very low).
OSM Map
General Map
Google Map
MSN Map
OSM Map
General Map
Google Map
MSN Map
OSM Map
General Map
Google Map
MSN Map
OSM Map
General Map
Google Map
MSN Map
Please wait while loading the map...
Real estate property taxes paid for housing units in 2022:
This zip code:
0.4% ($1,019)
Indiana:
0.7% ($1,467)
Median real estate property taxes paid for housing units with mortgages in 2022: $981 (0.4%) Median real estate property taxes paid for housing units with no mortgage in 2022: $1,165 (0.5%)
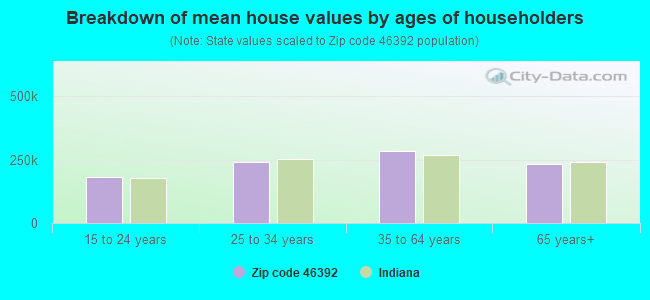
Estimated median house/condo value in 2022: $250,190
46392:
$250,190
Indiana:
$208,700
According to our research of Indiana and other state lists, there was 1 registered sex offender living in 46392 zip code as of May 31, 2024. The ratio of all residents to sex offenders in zip code 46392 is 8,137 to 1. The ratio of registered sex offenders to all residents in this zip code is much lower than the state average.
Median resident age:
This zip code:
36.7 years
Indiana median age:
38.2 years
Average household size:
This zip code:
2.8 people
Indiana:
2.4 people
Averages for the 2020 tax year for zip code 46392, filed in 2021:
Average Adjusted Gross Income (AGI) in 2020: $61,278 (Individual Income Tax Returns)
Here:
$61,278
State:
$64,978
Salary/wage: $54,789 (reported on 82.4% of returns)
Here:
$54,789
State:
$55,245
(% of AGI for various income ranges: 1058.4% for AGIs below $25k, 3407.2% for AGIs $25k-50k, 6015.8% for AGIs $50k-75k, 9002.6% for AGIs $75k-100k, 14785.0% for AGIs $100k-200k, 60195.0% for AGIs over 200k)
Taxable interest for individuals: $1,111 (reported on 25.3% of returns)
This zip code:
$1,111
Indiana:
$1,351
(% of AGI for various income ranges: 10.7% for AGIs below $25k, 10.6% for AGIs $25k-50k, 43.3% for AGIs $50k-75k, 42.4% for AGIs $75k-100k, 68.5% for AGIs $100k-200k, 1200.0% for AGIs over 200k)
Ordinary dividends: $2,665 (reported on 13.4% of returns)
Here:
$2,665
State:
$5,827
(% of AGI for various income ranges: 15.4% for AGIs below $25k, 21.4% for AGIs $25k-50k, 24.2% for AGIs $50k-75k, 59.7% for AGIs $75k-100k, 116.7% for AGIs $100k-200k, 1095.0% for AGIs over 200k)
Net capital gain/loss in AGI: +$13,907 (reported on 11.8% of returns)
Here:
+$13,907
State:
+$17,730
(% of AGI for various income ranges: 5.1% for AGIs below $25k, 27.0% for AGIs $25k-50k, 66.4% for AGIs $50k-75k, 107.6% for AGIs $75k-100k, 305.6% for AGIs $100k-200k, 19550.0% for AGIs over 200k)
Profit/loss from business: +$7,763 (reported on 10.8% of returns)
Here:
+$7,763
State:
+$12,144
(% of AGI for various income ranges: 92.2% for AGIs below $25k, 64.2% for AGIs $25k-50k, 87.6% for AGIs $50k-75k, 82.9% for AGIs $75k-100k, 273.3% for AGIs $100k-200k)
Taxable individual retirement arrangement distribution: $15,516 (reported on 8.2% of returns)
46392:
$15,516
Indiana:
$18,302
(% of AGI for various income ranges: 57.9% for AGIs below $25k, 96.7% for AGIs $25k-50k, 176.9% for AGIs $50k-75k, 250.9% for AGIs $75k-100k, 427.1% for AGIs $100k-200k)
Total itemized deductions: $33,122 (reported on 4.7% of returns)
Here:
$33,122
State:
$35,601
(% of AGI for various income ranges: 58.7% for AGIs below $25k, 172.2% for AGIs $50k-75k, 210.9% for AGIs $75k-100k, 523.8% for AGIs $100k-200k, 7285.0% for AGIs over 200k)
Charity contributions: $12,862 (reported on 3.4% of returns)
Here:
$12,862
State:
$15,596
(% of AGI for various income ranges: 16.9% for AGIs $25k-50k, 40.6% for AGIs $75k-100k, 297.1% for AGIs $100k-200k)
Taxes paid: $7,450 (reported on 4.7% of returns)
46392:
$7,450
State:
$7,542
(% of AGI for various income ranges: 9.5% for AGIs below $25k, 44.2% for AGIs $50k-75k, 59.4% for AGIs $75k-100k, 136.7% for AGIs $100k-200k, 1015.0% for AGIs over 200k)
Earned income credit: $2,260 (reported on 11.8% of returns)
Here:
$2,260
State:
$2,298
(% of AGI for various income ranges: 81.4% for AGIs below $25k, 50.8% for AGIs $25k-50k)
Percentage of individuals using paid preparers for their 2020 taxes: 94.2%
Here:
94%
State:
94%
(% for various income ranges: 92.4% for AGIs below $25k, 95.0% for AGIs $25k-50k, 95.0% for AGIs $50k-75k, 93.5% for AGIs $75k-100k, 95.7% for AGIs $100k-200k, 100.0% for AGIs over 200k)
Averages for the 2012 tax year for zip code 46392, filed in 2013:
Average Adjusted Gross Income (AGI) in 2012: $60,098 (Individual Income Tax Returns)
Here:
$60,098
State:
$52,932
Salary/wage: $49,618 (reported on 86.0% of returns)
Here:
$49,618
State:
$45,173
(% of AGI for various income ranges: 70.4% for AGIs below $25k, 74.8% for AGIs $25k-50k, 78.6% for AGIs $50k-75k, 84.5% for AGIs $75k-100k, 83.4% for AGIs $100k-200k, 20.0% for AGIs over 200k)
Taxable interest for individuals: $1,172 (reported on 28.9% of returns)
This zip code:
$1,172
Indiana:
$1,311
(% of AGI for various income ranges: 1.1% for AGIs below $25k, 0.8% for AGIs $25k-50k, 0.3% for AGIs $50k-75k, 0.2% for AGIs $75k-100k, 0.3% for AGIs $100k-200k, 1.5% for AGIs over 200k)
Ordinary dividends: $1,717 (reported on 12.0% of returns)
Here:
$1,717
State:
$4,690
(% of AGI for various income ranges: 0.6% for AGIs below $25k, 0.6% for AGIs $25k-50k, 0.3% for AGIs $50k-75k, 0.2% for AGIs $75k-100k, 0.2% for AGIs $100k-200k, 0.5% for AGIs over 200k)
Net capital gain/loss in AGI: +$38,997 (reported on 8.7% of returns)
Here:
+$38,997
State:
+$10,406
(% of AGI for various income ranges: 0.3% for AGIs below $25k, 0.2% for AGIs $25k-50k, 0.2% for AGIs $75k-100k, 0.9% for AGIs $100k-200k, 33.9% for AGIs over 200k)
Profit/loss from business: +$6,872 (reported on 11.4% of returns)
Here:
+$6,872
State:
+$11,105
(% of AGI for various income ranges: 6.3% for AGIs below $25k, 2.9% for AGIs $25k-50k, 1.6% for AGIs $50k-75k, 0.4% for AGIs $75k-100k, 0.7% for AGIs $100k-200k)
Taxable individual retirement arrangement distribution: $14,258 (reported on 7.6% of returns)
46392:
$14,258
Indiana:
$13,841
(% of AGI for various income ranges: 2.3% for AGIs below $25k, 2.0% for AGIs $25k-50k, 1.8% for AGIs $50k-75k, 1.3% for AGIs $75k-100k, 2.9% for AGIs $100k-200k)
Total itemized deductions: $19,629 (18% of AGI, reported on 34.7% of returns)
Here:
$19,629
State:
$20,913
Here:
17.9% of AGI
State:
18.2% of AGI
(% of AGI for various income ranges: 7.1% for AGIs below $25k, 10.0% for AGIs $25k-50k, 10.0% for AGIs $50k-75k, 12.7% for AGIs $75k-100k, 14.2% for AGIs $100k-200k, 8.2% for AGIs over 200k)
Charity contributions: $3,439 (reported on 24.2% of returns)
Here:
$3,439
State:
$4,697
(% of AGI for various income ranges: 0.6% for AGIs below $25k, 1.2% for AGIs $25k-50k, 1.1% for AGIs $50k-75k, 1.2% for AGIs $75k-100k, 1.4% for AGIs $100k-200k, 2.3% for AGIs over 200k)
Taxes paid: $7,515 (reported on 34.7% of returns)
46392:
$7,515
State:
$7,456
(% of AGI for various income ranges: 1.0% for AGIs below $25k, 2.4% for AGIs $25k-50k, 3.1% for AGIs $50k-75k, 4.7% for AGIs $75k-100k, 6.2% for AGIs $100k-200k, 4.5% for AGIs over 200k)
Earned income credit: $2,138 (reported on 14.0% of returns)
Here:
$2,138
State:
$2,265
(% of AGI for various income ranges: 5.8% for AGIs below $25k, 1.1% for AGIs $25k-50k)
Percentage of individuals using paid preparers for their 2012 taxes: 58.0%
Here:
58%
State:
53%
(% for various income ranges: 50.0% for AGIs below $25k, 56.5% for AGIs $25k-50k, 61.1% for AGIs $50k-75k, 64.6% for AGIs $75k-100k, 66.0% for AGIs $100k-200k, 100.0% for AGIs over 200k)
Averages for the 2004 tax year for zip code 46392, filed in 2005:
Average Adjusted Gross Income (AGI) in 2004: $45,371 (Individual Income Tax Returns)
Here:
$45,371
State:
$44,790
Salary/wage: $39,772 (reported on 88.5% of returns)
Here:
$39,772
State:
$39,615
(% of AGI for various income ranges: 99.4% for AGIs below $10k, 71.5% for AGIs $10k-25k, 79.9% for AGIs $25k-50k, 86.3% for AGIs $50k-75k, 88.5% for AGIs $75k-100k, 54.2% for AGIs over 100k)
Taxable interest for individuals: $929 (reported on 42.0% of returns)
This zip code:
$929
Indiana:
$1,535
(% of AGI for various income ranges: 3.0% for AGIs below $10k, 2.6% for AGIs $10k-25k, 0.7% for AGIs $25k-50k, 0.6% for AGIs $50k-75k, 0.2% for AGIs $75k-100k, 1.2% for AGIs over 100k)
Taxable dividends: $1,316 (reported on 13.3% of returns)
Here:
$1,316
State:
$2,998
(% of AGI for various income ranges: 1.5% for AGIs below $10k, 0.5% for AGIs $10k-25k, 0.3% for AGIs $25k-50k, 0.2% for AGIs $50k-75k, 0.2% for AGIs $75k-100k, 0.7% for AGIs over 100k)
Net capital gain/loss: +$13,994 (reported on 10.9% of returns)
Here:
+$13,994
State:
+$8,619
(% of AGI for various income ranges: -0.9% for AGIs below $10k, 0.5% for AGIs $10k-25k, 0.4% for AGIs $25k-50k, 0.7% for AGIs $50k-75k, 1.0% for AGIs $75k-100k, 13.1% for AGIs over 100k)
Profit/loss from business: +$7,971 (reported on 13.0% of returns)
Here:
+$7,971
State:
+$10,071
(% of AGI for various income ranges: 4.8% for AGIs below $10k, 6.8% for AGIs $10k-25k, 3.1% for AGIs $25k-50k, 1.4% for AGIs $50k-75k, 1.1% for AGIs $75k-100k, 2.1% for AGIs over 100k)
Profit/loss from farming: +$56 (reported on 2.3% of returns)
Here:
+$56
State:
-$2,212
(% of AGI for various income ranges: 4.9% for AGIs below $10k, 0.1% for AGIs $25k-50k, -0.2% for AGIs $50k-75k, -0.2% for AGIs $75k-100k)
IRA payment deduction: $3,077 (reported on 2.5% of returns)
46392:
$3,077
Indiana:
$2,840
(% of AGI for various income ranges: 0.3% for AGIs $10k-25k, 0.2% for AGIs $25k-50k, 0.2% for AGIs $50k-75k, 0.2% for AGIs $75k-100k)
Total itemized deductions: $16,125 (21% of AGI, reported on 33.7% of returns)
Here:
$16,125
State:
$17,065
Here:
21.1% of AGI
State:
19.5% of AGI
(% of AGI for various income ranges: 7.7% for AGIs below $10k, 8.6% for AGIs $10k-25k, 10.6% for AGIs $25k-50k, 13.3% for AGIs $50k-75k, 13.0% for AGIs $75k-100k, 12.0% for AGIs over 100k)
Charity contributions deductions: $2,860 (4% of AGI, reported on 26.9% of returns)
Here:
$2,860
State:
$3,550
Here:
3.5% of AGI
State:
3.8% of AGI
(% of AGI for various income ranges: 0.6% for AGIs $10k-25k, 1.2% for AGIs $25k-50k, 1.6% for AGIs $50k-75k, 1.5% for AGIs $75k-100k, 3.1% for AGIs over 100k)
Total tax: $5,750 (reported on 77.4% of returns)
46392:
$5,750
State:
$6,914
(% of AGI for various income ranges: 2.5% for AGIs below $10k, 4.4% for AGIs $10k-25k, 6.3% for AGIs $25k-50k, 8.0% for AGIs $50k-75k, 9.9% for AGIs $75k-100k, 17.6% for AGIs over 100k)
Earned income credit: $1,574 (reported on 11.2% of returns)
Here:
$1,574
State:
$1,685
Percentage of individuals using paid preparers for their 2004 taxes: 64.2%
Here:
64%
State:
59%
(% for various income ranges: 53.1% for AGIs below $10k, 63.7% for AGIs $10k-25k, 64.3% for AGIs $25k-50k, 69.0% for AGIs $50k-75k, 69.1% for AGIs $75k-100k, 75.7% for AGIs over 100k)
Household received Food Stamps/SNAP in the past 12 months: 156 Household did not receive Food Stamps/SNAP in the past 12 months: 2,755
Women who had a birth in the past 12 months: 189 (157 now married, 37 unmarried) Women who did not have a birth in the past 12 months: 1,590 (895 now married, 698 unmarried)
Housing units in zip code 46392 with a mortgage: 1,650 (127 second mortgage, 112 both second mortgage and home equity loan) Houses without a mortgage: 4
Median monthly owner costs for units with a mortgage: $1,308 Median monthly owner costs for units without a mortgage: $379
Residents with income below the poverty level in 2022:
This zip code:
6.8%
Whole state:
12.6%
Residents with income below 50% of the poverty level in 2022:
This zip code:
2.2%
Whole state:
6.3%
Median number of rooms in houses and condos:
Here:
6.5
State:
6.6
Median number of rooms in apartments:
Here:
4.9
State:
4.3
Notable locations in this zip code not listed on our city pages
Notable locations in zip code 46392: Shady Pines Golf Course (A), Eylander Hog Farms (B), Wheatfield Fire Department (C). Display/hide their locations on the map
Churches in zip code 46392 include: United Pentecostal Church (A), Calvary Evangelical Free Church (B), Abundant Life Family Church (C). Display/hide their locations on the map
In group quarters: 42 (-1 institutionalized population)
Size of family households: 997 2-persons, 476 3-persons, 592 4-persons, 197 5-persons, 61 6-persons, 25 7-or-more-persons
Size of nonfamily households: 439 1-person, 107 2-persons, 5 3-persons
1,626 married couples with children.
324 single-parent households (218 men, 106 women).
98.2% of residents of 46392 zip code speak English at home.
0.3% of residents speak Spanish at home (50% very well, 50% well).
0.2% of residents speak other Indo-European language at home (56% very well, 12% well, 31% not well).
0.3% of residents speak other language at home (100% very well).
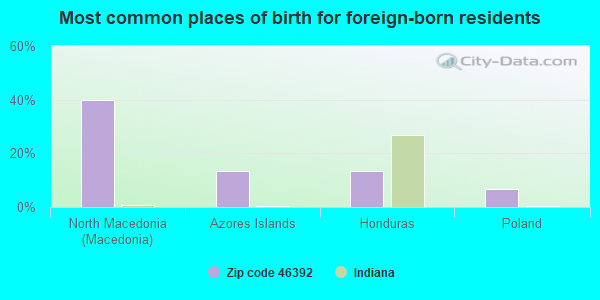
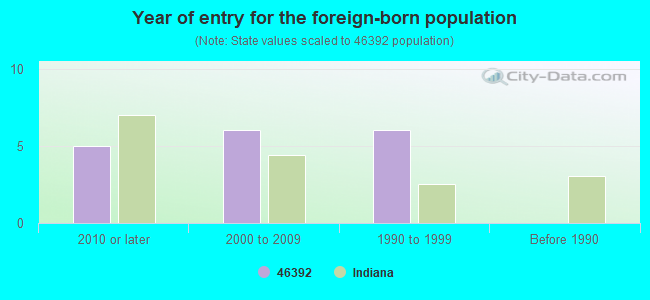
Foreign born population: 15 (0.2%) (58.4% of them are naturalized citizens)
This zip code:
0.2%
Whole state:
6.1%
40%North Macedonia (Macedonia)
13%Azores Islands
13%Honduras
7%Poland
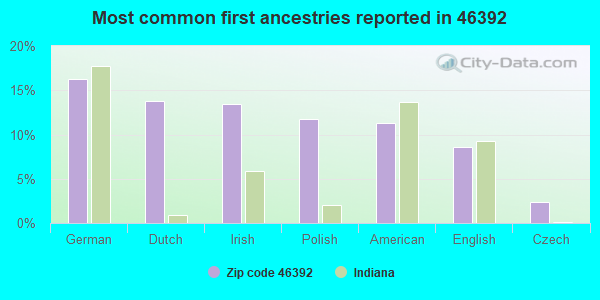
16%German
14%Dutch
13%Irish
12%Polish
11%American
9%English
2%Czech
Year of entry for the foreign-born population
52010 or later
62000 to 2009
61990 to 1999
0Before 1990
Facilities with environmental interests located in this zip code:
NIPSCO ROLLIN M SCHAHFER GENERATING STATION (2723 E 1500 N in WHEATFIELD, IN)
AIR MAJOR (AIRS/AFS) AIR PROGRAM (Clean Air Markets Division Business System) (Integrated Compliance Information System) - ICIS-05-1980-0075, FORMAL ENFORCEMENT ACTION STATE MASTER (Indiana facility tracking) - LUST-199311506, LEAKING STORAGE TANK, RBLC-1029, AIR MAJOR, RBLC-1050, SPILL-199002163, RELEASE ASSESSMENT, UST-6097, UNDERGROUND STORAGE TANK PROGRAM, ACES-OP-07300008, AIR PROGRAM, CRTK-19842, EPCRA, CRTK-621, CRITERIA AND HAZARDOUS AIR POLLUTANT INVENTORY (Inventory of air pollution sources) National Pollutant Discharge Elimination System MAJOR (Tracking pollutant discharge elimination systems) - permit HAZARDOUS WASTE BIENNIAL REPORTER (Resource Conservation and Recovery Act (tracking hazardous waste)) Small Quantity Generators, between 100 kg and 1000 kg of hazardous waste/month (Resource Conservation and Recovery Act (tracking hazardous waste)) TSD (Resource Conservation and Recovery Act (tracking hazardous waste)) - notification TRI REPORTER (Tracking of toxic chemicals releasing facilities) Business SIC classification: ELECTRIC SERVICES Business NAICS classification: FOSSIL FUEL ELECTRIC POWER GENERATION.; FOSSIL FUEL ELECTRIC POWER GENERATION. Organizations: NIPSCO RM SCHAHFER GENERATING STA (CONTACT/OPERATOR)
, BERTIL C VALENKAMPH 8114 (CONTACT/OPERATOR)
, NORTHERN INDIANA PUBLIC SERVIC (CONTACT/OWNER)
, NISOURCE (CONTACT/OWNER)
, NORTHERN INDIANA PUBLIC SERVICE COMPANY (OWNER/OPERATOR)
Alternative names: NI SOURCE, NIPSCO R M SCHAHFER GENERATING STATION, NIPSCO ROLLIN M SCHAHFER GENERATING STATION SITE ID 180730004, NIPSCO, ROLLIN M. SCHAHFER STA, NIPSCO -SCHAHFER STATION, NORTHERN INDIANA PUBLIC SERVICE CO. - R.M. SCHAHFER GEN. STA., NORTHERN IND PUBLIC SERVICE CO, R M SCHAHFER, R. M. SCHAHFER GENERATING STATION, SITE ID 180730004
AT AND T LONG LINES WHEATFIELD (ST RTE 10 1MI E JCT 10 231 53 in WHEATFIELD, IN)
STATE MASTER (Indiana facility tracking) - CRTK-5990, EPCRA (Resource Conservation and Recovery Act (tracking hazardous waste))
CARGILL INCORPORATED WHEATFIELD (100 RAILROAD ST in WHEATFIELD, IN)
AIR MINOR (AIRS/AFS) STATE MASTER (Indiana facility tracking) - ACES-OP-07300010, AIR PROGRAM Business SIC classification: GRAIN AND FIELD BEANS
CENTRAL STATES CARRIERS (350 W HWY 10 in WHEATFIELD, IN)
STATE MASTER (Indiana facility tracking) (Resource Conservation and Recovery Act (tracking hazardous waste)) Organizations: SCULLEY DARYL (CONTACT/OWNER)
SCULLEY TRUCKING (350 W BOX 188 in WHEATFIELD, IN)
STATE MASTER (Indiana facility tracking) (Resource Conservation and Recovery Act (tracking hazardous waste)) Organizations: SCULLEY ROGER (CONTACT/OWNER)
SAFETY KLEEN CORP (1500 AND HWY 49 in WHEATFIELD, IN)
STATE MASTER (Indiana facility tracking) (Resource Conservation and Recovery Act (tracking hazardous waste)) Organizations: SAFETY-KLEEN SYSTEMS (CONTACT/OWNER)
ABUNDANT LIFE FELLOWSHIP 37 (RR 1 in WHEATFIELD, IL)
COMPLIANCE ACTIVITY (Tracking inspections of insecticide, fungicide, and rodenticide, and toxic substances)
Housing units lacking complete plumbing facilities: 1.4% Housing units lacking complete kitchen facilities: 1.5%
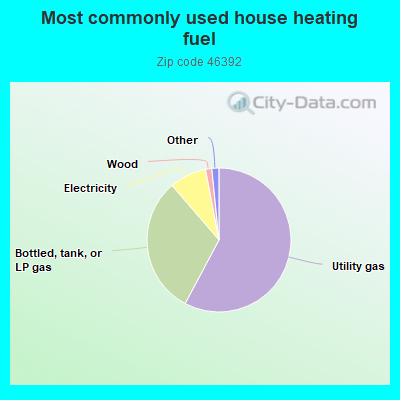
57.8%Utility gas
30.9%Bottled, tank, or LP gas
8.3%Electricity
1.4%Wood
1.0%No fuel used
0.7%Other fuel
Population in 1990: 5,415. Population change in the 1990s: +995 (+18.4%).
Place of birth for U.S.-born residents:
This state: 6,334
Northeast: 59
Midwest: 1,580
South: 265
West: 21
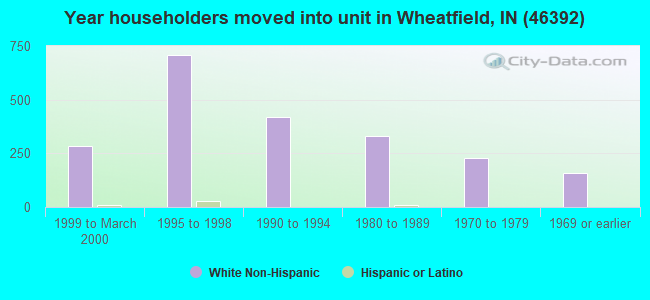
57% of the 46392 zip code residents lived in the same house 5 years ago. Out of people who lived in different houses, 36% lived in this county. Out of people who lived in different counties, 50% lived in Indiana.
96% of the 46392 zip code residents lived in the same house 1 year ago. Out of people who lived in different houses, 42% moved from this county. Out of people who lived in different houses, 27% moved from different county within same state. Out of people who lived in different houses, 43% moved from different state.
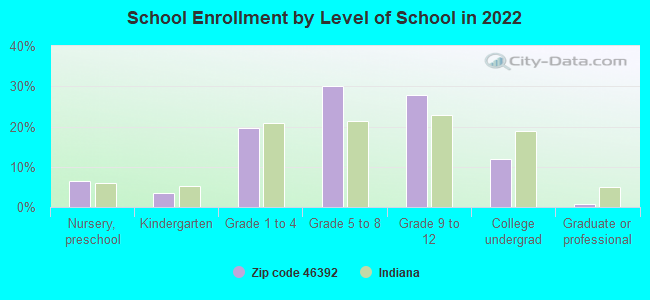
Private vs. public school enrollment:
Students in private schools in grades 1 to 8 (elementary and middle school): 130
Here:
13.4%
Indiana:
14.9%
Students in private schools in grades 9 to 12 (high school): 98
Here:
17.7%
Indiana:
11.4%
Students in private undergraduate colleges: 31
Here:
13.3%
Indiana:
22.3%
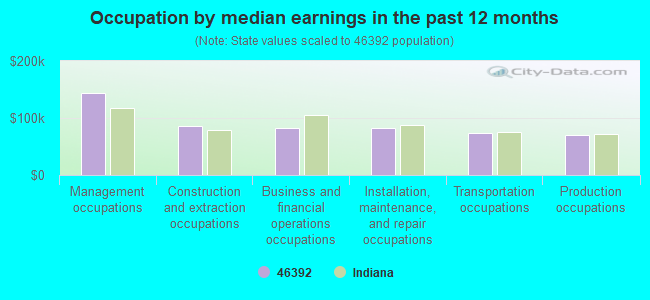
Occupation by median earnings in the past 12 months ($)
143,878Management occupations
86,121Construction and extraction occupations
82,730Business and financial operations occupations
81,750Installation, maintenance, and repair occupations
73,494Transportation occupations
69,831Production occupations
Top industries in this zip code by the number of employees in 2005:
Utilities: Electric Power Distribution (250-499 employees: 1 establishment, 10-19 employees: 1 establishment, 1-4 employees: 1 establishment)
Construction: Commercial and Institutional Building Construction (100-249: 1, 1-4: 2)
Health Care and Social Assistance: Other Residential Care Facilities (100-249: 1)
Construction: New Single-Family Housing Construction (except Operative Builders) (10-19: 1, 5-9: 4, 1-4: 6)
Accommodation and Food Services: Full-Service Restaurants (10-19: 3, 1-4: 2)
People in group quarters in 2010:
72 people in residential treatment centers for juveniles (non-correctional)
People in group quarters in 2000:
71 people in homes for abused, dependent, and neglected children
2 people in other noninstitutional group quarters
Fatal accident statistics in 2014:
Fatal accident count: 3
Vehicles involved in fatal accidents: 4
Fatal accidents caused by drunken drivers: 2
Fatalities: 3
Persons involved in fatal accidents: 4
Pedestrians involved in fatal accidents: 0
Fatal accident statistics in 2012:
Fatal accident count: 1
Vehicles involved in fatal accidents: 2
Fatal accidents caused by drunken drivers: 0
Fatalities: 1
Persons involved in fatal accidents: 2
Pedestrians involved in fatal accidents: 0
Home Mortgage Disclosure Act Aggregated Statistics For Year 2009 (Based on 6 partial tracts)
A) FHA, FSA/RHS & VA Home Purchase Loans
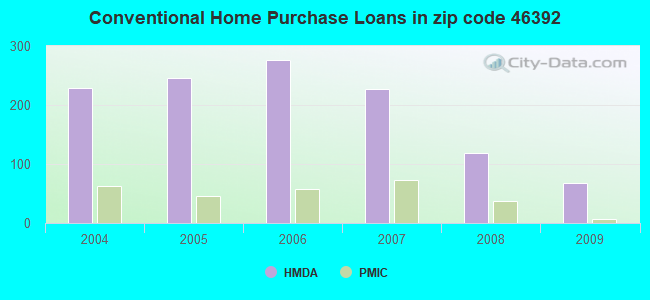
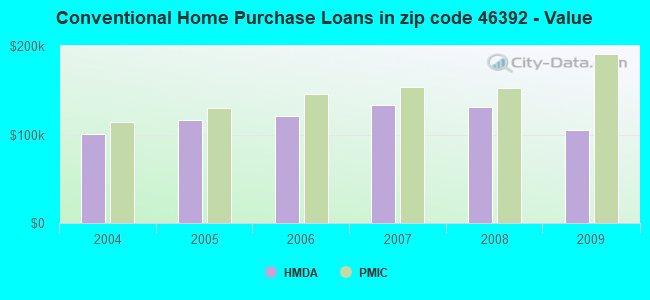
B) Conventional Home Purchase Loans
C) Refinancings
D) Home Improvement Loans
F) Non-occupant Loans on < 5 Family Dwellings (A B C & D)
G) Loans On Manufactured Home Dwelling (A B C & D)
Number
Average Value
Number
Average Value
Number
Average Value
Number
Average Value
Number
Average Value
Number
Average Value
LOANS ORIGINATED
77
$146,525
68
$105,124
438
$137,124
36
$42,791
34
$95,159
22
$78,663
APPLICATIONS APPROVED, NOT ACCEPTED
3
$136,437
2
$178,915
39
$139,494
4
$22,515
0
$0
2
$108,580
APPLICATIONS DENIED
28
$139,195
13
$100,282
157
$134,989
9
$20,993
4
$67,305
12
$59,712
APPLICATIONS WITHDRAWN
3
$132,893
9
$102,359
73
$139,502
5
$128,998
1
$190,550
1
$147,420
FILES CLOSED FOR INCOMPLETENESS
5
$92,778
2
$135,550
29
$150,247
2
$35,090
1
$94,770
2
$99,310
Aggregated Statistics For Year 2008 (Based on 6 partial tracts)
A) FHA, FSA/RHS & VA Home Purchase Loans
B) Conventional Home Purchase Loans
C) Refinancings
D) Home Improvement Loans
F) Non-occupant Loans on < 5 Family Dwellings (A B C & D)
G) Loans On Manufactured Home Dwelling (A B C & D)
Number
Average Value
Number
Average Value
Number
Average Value
Number
Average Value
Number
Average Value
Number
Average Value
LOANS ORIGINATED
63
$134,478
119
$130,667
254
$131,859
39
$46,433
39
$91,478
28
$88,593
APPLICATIONS APPROVED, NOT ACCEPTED
5
$113,206
6
$187,203
38
$139,299
4
$72,118
1
$176,440
3
$109,637
APPLICATIONS DENIED
13
$163,865
25
$126,314
134
$140,032
27
$70,859
11
$119,786
12
$97,969
APPLICATIONS WITHDRAWN
5
$111,784
8
$131,379
68
$144,560
8
$92,652
2
$47,125
4
$83,700
FILES CLOSED FOR INCOMPLETENESS
0
$0
4
$127,238
8
$121,935
0
$0
1
$124,010
0
$0
Aggregated Statistics For Year 2007 (Based on 6 partial tracts)
A) FHA, FSA/RHS & VA Home Purchase Loans
B) Conventional Home Purchase Loans
C) Refinancings
D) Home Improvement Loans
E) Loans on Dwellings For 5+ Families
F) Non-occupant Loans on < 5 Family Dwellings (A B C & D)
G) Loans On Manufactured Home Dwelling (A B C & D)
Number
Average Value
Number
Average Value
Number
Average Value
Number
Average Value
Number
Average Value
Number
Average Value
Number
Average Value
LOANS ORIGINATED
31
$123,128
227
$133,121
263
$131,917
53
$44,850
1
$104,380
33
$118,994
34
$80,118
APPLICATIONS APPROVED, NOT ACCEPTED
1
$72,590
22
$124,785
48
$145,992
5
$38,674
0
$0
2
$84,980
6
$86,653
APPLICATIONS DENIED
2
$185,090
32
$105,411
146
$134,456
32
$48,036
1
$107,420
11
$73,264
20
$77,948
APPLICATIONS WITHDRAWN
0
$0
21
$133,007
63
$126,395
6
$61,382
0
$0
1
$85,530
2
$56,025
FILES CLOSED FOR INCOMPLETENESS
0
$0
3
$188,490
20
$144,872
0
$0
0
$0
1
$86,140
2
$106,315
Aggregated Statistics For Year 2006 (Based on 6 partial tracts)
A) FHA, FSA/RHS & VA Home Purchase Loans
B) Conventional Home Purchase Loans
C) Refinancings
D) Home Improvement Loans
E) Loans on Dwellings For 5+ Families
F) Non-occupant Loans on < 5 Family Dwellings (A B C & D)
G) Loans On Manufactured Home Dwelling (A B C & D)
Number
Average Value
Number
Average Value
Number
Average Value
Number
Average Value
Number
Average Value
Number
Average Value
Number
Average Value
LOANS ORIGINATED
36
$138,631
276
$120,574
315
$114,401
57
$63,124
1
$175,430
52
$85,025
36
$81,351
APPLICATIONS APPROVED, NOT ACCEPTED
2
$97,690
28
$106,504
49
$113,974
5
$30,946
0
$0
4
$89,920
7
$79,751
APPLICATIONS DENIED
5
$93,914
73
$121,354
196
$117,334
46
$42,696
0
$0
9
$72,054
22
$68,833
APPLICATIONS WITHDRAWN
3
$109,097
35
$116,597
122
$124,484
4
$94,645
0
$0
4
$128,315
3
$119,943
FILES CLOSED FOR INCOMPLETENESS
0
$0
4
$131,412
36
$140,319
2
$73,200
0
$0
1
$74,990
2
$107,420
Aggregated Statistics For Year 2005 (Based on 6 partial tracts)
A) FHA, FSA/RHS & VA Home Purchase Loans
B) Conventional Home Purchase Loans
C) Refinancings
D) Home Improvement Loans
E) Loans on Dwellings For 5+ Families
F) Non-occupant Loans on < 5 Family Dwellings (A B C & D)
G) Loans On Manufactured Home Dwelling (A B C & D)
Number
Average Value
Number
Average Value
Number
Average Value
Number
Average Value
Number
Average Value
Number
Average Value
Number
Average Value
LOANS ORIGINATED
34
$119,671
246
$116,565
299
$112,792
65
$34,990
1
$101,340
33
$94,716
36
$84,470
APPLICATIONS APPROVED, NOT ACCEPTED
1
$50,670
26
$107,486
69
$108,461
5
$21,798
0
$0
2
$151,110
5
$84,794
APPLICATIONS DENIED
5
$102,616
76
$97,179
255
$110,277
51
$42,006
0
$0
8
$97,232
27
$79,504
APPLICATIONS WITHDRAWN
2
$136,300
63
$101,897
150
$120,675
15
$127,445
0
$0
5
$117,420
10
$92,976
FILES CLOSED FOR INCOMPLETENESS
1
$157,780
8
$103,134
37
$115,731
0
$0
0
$0
7
$92,283
1
$107,880
Aggregated Statistics For Year 2004 (Based on 6 partial tracts)
A) FHA, FSA/RHS & VA Home Purchase Loans
B) Conventional Home Purchase Loans
C) Refinancings
D) Home Improvement Loans
F) Non-occupant Loans on < 5 Family Dwellings (A B C & D)
G) Loans On Manufactured Home Dwelling (A B C & D)
2002 - 2016 National Fire Incident Reporting System (NFIRS) incidents
According to the data from the years 2002 - 2016 the average number of fire incidents per year is 43. The highest number of fire incidents - 96 took place in 2004, and the least - 1 in 2015. The data has a declining trend.
When looking into fire subcategories, the most incidents belonged to: Outside Fires (63.8%), and Structure Fires (24.0%).
Fire incident types reported to NFIRS in Zip Code 46392


+$56
-$2,212
(% of AGI for various income ranges: 4.9% for AGIs below $10k, 0.1% for AGIs $25k-50k, -0.2% for AGIs $50k-75k, -0.2% for AGIs $75k-100k) Nearest zip codes: 46347, 46374, 46310, 47957, 47978, 46341.


 According to the data from the years 2002 - 2016 the average number of fire incidents per year is 43. The highest number of fire incidents - 96 took place in 2004, and the least - 1 in 2015. The data has a declining trend.
 When looking into fire subcategories, the most incidents belonged to: Outside Fires (63.8%), and Structure Fires (24.0%).