Estimated zip code population in 2022: 1,862 Zip code population in 2010: 1,841 Zip code population in 2000: 1,606
Houses and condos: 685 Renter-occupied apartments: 18
% of renters here:
3%
State:
29%
March 2022 cost of living index in zip code 46745: 83.2 (low, U.S. average is 100)
Land area: 19.7 sq. mi. Water area: 0.0 sq. mi.
Population density: 95 people per square mile
(very low).
OSM Map
General Map
Google Map
MSN Map
OSM Map
General Map
Google Map
MSN Map
OSM Map
General Map
Google Map
MSN Map
OSM Map
General Map
Google Map
MSN Map
Please wait while loading the map...
Real estate property taxes paid for housing units in 2022:
This zip code:
0.6% ($1,490)
Indiana:
0.7% ($1,467)
Median real estate property taxes paid for housing units with mortgages in 2022: $1,200 (0.5%) Median real estate property taxes paid for housing units with no mortgage in 2022: $1,682 (0.7%)
Business Search- 14 Million verified businesses
Males: 997
(53.6%)
Females: 864
(46.4%)
For population 25 years and over in 46745:
High school or higher: 99.4%
Bachelor's degree or higher: 28.8%
Graduate or professional degree: 5.1%
Unemployed: 5.3%
Mean travel time to work (commute): 21.7 minutes
For population 15 years and over in 46745:
Never married: 20.6%
Now married: 66.5%
Separated: 0.8%
Widowed: 5.7%
Divorced: 6.3%
Zip code 46745 compared to state average:
Black race population percentage significantly below state average.
Hispanic race population percentage significantly below state average.
Median age above state average.
Foreign-born population percentage significantly below state average.
Renting percentage significantly below state average.
Length of stay since moving in significantly above state average.
Estimated median house/condo value in 2022: $236,890
46745:
$236,890
Indiana:
$208,700
Median resident age:
This zip code:
43.6 years
Indiana median age:
38.2 years
Average household size:
This zip code:
2.7 people
Indiana:
2.4 people
Averages for the 2020 tax year for zip code 46745, filed in 2021:
Average Adjusted Gross Income (AGI) in 2020: $69,354 (Individual Income Tax Returns)
Here:
$69,354
State:
$64,978
Salary/wage: $59,959 (reported on 79.2% of returns)
Here:
$59,959
State:
$55,245
(% of AGI for various income ranges: 1024.7% for AGIs below $25k, 3239.4% for AGIs $25k-50k, 6620.0% for AGIs $50k-75k, 9196.2% for AGIs $75k-100k, 15755.8% for AGIs $100k-200k)
Taxable interest for individuals: $795 (reported on 44.8% of returns)
This zip code:
$795
Indiana:
$1,351
(% of AGI for various income ranges: 23.5% for AGIs below $25k, 40.6% for AGIs $25k-50k, 37.3% for AGIs $50k-75k, 45.0% for AGIs $75k-100k, 86.7% for AGIs $100k-200k)
Ordinary dividends: $2,326 (reported on 28.1% of returns)
Here:
$2,326
State:
$5,827
(% of AGI for various income ranges: 32.9% for AGIs below $25k, 38.8% for AGIs $25k-50k, 55.5% for AGIs $50k-75k, 156.2% for AGIs $75k-100k, 270.0% for AGIs $100k-200k)
Net capital gain/loss in AGI: +$6,246 (reported on 25.0% of returns)
Here:
+$6,246
State:
+$17,730
(% of AGI for various income ranges: 17.1% for AGIs below $25k, 21.9% for AGIs $25k-50k, 138.2% for AGIs $50k-75k, 227.5% for AGIs $75k-100k, 585.8% for AGIs $100k-200k)
Profit/loss from business: +$11,525 (reported on 12.5% of returns)
Here:
+$11,525
State:
+$12,144
(% of AGI for various income ranges: 71.8% for AGIs below $25k, 320.0% for AGIs $50k-75k, 381.2% for AGIs $75k-100k, 515.0% for AGIs $100k-200k)
Taxable individual retirement arrangement distribution: $15,882 (reported on 17.7% of returns)
46745:
$15,882
Indiana:
$18,302
(% of AGI for various income ranges: 145.9% for AGIs below $25k, 246.9% for AGIs $25k-50k, 592.7% for AGIs $50k-75k, 1170.8% for AGIs $100k-200k)
Total itemized deductions: $32,067 (reported on 3.1% of returns)
Here:
$32,067
State:
$35,601
(% of AGI for various income ranges: 801.7% for AGIs $100k-200k)
Charity contributions: $13,033 (reported on 3.1% of returns)
Here:
$13,033
State:
$15,596
(% of AGI for various income ranges: 325.8% for AGIs $100k-200k)
Taxes paid: $7,525 (reported on 4.2% of returns)
46745:
$7,525
State:
$7,542
(% of AGI for various income ranges: 250.8% for AGIs $100k-200k)
Earned income credit: $2,088 (reported on 8.3% of returns)
Here:
$2,088
State:
$2,298
(% of AGI for various income ranges: 56.5% for AGIs below $25k, 44.4% for AGIs $25k-50k)
Percentage of individuals using paid preparers for their 2020 taxes: 93.8%
Here:
94%
State:
94%
(% for various income ranges: 92.3% for AGIs below $25k, 95.0% for AGIs $25k-50k, 93.8% for AGIs $50k-75k, 91.7% for AGIs $75k-100k, 94.7% for AGIs $100k-200k, 100.0% for AGIs over 200k)
Averages for the 2012 tax year for zip code 46745, filed in 2013:
Average Adjusted Gross Income (AGI) in 2012: $54,934 (Individual Income Tax Returns)
Here:
$54,934
State:
$52,932
Salary/wage: $47,176 (reported on 84.0% of returns)
Here:
$47,176
State:
$45,173
(% of AGI for various income ranges: 69.9% for AGIs below $25k, 77.7% for AGIs $25k-50k, 73.0% for AGIs $50k-75k, 78.6% for AGIs $75k-100k, 99.6% for AGIs $100k-200k)
Taxable interest for individuals: $624 (reported on 44.7% of returns)
This zip code:
$624
Indiana:
$1,311
(% of AGI for various income ranges: 1.4% for AGIs below $25k, 1.1% for AGIs $25k-50k, 0.4% for AGIs $50k-75k, 0.2% for AGIs $75k-100k, 0.3% for AGIs $100k-200k, 0.5% for AGIs over 200k)
Ordinary dividends: $1,642 (reported on 27.7% of returns)
Here:
$1,642
State:
$4,690
(% of AGI for various income ranges: 2.3% for AGIs below $25k, 1.5% for AGIs $25k-50k, 0.7% for AGIs $50k-75k, 0.4% for AGIs $75k-100k, 0.9% for AGIs $100k-200k)
Net capital gain/loss in AGI: +$725 (reported on 21.3% of returns)
Here:
+$725
State:
+$10,406
(% of AGI for various income ranges: 0.1% for AGIs $50k-75k, 0.3% for AGIs $75k-100k, 0.8% for AGIs $100k-200k)
Profit/loss from business: +$7,218 (reported on 11.7% of returns)
Here:
+$7,218
State:
+$11,105
(% of AGI for various income ranges: 4.6% for AGIs below $25k, 3.6% for AGIs $25k-50k, 2.5% for AGIs $50k-75k, 1.1% for AGIs $75k-100k)
Taxable individual retirement arrangement distribution: $10,554 (reported on 13.8% of returns)
46745:
$10,554
Indiana:
$13,841
(% of AGI for various income ranges: 4.5% for AGIs below $25k, 3.8% for AGIs $25k-50k, 3.8% for AGIs $50k-75k, 2.7% for AGIs $75k-100k, 2.0% for AGIs $100k-200k)
Total itemized deductions: $17,341 (18% of AGI, reported on 28.7% of returns)
Here:
$17,341
State:
$20,913
Here:
17.9% of AGI
State:
18.2% of AGI
(% of AGI for various income ranges: 9.9% for AGIs below $25k, 6.3% for AGIs $25k-50k, 7.9% for AGIs $50k-75k, 9.7% for AGIs $75k-100k, 10.3% for AGIs $100k-200k, 9.8% for AGIs over 200k)
Charity contributions: $3,678 (reported on 24.5% of returns)
Here:
$3,678
State:
$4,697
(% of AGI for various income ranges: 1.5% for AGIs $25k-50k, 1.0% for AGIs $50k-75k, 2.0% for AGIs $75k-100k, 3.1% for AGIs $100k-200k)
Taxes paid: $6,000 (reported on 28.7% of returns)
46745:
$6,000
State:
$7,456
(% of AGI for various income ranges: 0.8% for AGIs below $25k, 1.4% for AGIs $25k-50k, 2.1% for AGIs $50k-75k, 3.3% for AGIs $75k-100k, 4.3% for AGIs $100k-200k, 5.2% for AGIs over 200k)
Earned income credit: $1,744 (reported on 9.6% of returns)
Here:
$1,744
State:
$2,265
(% of AGI for various income ranges: 2.4% for AGIs below $25k, 0.9% for AGIs $25k-50k)
Percentage of individuals using paid preparers for their 2012 taxes: 53.2%
Here:
53%
State:
53%
(% for various income ranges: 44.1% for AGIs below $25k, 50.0% for AGIs $25k-50k, 66.7% for AGIs $50k-75k, 53.8% for AGIs $75k-100k, 80.0% for AGIs $100k-200k)
Averages for the 2004 tax year for zip code 46745, filed in 2005:
Average Adjusted Gross Income (AGI) in 2004: $42,929 (Individual Income Tax Returns)
Here:
$42,929
State:
$44,790
Salary/wage: $40,370 (reported on 86.1% of returns)
Here:
$40,370
State:
$39,615
(% of AGI for various income ranges: 121.4% for AGIs below $10k, 67.0% for AGIs $10k-25k, 81.4% for AGIs $25k-50k, 85.0% for AGIs $50k-75k, 88.6% for AGIs $75k-100k, 68.5% for AGIs over 100k)
Taxable interest for individuals: $1,182 (reported on 56.6% of returns)
This zip code:
$1,182
Indiana:
$1,535
(% of AGI for various income ranges: 10.1% for AGIs below $10k, 5.2% for AGIs $10k-25k, 1.4% for AGIs $25k-50k, 1.4% for AGIs $50k-75k, 0.5% for AGIs $75k-100k, 1.3% for AGIs over 100k)
Taxable dividends: $1,212 (reported on 29.0% of returns)
Here:
$1,212
State:
$2,998
(% of AGI for various income ranges: 4.4% for AGIs below $10k, 1.7% for AGIs $10k-25k, 0.9% for AGIs $25k-50k, 0.3% for AGIs $50k-75k, 0.3% for AGIs $75k-100k, 1.4% for AGIs over 100k)
Net capital gain/loss: +$3,295 (reported on 20.5% of returns)
Here:
+$3,295
State:
+$8,619
(% of AGI for various income ranges: -3.3% for AGIs below $10k, -0.8% for AGIs $10k-25k, 0.3% for AGIs $25k-50k, 1.3% for AGIs $50k-75k, 1.8% for AGIs $75k-100k, 4.0% for AGIs over 100k)
Profit/loss from business: +$4,374 (reported on 13.1% of returns)
Here:
+$4,374
State:
+$10,071
(% of AGI for various income ranges: 8.6% for AGIs below $10k, 1.5% for AGIs $10k-25k, 2.2% for AGIs $25k-50k, 2.2% for AGIs $50k-75k, 0.1% for AGIs $75k-100k, 0.1% for AGIs over 100k)
Total itemized deductions: $15,399 (22% of AGI, reported on 37.3% of returns)
Here:
$15,399
State:
$17,065
Here:
21.6% of AGI
State:
19.5% of AGI
(% of AGI for various income ranges: 15.5% for AGIs $10k-25k, 11.4% for AGIs $25k-50k, 13.7% for AGIs $50k-75k, 15.0% for AGIs $75k-100k, 13.3% for AGIs over 100k)
Charity contributions deductions: $3,388 (5% of AGI, reported on 33.7% of returns)
Here:
$3,388
State:
$3,550
Here:
4.6% of AGI
State:
3.8% of AGI
(% of AGI for various income ranges: 2.4% for AGIs $10k-25k, 2.3% for AGIs $25k-50k, 2.5% for AGIs $50k-75k, 3.2% for AGIs $75k-100k, 2.9% for AGIs over 100k)
Total tax: $5,309 (reported on 75.7% of returns)
46745:
$5,309
State:
$6,914
(% of AGI for various income ranges: 3.3% for AGIs below $10k, 4.5% for AGIs $10k-25k, 6.9% for AGIs $25k-50k, 7.5% for AGIs $50k-75k, 9.7% for AGIs $75k-100k, 15.5% for AGIs over 100k)
Earned income credit: $1,468 (reported on 6.6% of returns)
Here:
$1,468
State:
$1,685
Percentage of individuals using paid preparers for their 2004 taxes: 60.5%
Here:
61%
State:
59%
(% for various income ranges: 53.2% for AGIs below $10k, 60.3% for AGIs $10k-25k, 63.4% for AGIs $25k-50k, 60.0% for AGIs $50k-75k, 63.2% for AGIs $75k-100k, 73.8% for AGIs over 100k)
Household received Food Stamps/SNAP in the past 12 months: 17 Household did not receive Food Stamps/SNAP in the past 12 months: 669
Women who had a birth in the past 12 months: 50 (55 now married, 0 unmarried) Women who did not have a birth in the past 12 months: 323 (200 now married, 124 unmarried)
Housing units in zip code 46745 with a mortgage: 346 (36 second mortgage, 30 both second mortgage and home equity loan) Houses without a mortgage: 13
Median monthly owner costs for units with a mortgage: $1,193 Median monthly owner costs for units without a mortgage: $606
Residents with income below the poverty level in 2022:
This zip code:
7.8%
Whole state:
12.6%
Residents with income below 50% of the poverty level in 2022:
This zip code:
5.0%
Whole state:
6.3%
Median number of rooms in houses and condos:
Here:
6.8
State:
6.6
Notable locations in this zip code not listed on our city pages
Size of family households: 247 2-persons, 84 3-persons, 125 4-persons, 76 5-persons, 5 6-persons, 8 7-or-more-persons
Size of nonfamily households: 138 1-person
371 married couples with children.
64 single-parent households (19 men, 45 women).
96.1% of residents of 46745 zip code speak English at home.
0.4% of residents speak Spanish at home (100% very well).
1.4% of residents speak other Indo-European language at home (100% very well).
0.4% of residents speak Asian or Pacific Island language at home (100% very well).
1.1% of residents speak other language at home (100% very well).
Foreign born population: 18 (1.0%) (100.0% of them are naturalized citizens)
This zip code:
1.0%
Whole state:
6.1%
124%Kuwait
54%German
23%American
6%English
1%Polish
1%French
1%Scandinavian
1%Italian
Year of entry for the foreign-born population
02010 or later
02000 to 2009
01990 to 1999
15Before 1990
Facilities with environmental interests located in this zip code:
STATE MASTER (Indiana facility tracking) National Pollutant Discharge Elimination System NON-MAJOR (Tracking pollutant discharge elimination systems) - permit Conditionally Exempt Small Quantity Generators, less than 100 kg/month of hazardous waste (Resource Conservation and Recovery Act (tracking hazardous waste)) - notification Business SIC classification: COATING, ENGRAVING, AND ALLIED SERVICES Organizations: ANNA M SMITH CERT 6448 (CONTACT/OPERATOR)
Alternative names: B & B CUSTON PLATING
BROOKS CONSTRUCTION CO. (5536 HOAGLAND RD in HOAGLAND, IN)
AIR SYNTHETIC MINOR (AIRS/AFS) STATE MASTER (Indiana facility tracking) Business SIC classification: ASPHALT PAVING MIXTURES AND BLOCKS
58.4%Utility gas
29.5%Electricity
7.8%Bottled, tank, or LP gas
2.5%Wood
2.1%Other fuel
Population in 1990: 1,483. Population change in the 1990s: +123 (+8.3%).
Place of birth for U.S.-born residents:
This state: 1,588
Northeast: 17
Midwest: 153
South: 49
West: 23
79% of the 46745 zip code residents lived in the same house 5 years ago. Out of people who lived in different houses, 91% lived in this county. Out of people who lived in different counties, 50% lived in Indiana.
92% of the 46745 zip code residents lived in the same house 1 year ago. Out of people who lived in different houses, 99% moved from this county.
Private vs. public school enrollment:
Students in private schools in grades 1 to 8 (elementary and middle school): 110
Here:
54.3%
Indiana:
14.9%
Students in private schools in grades 9 to 12 (high school): 21
Here:
18.4%
Indiana:
11.4%
Students in private undergraduate colleges: 10
Here:
22.1%
Indiana:
22.3%
Occupation by median earnings in the past 12 months ($)
149,264Business and financial operations occupations
69,179Management occupations
65,458Installation, maintenance, and repair occupations
62,696Production occupations
51,051Construction and extraction occupations
48,107Health diagnosing and treating practitioners and other technical occupations
Top industries in this zip code by the number of employees in 2005:
Accommodation and Food Services: Limited-Service Restaurants (50-99 employees: 1 establishment)
Accommodation and Food Services: Full-Service Restaurants (20-49: 1, 5-9: 1)
Mining: Crushed and Broken Limestone Mining and Quarrying (20-49: 1)
Construction: Glass and Glazing Contractors (5-9: 1)
Other Services (except Public Administration): Automotive Body, Paint, and Interior Repair and Maintenance (5-9: 1)
Home Mortgage Disclosure Act Aggregated Statistics For Year 2009 (Based on 4 partial tracts)
A) FHA, FSA/RHS & VA Home Purchase Loans
B) Conventional Home Purchase Loans
C) Refinancings
D) Home Improvement Loans
F) Non-occupant Loans on < 5 Family Dwellings (A B C & D)
G) Loans On Manufactured Home Dwelling (A B C & D)
Number
Average Value
Number
Average Value
Number
Average Value
Number
Average Value
Number
Average Value
Number
Average Value
LOANS ORIGINATED
15
$118,694
12
$130,927
78
$134,199
6
$65,648
2
$97,070
0
$0
APPLICATIONS APPROVED, NOT ACCEPTED
0
$0
2
$71,085
8
$89,008
0
$0
1
$60,440
1
$13,050
APPLICATIONS DENIED
4
$94,078
2
$111,935
25
$129,632
0
$0
1
$118,130
1
$8,930
APPLICATIONS WITHDRAWN
2
$199,860
1
$107,140
13
$163,840
1
$3,430
1
$38,460
0
$0
FILES CLOSED FOR INCOMPLETENESS
1
$36,400
0
$0
8
$123,326
0
$0
0
$0
0
$0
Aggregated Statistics For Year 2008 (Based on 4 partial tracts)
A) FHA, FSA/RHS & VA Home Purchase Loans
B) Conventional Home Purchase Loans
C) Refinancings
D) Home Improvement Loans
F) Non-occupant Loans on < 5 Family Dwellings (A B C & D)
G) Loans On Manufactured Home Dwelling (A B C & D)
Number
Average Value
Number
Average Value
Number
Average Value
Number
Average Value
Number
Average Value
Number
Average Value
LOANS ORIGINATED
4
$117,765
13
$141,108
36
$135,759
14
$41,043
3
$105,993
1
$82,610
APPLICATIONS APPROVED, NOT ACCEPTED
0
$0
1
$72,220
5
$140,454
1
$30,760
1
$14,180
1
$84,480
APPLICATIONS DENIED
2
$79,140
3
$80,127
23
$128,868
3
$13,963
1
$66,620
1
$15,110
APPLICATIONS WITHDRAWN
1
$76,000
1
$47,350
13
$153,605
2
$91,085
0
$0
0
$0
FILES CLOSED FOR INCOMPLETENESS
0
$0
0
$0
4
$196,028
0
$0
0
$0
0
$0
Aggregated Statistics For Year 2007 (Based on 4 partial tracts)
A) FHA, FSA/RHS & VA Home Purchase Loans
B) Conventional Home Purchase Loans
C) Refinancings
D) Home Improvement Loans
F) Non-occupant Loans on < 5 Family Dwellings (A B C & D)
G) Loans On Manufactured Home Dwelling (A B C & D)
Number
Average Value
Number
Average Value
Number
Average Value
Number
Average Value
Number
Average Value
Number
Average Value
LOANS ORIGINATED
5
$105,862
19
$116,793
34
$121,147
13
$33,955
1
$110,130
3
$61,163
APPLICATIONS APPROVED, NOT ACCEPTED
0
$0
4
$105,038
7
$130,503
5
$63,598
0
$0
1
$5,490
APPLICATIONS DENIED
2
$65,020
10
$97,964
29
$182,171
6
$29,822
2
$113,775
3
$91,110
APPLICATIONS WITHDRAWN
0
$0
4
$125,892
9
$167,072
2
$215,620
0
$0
0
$0
FILES CLOSED FOR INCOMPLETENESS
0
$0
1
$201,230
7
$152,653
0
$0
0
$0
0
$0
Aggregated Statistics For Year 2006 (Based on 4 partial tracts)
A) FHA, FSA/RHS & VA Home Purchase Loans
B) Conventional Home Purchase Loans
C) Refinancings
D) Home Improvement Loans
F) Non-occupant Loans on < 5 Family Dwellings (A B C & D)
G) Loans On Manufactured Home Dwelling (A B C & D)
Number
Average Value
Number
Average Value
Number
Average Value
Number
Average Value
Number
Average Value
Number
Average Value
LOANS ORIGINATED
3
$88,317
38
$113,425
48
$105,134
15
$33,259
0
$0
2
$40,165
APPLICATIONS APPROVED, NOT ACCEPTED
0
$0
3
$143,540
9
$136,881
2
$27,765
0
$0
0
$0
APPLICATIONS DENIED
0
$0
7
$131,824
26
$92,155
10
$25,740
0
$0
2
$35,825
APPLICATIONS WITHDRAWN
0
$0
4
$68,180
22
$114,668
0
$0
1
$59,060
0
$0
FILES CLOSED FOR INCOMPLETENESS
0
$0
1
$124,400
5
$167,134
0
$0
0
$0
0
$0
Aggregated Statistics For Year 2005 (Based on 4 partial tracts)
A) FHA, FSA/RHS & VA Home Purchase Loans
B) Conventional Home Purchase Loans
C) Refinancings
D) Home Improvement Loans
E) Loans on Dwellings For 5+ Families
F) Non-occupant Loans on < 5 Family Dwellings (A B C & D)
G) Loans On Manufactured Home Dwelling (A B C & D)
Number
Average Value
Number
Average Value
Number
Average Value
Number
Average Value
Number
Average Value
Number
Average Value
Number
Average Value
LOANS ORIGINATED
2
$88,620
32
$127,089
62
$111,453
5
$73,404
1
$188,180
4
$95,660
5
$86,520
APPLICATIONS APPROVED, NOT ACCEPTED
1
$151,160
2
$120,100
19
$104,403
4
$73,440
0
$0
0
$0
3
$81,980
APPLICATIONS DENIED
0
$0
6
$74,295
41
$111,689
8
$33,024
0
$0
1
$139,600
1
$90,660
APPLICATIONS WITHDRAWN
0
$0
7
$94,474
25
$146,915
2
$231,110
0
$0
0
$0
0
$0
FILES CLOSED FOR INCOMPLETENESS
0
$0
3
$77,640
3
$145,433
0
$0
0
$0
1
$26,640
1
$24,040
Aggregated Statistics For Year 2004 (Based on 4 partial tracts)
A) FHA, FSA/RHS & VA Home Purchase Loans
B) Conventional Home Purchase Loans
C) Refinancings
D) Home Improvement Loans
F) Non-occupant Loans on < 5 Family Dwellings (A B C & D)
G) Loans On Manufactured Home Dwelling (A B C & D)
Number
Average Value
Number
Average Value
Number
Average Value
Number
Average Value
Number
Average Value
Number
Average Value
LOANS ORIGINATED
2
$103,365
43
$117,799
72
$108,545
12
$40,122
5
$84,300
6
$51,055
APPLICATIONS APPROVED, NOT ACCEPTED
0
$0
2
$116,905
11
$141,255
0
$0
0
$0
1
$48,760
APPLICATIONS DENIED
0
$0
8
$66,554
37
$102,501
6
$24,028
1
$26,790
7
$45,720
APPLICATIONS WITHDRAWN
1
$105,080
3
$118,817
27
$105,573
4
$37,378
0
$0
0
$0
FILES CLOSED FOR INCOMPLETENESS
0
$0
3
$150,463
3
$161,583
0
$0
0
$0
0
$0
Aggregated Statistics For Year 2003 (Based on 4 partial tracts)
A) FHA, FSA/RHS & VA Home Purchase Loans
B) Conventional Home Purchase Loans
C) Refinancings
D) Home Improvement Loans
F) Non-occupant Loans on < 5 Family Dwellings (A B C & D)
Number
Average Value
Number
Average Value
Number
Average Value
Number
Average Value
Number
Average Value
LOANS ORIGINATED
3
$87,803
41
$120,032
168
$108,207
8
$25,804
3
$73,947
APPLICATIONS APPROVED, NOT ACCEPTED
0
$0
4
$126,260
16
$92,920
2
$9,325
0
$0
APPLICATIONS DENIED
2
$79,180
9
$82,876
41
$135,102
6
$13,167
1
$68,460
APPLICATIONS WITHDRAWN
0
$0
5
$154,914
25
$90,689
0
$0
0
$0
FILES CLOSED FOR INCOMPLETENESS
0
$0
5
$101,936
5
$91,126
0
$0
0
$0
Aggregated Statistics For Year 2002 (Based on 4 partial tracts)
A) FHA, FSA/RHS & VA Home Purchase Loans
B) Conventional Home Purchase Loans
C) Refinancings
D) Home Improvement Loans
F) Non-occupant Loans on < 5 Family Dwellings (A B C & D)
Number
Average Value
Number
Average Value
Number
Average Value
Number
Average Value
Number
Average Value
LOANS ORIGINATED
4
$139,018
34
$115,705
140
$107,189
9
$17,298
1
$63,640
APPLICATIONS APPROVED, NOT ACCEPTED
0
$0
5
$60,988
16
$86,808
1
$21,980
0
$0
APPLICATIONS DENIED
2
$73,830
13
$66,471
27
$75,843
3
$9,843
2
$84,605
APPLICATIONS WITHDRAWN
1
$185,440
2
$70,070
17
$81,800
1
$10,300
1
$18,540
FILES CLOSED FOR INCOMPLETENESS
0
$0
0
$0
5
$87,314
0
$0
0
$0
Aggregated Statistics For Year 2001 (Based on 4 partial tracts)
A) FHA, FSA/RHS & VA Home Purchase Loans
B) Conventional Home Purchase Loans
C) Refinancings
D) Home Improvement Loans
F) Non-occupant Loans on < 5 Family Dwellings (A B C & D)
Number
Average Value
Number
Average Value
Number
Average Value
Number
Average Value
Number
Average Value
LOANS ORIGINATED
4
$109,682
32
$104,738
98
$94,262
12
$14,680
2
$56,320
APPLICATIONS APPROVED, NOT ACCEPTED
0
$0
3
$63,767
10
$63,536
3
$25,087
0
$0
APPLICATIONS DENIED
0
$0
14
$43,983
33
$79,326
6
$23,580
0
$0
APPLICATIONS WITHDRAWN
1
$57,000
2
$111,100
11
$96,566
1
$28,010
0
$0
FILES CLOSED FOR INCOMPLETENESS
0
$0
0
$0
1
$153,860
0
$0
0
$0
Aggregated Statistics For Year 2000 (Based on 4 partial tracts)
A) FHA, FSA/RHS & VA Home Purchase Loans
B) Conventional Home Purchase Loans
C) Refinancings
D) Home Improvement Loans
F) Non-occupant Loans on < 5 Family Dwellings (A B C & D)
Number
Average Value
Number
Average Value
Number
Average Value
Number
Average Value
Number
Average Value
LOANS ORIGINATED
3
$81,330
38
$85,263
44
$74,465
14
$9,041
1
$21,530
APPLICATIONS APPROVED, NOT ACCEPTED
0
$0
4
$129,188
7
$51,213
3
$38,340
1
$17,170
APPLICATIONS DENIED
1
$147,660
22
$39,891
17
$44,120
4
$12,220
1
$61,810
APPLICATIONS WITHDRAWN
0
$0
1
$13,740
13
$67,239
1
$22,620
0
$0
FILES CLOSED FOR INCOMPLETENESS
0
$0
0
$0
1
$95,490
0
$0
0
$0
Aggregated Statistics For Year 1999 (Based on 2 partial tracts)
A) FHA, FSA/RHS & VA Home Purchase Loans
B) Conventional Home Purchase Loans
C) Refinancings
D) Home Improvement Loans
F) Non-occupant Loans on < 5 Family Dwellings (A B C & D)

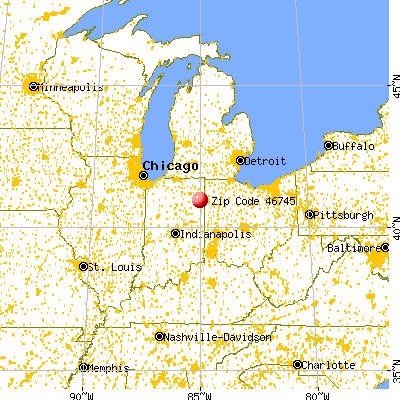


 Nearest zip codes: 46816, 46806, 46819, 46773, 46733, 46803.


