Estimated zip code population in 2022: 3,202 Zip code population in 2010: 3,662 Zip code population in 2000: 3,753
Houses and condos: 1,347 Renter-occupied apartments: 225
% of renters here:
17%
State:
29%
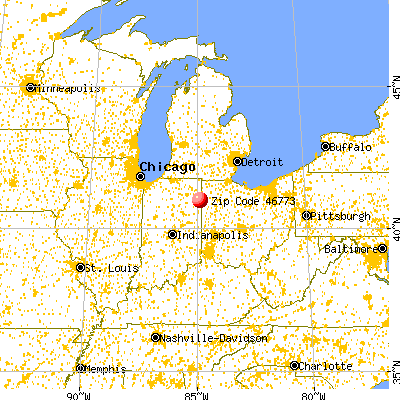
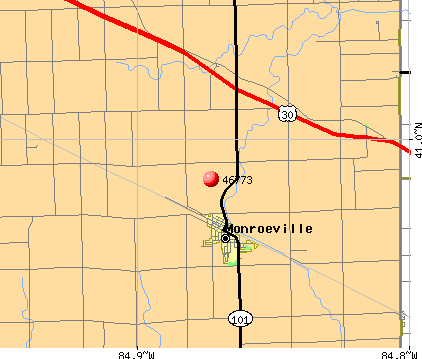
March 2022 cost of living index in zip code 46773: 85.4 (less than average, U.S. average is 100)
Land area: 78.8 sq. mi. Water area: 0.0 sq. mi.
Population density: 41 people per square mile
(very low).
OSM Map
General Map
Google Map
MSN Map
OSM Map
General Map
Google Map
MSN Map
OSM Map
General Map
Google Map
MSN Map
OSM Map
General Map
Google Map
MSN Map
Please wait while loading the map...
Real estate property taxes paid for housing units in 2022:
This zip code:
0.7% ($1,181)
Indiana:
0.7% ($1,467)
Median real estate property taxes paid for housing units with mortgages in 2022: $1,170 (0.6%) Median real estate property taxes paid for housing units with no mortgage in 2022: $1,246 (0.8%)
Estimated median house/condo value in 2022: $180,510
46773:
$180,510
Indiana:
$208,700
Median resident age:
This zip code:
45.1 years
Indiana median age:
38.2 years
Average household size:
This zip code:
2.4 people
Indiana:
2.4 people
Averages for the 2020 tax year for zip code 46773, filed in 2021:
Average Adjusted Gross Income (AGI) in 2020: $61,008 (Individual Income Tax Returns)
Here:
$61,008
State:
$64,978
Salary/wage: $52,150 (reported on 81.7% of returns)
Here:
$52,150
State:
$55,245
(% of AGI for various income ranges: 1269.4% for AGIs below $25k, 3491.9% for AGIs $25k-50k, 6463.3% for AGIs $50k-75k, 9981.3% for AGIs $75k-100k, 15742.5% for AGIs $100k-200k)
Taxable interest for individuals: $1,193 (reported on 37.8% of returns)
This zip code:
$1,193
Indiana:
$1,351
(% of AGI for various income ranges: 23.8% for AGIs below $25k, 41.6% for AGIs $25k-50k, 38.6% for AGIs $50k-75k, 66.0% for AGIs $75k-100k, 198.8% for AGIs $100k-200k)
Ordinary dividends: $2,656 (reported on 18.9% of returns)
Here:
$2,656
State:
$5,827
(% of AGI for various income ranges: 25.0% for AGIs below $25k, 47.8% for AGIs $25k-50k, 54.3% for AGIs $50k-75k, 91.3% for AGIs $75k-100k, 185.6% for AGIs $100k-200k)
Net capital gain/loss in AGI: +$4,488 (reported on 17.8% of returns)
Here:
+$4,488
State:
+$17,730
(% of AGI for various income ranges: 12.4% for AGIs below $25k, 45.7% for AGIs $25k-50k, 66.2% for AGIs $50k-75k, 96.0% for AGIs $75k-100k, 588.8% for AGIs $100k-200k)
Profit/loss from business: +$9,205 (reported on 10.6% of returns)
Here:
+$9,205
State:
+$12,144
(% of AGI for various income ranges: 47.6% for AGIs below $25k, 90.0% for AGIs $25k-50k, 182.4% for AGIs $50k-75k, 196.0% for AGIs $75k-100k, 360.6% for AGIs $100k-200k)
Taxable individual retirement arrangement distribution: $12,318 (reported on 12.2% of returns)
46773:
$12,318
Indiana:
$18,302
(% of AGI for various income ranges: 91.8% for AGIs below $25k, 121.6% for AGIs $25k-50k, 241.4% for AGIs $50k-75k, 354.7% for AGIs $75k-100k, 568.1% for AGIs $100k-200k)
Total itemized deductions: $37,600 (reported on 2.2% of returns)
Here:
$37,600
State:
$35,601
(% of AGI for various income ranges: 940.0% for AGIs $100k-200k)
Charity contributions: $11,100 (reported on 2.2% of returns)
Here:
$11,100
State:
$15,596
(% of AGI for various income ranges: 277.5% for AGIs $100k-200k)
Taxes paid: $6,925 (reported on 2.2% of returns)
46773:
$6,925
State:
$7,542
(% of AGI for various income ranges: 173.1% for AGIs $100k-200k)
Earned income credit: $2,200 (reported on 11.1% of returns)
Here:
$2,200
State:
$2,298
(% of AGI for various income ranges: 71.2% for AGIs below $25k, 53.5% for AGIs $25k-50k)
Percentage of individuals using paid preparers for their 2020 taxes: 92.2%
Here:
92%
State:
94%
(% for various income ranges: 90.4% for AGIs below $25k, 91.7% for AGIs $25k-50k, 96.6% for AGIs $50k-75k, 91.3% for AGIs $75k-100k, 92.0% for AGIs $100k-200k, 100.0% for AGIs over 200k)
Averages for the 2012 tax year for zip code 46773, filed in 2013:
Average Adjusted Gross Income (AGI) in 2012: $49,397 (Individual Income Tax Returns)
Here:
$49,397
State:
$52,932
Salary/wage: $41,726 (reported on 81.4% of returns)
Here:
$41,726
State:
$45,173
(% of AGI for various income ranges: 68.0% for AGIs below $25k, 75.8% for AGIs $25k-50k, 78.0% for AGIs $50k-75k, 80.6% for AGIs $75k-100k, 67.5% for AGIs $100k-200k, 30.9% for AGIs over 200k)
Taxable interest for individuals: $825 (reported on 39.0% of returns)
This zip code:
$825
Indiana:
$1,311
(% of AGI for various income ranges: 1.3% for AGIs below $25k, 0.7% for AGIs $25k-50k, 0.7% for AGIs $50k-75k, 0.5% for AGIs $75k-100k, 0.6% for AGIs $100k-200k, 0.4% for AGIs over 200k)
Ordinary dividends: $1,679 (reported on 22.0% of returns)
Here:
$1,679
State:
$4,690
(% of AGI for various income ranges: 1.2% for AGIs below $25k, 1.0% for AGIs $25k-50k, 0.8% for AGIs $50k-75k, 0.7% for AGIs $75k-100k, 0.8% for AGIs $100k-200k)
Net capital gain/loss in AGI: +$2,316 (reported on 14.1% of returns)
Here:
+$2,316
State:
+$10,406
(% of AGI for various income ranges: 3.2% for AGIs $100k-200k)
Profit/loss from business: +$7,271 (reported on 11.9% of returns)
Here:
+$7,271
State:
+$11,105
(% of AGI for various income ranges: 5.0% for AGIs below $25k, 1.7% for AGIs $25k-50k, 2.4% for AGIs $50k-75k, 1.4% for AGIs $75k-100k, 1.2% for AGIs $100k-200k)
Taxable individual retirement arrangement distribution: $7,456 (reported on 14.1% of returns)
46773:
$7,456
Indiana:
$13,841
(% of AGI for various income ranges: 3.7% for AGIs below $25k, 2.6% for AGIs $25k-50k, 2.4% for AGIs $50k-75k, 1.3% for AGIs $75k-100k, 2.9% for AGIs $100k-200k)
Total itemized deductions: $18,532 (20% of AGI, reported on 22.6% of returns)
Here:
$18,532
State:
$20,913
Here:
19.6% of AGI
State:
18.2% of AGI
(% of AGI for various income ranges: 5.9% for AGIs below $25k, 5.8% for AGIs $25k-50k, 7.6% for AGIs $50k-75k, 9.2% for AGIs $75k-100k, 8.4% for AGIs $100k-200k, 14.2% for AGIs over 200k)
Charity contributions: $4,953 (reported on 18.1% of returns)
Here:
$4,953
State:
$4,697
(% of AGI for various income ranges: 0.8% for AGIs below $25k, 1.2% for AGIs $25k-50k, 1.1% for AGIs $50k-75k, 1.9% for AGIs $75k-100k, 2.5% for AGIs $100k-200k, 3.0% for AGIs over 200k)
Taxes paid: $5,990 (reported on 22.6% of returns)
46773:
$5,990
State:
$7,456
(% of AGI for various income ranges: 0.8% for AGIs below $25k, 1.2% for AGIs $25k-50k, 1.9% for AGIs $50k-75k, 3.2% for AGIs $75k-100k, 3.3% for AGIs $100k-200k, 5.7% for AGIs over 200k)
Earned income credit: $2,083 (reported on 13.0% of returns)
Here:
$2,083
State:
$2,265
(% of AGI for various income ranges: 4.2% for AGIs below $25k, 0.9% for AGIs $25k-50k)
Percentage of individuals using paid preparers for their 2012 taxes: 58.8%
Here:
59%
State:
53%
(% for various income ranges: 51.4% for AGIs below $25k, 59.5% for AGIs $25k-50k, 64.3% for AGIs $50k-75k, 68.4% for AGIs $75k-100k, 66.7% for AGIs $100k-200k, 66.7% for AGIs over 200k)
Averages for the 2004 tax year for zip code 46773, filed in 2005:
Average Adjusted Gross Income (AGI) in 2004: $38,574 (Individual Income Tax Returns)
Here:
$38,574
State:
$44,790
Salary/wage: $36,958 (reported on 83.5% of returns)
Here:
$36,958
State:
$39,615
(% of AGI for various income ranges: 86.8% for AGIs below $10k, 67.6% for AGIs $10k-25k, 83.3% for AGIs $25k-50k, 85.7% for AGIs $50k-75k, 89.8% for AGIs $75k-100k, 60.4% for AGIs over 100k)
Taxable interest for individuals: $1,111 (reported on 54.4% of returns)
This zip code:
$1,111
Indiana:
$1,535
(% of AGI for various income ranges: 8.6% for AGIs below $10k, 4.5% for AGIs $10k-25k, 1.7% for AGIs $25k-50k, 0.9% for AGIs $50k-75k, 0.8% for AGIs $75k-100k, 0.5% for AGIs over 100k)
Taxable dividends: $1,428 (reported on 23.7% of returns)
Here:
$1,428
State:
$2,998
(% of AGI for various income ranges: 2.2% for AGIs below $10k, 2.1% for AGIs $10k-25k, 0.7% for AGIs $25k-50k, 0.8% for AGIs $50k-75k, 0.9% for AGIs $75k-100k, 0.3% for AGIs over 100k)
Net capital gain/loss: +$2,709 (reported on 18.1% of returns)
Here:
+$2,709
State:
+$8,619
(% of AGI for various income ranges: -1.5% for AGIs below $10k, 0.6% for AGIs $10k-25k, 0.9% for AGIs $25k-50k, 1.3% for AGIs $50k-75k, 0.4% for AGIs $75k-100k, 3.4% for AGIs over 100k)
Profit/loss from business: +$4,601 (reported on 13.9% of returns)
Here:
+$4,601
State:
+$10,071
(% of AGI for various income ranges: 4.7% for AGIs below $10k, 4.5% for AGIs $10k-25k, 1.0% for AGIs $25k-50k, 2.2% for AGIs $50k-75k, 1.1% for AGIs $75k-100k, -0.0% for AGIs over 100k)
IRA payment deduction: $2,574 (reported on 2.6% of returns)
46773:
$2,574
Indiana:
$2,840
Total itemized deductions: $15,827 (23% of AGI, reported on 26.5% of returns)
Here:
$15,827
State:
$17,065
Here:
23.1% of AGI
State:
19.5% of AGI
(% of AGI for various income ranges: 8.1% for AGIs below $10k, 8.3% for AGIs $10k-25k, 7.4% for AGIs $25k-50k, 11.4% for AGIs $50k-75k, 12.8% for AGIs $75k-100k, 14.9% for AGIs over 100k)
Charity contributions deductions: $3,051 (4% of AGI, reported on 23.1% of returns)
Here:
$3,051
State:
$3,550
Here:
4.4% of AGI
State:
3.8% of AGI
(% of AGI for various income ranges: 0.9% for AGIs below $10k, 1.7% for AGIs $10k-25k, 1.1% for AGIs $25k-50k, 1.7% for AGIs $50k-75k, 2.0% for AGIs $75k-100k, 3.0% for AGIs over 100k)
Total tax: $4,499 (reported on 76.0% of returns)
46773:
$4,499
State:
$6,914
(% of AGI for various income ranges: 1.8% for AGIs below $10k, 4.4% for AGIs $10k-25k, 6.4% for AGIs $25k-50k, 7.7% for AGIs $50k-75k, 10.0% for AGIs $75k-100k, 17.2% for AGIs over 100k)
Earned income credit: $1,500 (reported on 10.5% of returns)
Here:
$1,500
State:
$1,685
Percentage of individuals using paid preparers for their 2004 taxes: 65.5%
Here:
66%
State:
59%
(% for various income ranges: 59.7% for AGIs below $10k, 62.6% for AGIs $10k-25k, 69.4% for AGIs $25k-50k, 67.3% for AGIs $50k-75k, 68.8% for AGIs $75k-100k, 72.9% for AGIs over 100k)
Household received Food Stamps/SNAP in the past 12 months: 23 Household did not receive Food Stamps/SNAP in the past 12 months: 1,259
Women who had a birth in the past 12 months: 24 (20 now married, 4 unmarried) Women who did not have a birth in the past 12 months: 451 (243 now married, 208 unmarried)
Housing units in zip code 46773 with a mortgage: 602 (55 second mortgage, 53 both second mortgage and home equity loan) Houses without a mortgage: 26
Median monthly owner costs for units with a mortgage: $1,101 Median monthly owner costs for units without a mortgage: $441
Residents with income below the poverty level in 2022:
This zip code:
4.1%
Whole state:
12.6%
Residents with income below 50% of the poverty level in 2022:
This zip code:
2.3%
Whole state:
6.3%
Median number of rooms in houses and condos:
Here:
6.5
State:
6.6
Median number of rooms in apartments:
Here:
4.9
State:
4.3
Notable locations in this zip code not listed on our city pages
In group quarters: 58 (-1 institutionalized population)
Size of family households: 465 2-persons, 142 3-persons, 99 4-persons, 133 5-persons, 26 6-persons, 21 7-or-more-persons
Size of nonfamily households: 370 1-person, 25 2-persons, 2 3-persons
573 married couples with children.
83 single-parent households (32 men, 51 women).
97.3% of residents of 46773 zip code speak English at home.
1.2% of residents speak Spanish at home (100% very well).
0.8% of residents speak other Indo-European language at home (100% very well).
Foreign born population: 3 (0.1%) (100.0% of them are naturalized citizens)
This zip code:
0.1%
Whole state:
6.1%
67%France
43%German
20%American
10%English
8%Irish
4%French
3%Dutch
3%European
Year of entry for the foreign-born population
52010 or later
02000 to 2009
01990 to 1999
2Before 1990
Facilities with environmental interests located in this zip code:
MONROEVILLE ELEMENTARY SCHOOL (401 S MONROE ST in MONROEVILLE, IN)
STATE MASTER (Indiana facility tracking) - LUST-199311560, LEAKING STORAGE TANK, UST-13900, UNDERGROUND STORAGE TANK PROGRAM (National Center for Education Statistics) - STATE ID-0073 Organizations: EAST ALLEN COUNTY SCHOOLS (SCHOOL DISTRICT)
PANHANDLE EASTERN PIPELINE (25419 PAULDING ROAD in MONROEVILLE, IN)
AIR MAJOR (AIRS/AFS) STATE MASTER (Indiana facility tracking) - ACES-OP-00300045, AIR PROGRAM, CRTK-4622, EPCRA CRITERIA AND HAZARDOUS AIR POLLUTANT INVENTORY (Inventory of air pollution sources) Small Quantity Generators, between 100 kg and 1000 kg of hazardous waste/month (Resource Conservation and Recovery Act (tracking hazardous waste)) Business SIC classification: NATURAL GAS TRANSMISSION Organizations: PEPL-EDGERTON (CONTACT/OPERATOR)
, PANHANDLE EASTERN PIPE LINE COMPANY (CONTACT/OWNER)
Alternative names: PEPL EDGERTON
MONROEVILLE MUNICIPAL WWTP (200 UTILITY DR in MONROEVILLE, IN)
STATE MASTER (Indiana facility tracking) National Pollutant Discharge Elimination System NON-MAJOR (Tracking pollutant discharge elimination systems) - permit Business SIC classification: SEWERAGE SYSTEMS Organizations: MARK JOHNSON 13377 (CONTACT/OPERATOR)
, MONROEVILLE MUNICIPAL STP (CONTACT/OWNER)
Alternative names: MONROEVILLE MUNICIPAL STP
CME AUTOMOTIVE (21600 MONROEVILLE ROAD in MONROEVILLE, IN)
STATE MASTER (Indiana facility tracking) Conditionally Exempt Small Quantity Generators, less than 100 kg/month of hazardous waste (Resource Conservation and Recovery Act (tracking hazardous waste)) TRI REPORTER (Tracking of toxic chemicals releasing facilities) Business SIC classification: MOTOR VEHICLE PARTS AND ACCESSORIES Business NAICS classification: OTHER MOTOR VEHICLE ELECTRICAL AND ELECTRONIC EQUIPMENT MANUFACTURING. Organizations: CME AUTOMOTIVE CORP (CONTACT/OPERATOR)
, CME CORP (CONTACT/OWNER)
RECKON (12919 S MCARDLE RD in MONROEVILLE, IN)
STATE MASTER (Indiana facility tracking) (Resource Conservation and Recovery Act (tracking hazardous waste)) Organizations: SARKER KASHEM (CONTACT/OWNER)
RUBLE TOM AND SONS TRUCK SALES (23834 CARRIER RD in MONROEVILLE, IN)
STATE MASTER (Indiana facility tracking) Conditionally Exempt Small Quantity Generators, less than 100 kg/month of hazardous waste (Resource Conservation and Recovery Act (tracking hazardous waste))
MARQUARDT J AND SONS (20125 MONROEVILLE RD in MONROEVILLE, IN)
STATE MASTER (Indiana facility tracking) TRANSPORTER (Resource Conservation and Recovery Act (tracking hazardous waste)) Organizations: MARQUARDT MARY (CONTACT/OWNER)
Housing units lacking complete plumbing facilities: 0.1% Housing units lacking complete kitchen facilities: 0.9%
36.4%Utility gas
34.4%Bottled, tank, or LP gas
24.2%Electricity
2.2%No fuel used
1.9%Wood
1.1%Fuel oil, kerosene, etc.
Population in 1990: 4,093.
Place of birth for U.S.-born residents:
This state: 2,718
Northeast: 19
Midwest: 279
South: 69
West: 89
70% of the 46773 zip code residents lived in the same house 5 years ago. Out of people who lived in different houses, 78% lived in this county. Out of people who lived in different counties, 50% lived in Indiana.
95% of the 46773 zip code residents lived in the same house 1 year ago. Out of people who lived in different houses, 68% moved from this county. Out of people who lived in different houses, 14% moved from different county within same state. Out of people who lived in different houses, 26% moved from different state.
Private vs. public school enrollment:
Students in private schools in grades 1 to 8 (elementary and middle school): 240
Here:
70.3%
Indiana:
14.9%
Students in private schools in grades 9 to 12 (high school): 21
Here:
14.6%
Indiana:
11.4%
Students in private undergraduate colleges: 6
Here:
8.6%
Indiana:
22.3%
Occupation by median earnings in the past 12 months ($)
69,186Architecture and engineering occupations
68,576Management occupations
68,319Computer and mathematical occupations
68,267Installation, maintenance, and repair occupations
60,292Business and financial operations occupations
57,273Construction and extraction occupations
Top industries in this zip code by the number of employees in 2005:
Other Services (except Public Administration): Religious Organizations (10-19 employees: 1 establishment, 5-9 employees: 1 establishment, 1-4 employees: 3 establishments)
Accommodation and Food Services: Full-Service Restaurants (10-19: 1, 1-4: 3)
Accommodation and Food Services: Snack and Nonalcoholic Beverage Bars (10-19: 1)
People in group quarters in 2010:
58 people in nursing facilities/skilled-nursing facilities
People in group quarters in 2000:
4 people in other noninstitutional group quarters
Fatal accident statistics in 2013:
Fatal accident count: 1
Vehicles involved in fatal accidents: 1
Fatal accidents caused by drunken drivers: 1
Fatalities: 1
Persons involved in fatal accidents: 1
Pedestrians involved in fatal accidents: 0
Fatal accident statistics in 2011:
Fatal accident count: 1
Vehicles involved in fatal accidents: 2
Fatal accidents caused by drunken drivers: 1
Fatalities: 1
Persons involved in fatal accidents: 3
Pedestrians involved in fatal accidents: 0
Home Mortgage Disclosure Act Aggregated Statistics For Year 2009 (Based on 1 full and 4 partial tracts)
A) FHA, FSA/RHS & VA Home Purchase Loans
B) Conventional Home Purchase Loans
C) Refinancings
D) Home Improvement Loans
F) Non-occupant Loans on < 5 Family Dwellings (A B C & D)
G) Loans On Manufactured Home Dwelling (A B C & D)
Number
Average Value
Number
Average Value
Number
Average Value
Number
Average Value
Number
Average Value
Number
Average Value
LOANS ORIGINATED
36
$105,589
22
$102,734
150
$120,610
8
$65,592
3
$93,227
1
$123,750
APPLICATIONS APPROVED, NOT ACCEPTED
1
$105,020
1
$101,160
16
$114,042
3
$10,667
1
$66,410
0
$0
APPLICATIONS DENIED
9
$91,343
6
$139,328
58
$120,460
5
$18,952
1
$94,980
4
$44,362
APPLICATIONS WITHDRAWN
1
$56,370
2
$86,635
31
$111,653
3
$10,283
0
$0
0
$0
FILES CLOSED FOR INCOMPLETENESS
1
$81,850
1
$80,310
15
$135,773
0
$0
0
$0
0
$0
Aggregated Statistics For Year 2008 (Based on 1 full and 4 partial tracts)
A) FHA, FSA/RHS & VA Home Purchase Loans
B) Conventional Home Purchase Loans
C) Refinancings
D) Home Improvement Loans
F) Non-occupant Loans on < 5 Family Dwellings (A B C & D)
G) Loans On Manufactured Home Dwelling (A B C & D)
Number
Average Value
Number
Average Value
Number
Average Value
Number
Average Value
Number
Average Value
Number
Average Value
LOANS ORIGINATED
24
$115,376
28
$117,810
78
$109,530
18
$21,568
6
$63,787
5
$55,870
APPLICATIONS APPROVED, NOT ACCEPTED
0
$0
5
$65,330
8
$75,946
7
$17,690
3
$21,543
0
$0
APPLICATIONS DENIED
9
$70,496
4
$71,405
52
$111,581
6
$53,142
0
$0
4
$49,035
APPLICATIONS WITHDRAWN
5
$91,710
5
$80,396
16
$156,398
4
$92,165
1
$46,750
1
$122,380
FILES CLOSED FOR INCOMPLETENESS
0
$0
0
$0
10
$108,095
0
$0
0
$0
0
$0
Aggregated Statistics For Year 2007 (Based on 1 full and 4 partial tracts)
A) FHA, FSA/RHS & VA Home Purchase Loans
B) Conventional Home Purchase Loans
C) Refinancings
D) Home Improvement Loans
F) Non-occupant Loans on < 5 Family Dwellings (A B C & D)
G) Loans On Manufactured Home Dwelling (A B C & D)
Number
Average Value
Number
Average Value
Number
Average Value
Number
Average Value
Number
Average Value
Number
Average Value
LOANS ORIGINATED
11
$87,898
55
$92,282
82
$90,652
24
$20,898
9
$64,662
3
$81,583
APPLICATIONS APPROVED, NOT ACCEPTED
0
$0
13
$91,764
16
$139,719
2
$22,395
0
$0
1
$105,000
APPLICATIONS DENIED
1
$82,500
20
$97,887
73
$120,980
16
$25,221
10
$147,338
8
$72,036
APPLICATIONS WITHDRAWN
1
$40,930
16
$89,621
22
$105,844
1
$24,750
3
$93,167
1
$40,000
FILES CLOSED FOR INCOMPLETENESS
0
$0
0
$0
12
$125,634
1
$69,000
0
$0
0
$0
Aggregated Statistics For Year 2006 (Based on 1 full and 4 partial tracts)
A) FHA, FSA/RHS & VA Home Purchase Loans
B) Conventional Home Purchase Loans
C) Refinancings
D) Home Improvement Loans
F) Non-occupant Loans on < 5 Family Dwellings (A B C & D)
G) Loans On Manufactured Home Dwelling (A B C & D)
Number
Average Value
Number
Average Value
Number
Average Value
Number
Average Value
Number
Average Value
Number
Average Value
LOANS ORIGINATED
7
$96,601
88
$103,253
91
$87,427
24
$27,672
3
$45,667
2
$72,215
APPLICATIONS APPROVED, NOT ACCEPTED
0
$0
6
$65,472
23
$93,679
10
$47,812
0
$0
0
$0
APPLICATIONS DENIED
3
$107,850
14
$131,993
52
$106,743
15
$12,231
0
$0
3
$78,417
APPLICATIONS WITHDRAWN
1
$119,630
11
$83,003
47
$116,927
2
$23,405
0
$0
0
$0
FILES CLOSED FOR INCOMPLETENESS
2
$139,190
3
$85,057
13
$130,039
1
$73,360
0
$0
0
$0
Aggregated Statistics For Year 2005 (Based on 1 full and 4 partial tracts)
A) FHA, FSA/RHS & VA Home Purchase Loans
B) Conventional Home Purchase Loans
C) Refinancings
D) Home Improvement Loans
F) Non-occupant Loans on < 5 Family Dwellings (A B C & D)
G) Loans On Manufactured Home Dwelling (A B C & D)
Number
Average Value
Number
Average Value
Number
Average Value
Number
Average Value
Number
Average Value
Number
Average Value
LOANS ORIGINATED
11
$98,889
77
$100,710
119
$102,431
17
$55,536
5
$147,138
5
$77,298
APPLICATIONS APPROVED, NOT ACCEPTED
4
$131,948
11
$105,553
21
$102,309
7
$22,947
1
$43,240
3
$97,167
APPLICATIONS DENIED
1
$133,380
22
$72,225
84
$103,135
14
$49,812
6
$148,192
2
$17,290
APPLICATIONS WITHDRAWN
0
$0
13
$106,265
65
$128,089
3
$134,273
3
$84,333
1
$28,570
FILES CLOSED FOR INCOMPLETENESS
0
$0
2
$130,690
12
$99,401
3
$69,147
1
$83,880
0
$0
Aggregated Statistics For Year 2004 (Based on 1 full and 4 partial tracts)
A) FHA, FSA/RHS & VA Home Purchase Loans
B) Conventional Home Purchase Loans
C) Refinancings
D) Home Improvement Loans
F) Non-occupant Loans on < 5 Family Dwellings (A B C & D)
G) Loans On Manufactured Home Dwelling (A B C & D)
Number
Average Value
Number
Average Value
Number
Average Value
Number
Average Value
Number
Average Value
Number
Average Value
LOANS ORIGINATED
6
$75,062
81
$102,171
134
$99,364
25
$29,565
8
$60,131
4
$84,375
APPLICATIONS APPROVED, NOT ACCEPTED
3
$94,333
14
$121,714
20
$90,994
1
$9,000
3
$59,080
1
$31,660
APPLICATIONS DENIED
2
$127,205
18
$80,900
53
$117,306
6
$34,972
3
$51,777
4
$53,875
APPLICATIONS WITHDRAWN
0
$0
4
$143,822
39
$111,371
7
$38,573
0
$0
0
$0
FILES CLOSED FOR INCOMPLETENESS
0
$0
7
$89,243
7
$117,643
0
$0
0
$0
1
$14,000
Aggregated Statistics For Year 2003 (Based on 1 full and 4 partial tracts)
A) FHA, FSA/RHS & VA Home Purchase Loans
B) Conventional Home Purchase Loans
C) Refinancings
D) Home Improvement Loans
F) Non-occupant Loans on < 5 Family Dwellings (A B C & D)
Number
Average Value
Number
Average Value
Number
Average Value
Number
Average Value
Number
Average Value
LOANS ORIGINATED
15
$90,491
86
$93,275
323
$93,824
20
$24,460
18
$53,307
APPLICATIONS APPROVED, NOT ACCEPTED
0
$0
8
$85,270
27
$92,625
1
$19,250
1
$21,000
APPLICATIONS DENIED
2
$81,555
22
$89,017
78
$90,451
6
$6,363
9
$54,133
APPLICATIONS WITHDRAWN
1
$141,630
6
$100,105
54
$95,814
0
$0
0
$0
FILES CLOSED FOR INCOMPLETENESS
1
$66,410
3
$134,750
17
$114,586
0
$0
1
$111,380
Aggregated Statistics For Year 2002 (Based on 1 full and 4 partial tracts)
A) FHA, FSA/RHS & VA Home Purchase Loans
B) Conventional Home Purchase Loans
C) Refinancings
D) Home Improvement Loans
F) Non-occupant Loans on < 5 Family Dwellings (A B C & D)
Number
Average Value
Number
Average Value
Number
Average Value
Number
Average Value
Number
Average Value
LOANS ORIGINATED
10
$87,687
79
$95,190
240
$93,339
13
$31,908
8
$53,328
APPLICATIONS APPROVED, NOT ACCEPTED
0
$0
4
$73,268
25
$80,510
1
$84,170
1
$23,000
APPLICATIONS DENIED
1
$96,000
13
$95,292
41
$81,449
7
$16,393
1
$104,500
APPLICATIONS WITHDRAWN
0
$0
4
$73,038
22
$94,115
0
$0
0
$0
FILES CLOSED FOR INCOMPLETENESS
0
$0
2
$93,050
17
$101,350
0
$0
1
$47,880
Aggregated Statistics For Year 2001 (Based on 1 full and 4 partial tracts)
A) FHA, FSA/RHS & VA Home Purchase Loans
B) Conventional Home Purchase Loans
C) Refinancings
D) Home Improvement Loans
F) Non-occupant Loans on < 5 Family Dwellings (A B C & D)
Number
Average Value
Number
Average Value
Number
Average Value
Number
Average Value
Number
Average Value
LOANS ORIGINATED
13
$90,647
65
$89,054
217
$79,642
16
$20,468
4
$42,250
APPLICATIONS APPROVED, NOT ACCEPTED
0
$0
5
$53,546
26
$73,963
5
$14,530
2
$58,190
APPLICATIONS DENIED
2
$83,010
15
$55,415
82
$77,478
6
$7,887
2
$64,625
APPLICATIONS WITHDRAWN
0
$0
5
$82,024
29
$73,417
2
$89,040
0
$0
FILES CLOSED FOR INCOMPLETENESS
0
$0
1
$55,600
8
$82,662
0
$0
0
$0
Aggregated Statistics For Year 2000 (Based on 1 full and 4 partial tracts)
A) FHA, FSA/RHS & VA Home Purchase Loans
B) Conventional Home Purchase Loans
C) Refinancings
D) Home Improvement Loans
E) Loans on Dwellings For 5+ Families
F) Non-occupant Loans on < 5 Family Dwellings (A B C & D)
Number
Average Value
Number
Average Value
Number
Average Value
Number
Average Value
Number
Average Value
Number
Average Value
LOANS ORIGINATED
13
$84,635
66
$80,373
77
$67,143
35
$14,968
1
$440,000
3
$41,843
APPLICATIONS APPROVED, NOT ACCEPTED
1
$41,000
12
$70,148
24
$49,957
10
$21,071
0
$0
0
$0
APPLICATIONS DENIED
5
$79,020
35
$41,486
39
$48,476
22
$15,937
0
$0
1
$49,000
APPLICATIONS WITHDRAWN
1
$116,000
0
$0
26
$68,111
7
$17,717
0
$0
0
$0
FILES CLOSED FOR INCOMPLETENESS
0
$0
1
$188,380
6
$65,158
0
$0
0
$0
1
$25,000
Aggregated Statistics For Year 1999 (Based on 1 full and 2 partial tracts)
A) FHA, FSA/RHS & VA Home Purchase Loans
B) Conventional Home Purchase Loans
C) Refinancings
D) Home Improvement Loans
E) Loans on Dwellings For 5+ Families
F) Non-occupant Loans on < 5 Family Dwellings (A B C & D)
2002 - 2017 National Fire Incident Reporting System (NFIRS) incidents
Based on the data from the years 2002 - 2017 the average number of fire incidents per year is 22. The highest number of reported fires - 40 took place in 2005, and the least - 0 in 2014. The data has a dropping trend.
When looking into fire subcategories, the most incidents belonged to: Structure Fires (43.2%), and Outside Fires (38.0%).
Fire incident types reported to NFIRS in Zip Code 46773


 Nearest zip codes: 46745, 46774, 46797, 45832, 46816, 46733.


 Based on the data from the years 2002 - 2017 the average number of fire incidents per year is 22. The highest number of reported fires - 40 took place in 2005, and the least - 0 in 2014. The data has a dropping trend.
 When looking into fire subcategories, the most incidents belonged to: Structure Fires (43.2%), and Outside Fires (38.0%).