Estimated zip code population in 2022: 2,409 Zip code population in 2010: 2,166 Zip code population in 2000: 2,191
Houses and condos: 1,134 Renter-occupied apartments: 56
% of renters here:
6%
State:
29%
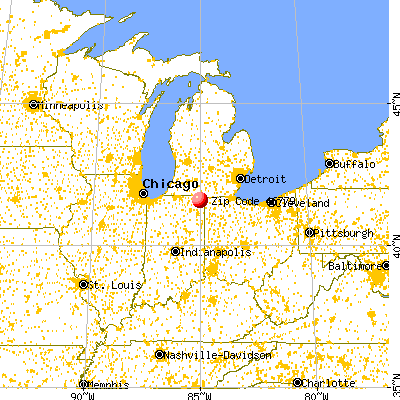
March 2022 cost of living index in zip code 46779: 85.0 (less than average, U.S. average is 100)
Land area: 35.4 sq. mi. Water area: 0.7 sq. mi.
Population density: 68 people per square mile
(very low).
OSM Map
General Map
Google Map
MSN Map
OSM Map
General Map
Google Map
MSN Map
OSM Map
General Map
Google Map
MSN Map
OSM Map
General Map
Google Map
MSN Map
Please wait while loading the map...
Real estate property taxes paid for housing units in 2022:
This zip code:
0.6% ($1,086)
Indiana:
0.7% ($1,467)
Median real estate property taxes paid for housing units with mortgages in 2022: $1,157 (0.5%) Median real estate property taxes paid for housing units with no mortgage in 2022: $975 (0.7%)
Business Search- 14 Million verified businesses
Males: 1,323
(54.9%)
Females: 1,086
(45.1%)
For population 25 years and over in 46779:
High school or higher: 95.3%
Bachelor's degree or higher: 11.7%
Graduate or professional degree: 1.4%
Unemployed: 14.1%
Mean travel time to work (commute): 22.1 minutes
For population 15 years and over in 46779:
Never married: 23.8%
Now married: 66.4%
Separated: 0.6%
Widowed: 3.4%
Divorced: 5.9%
Zip code 46779 compared to state average:
Unemployed percentage significantly above state average.
Black race population percentage significantly below state average.
Hispanic race population percentage significantly below state average.
Median age significantly above state average.
Foreign-born population percentage significantly below state average.
Renting percentage significantly below state average.
Length of stay since moving in significantly below state average.
Number of college students below state average.
Percentage of population with a bachelor's degree or higher significantly below state average.
Estimated median house/condo value in 2022: $191,990
46779:
$191,990
Indiana:
$208,700
Median resident age:
This zip code:
46.2 years
Indiana median age:
38.2 years
Average household size:
This zip code:
2.7 people
Indiana:
2.4 people
Averages for the 2020 tax year for zip code 46779, filed in 2021:
Average Adjusted Gross Income (AGI) in 2020: $52,950 (Individual Income Tax Returns)
Here:
$52,950
State:
$64,978
Salary/wage: $49,577 (reported on 81.0% of returns)
Here:
$49,577
State:
$55,245
(% of AGI for various income ranges: 1160.4% for AGIs below $25k, 3504.1% for AGIs $25k-50k, 6222.7% for AGIs $50k-75k, 8361.4% for AGIs $75k-100k, 21206.2% for AGIs $100k-200k)
Taxable interest for individuals: $620 (reported on 25.0% of returns)
This zip code:
$620
Indiana:
$1,351
(% of AGI for various income ranges: 20.0% for AGIs below $25k, 8.6% for AGIs $25k-50k, 27.3% for AGIs $50k-75k, 32.9% for AGIs $75k-100k, 43.8% for AGIs $100k-200k)
Ordinary dividends: $2,507 (reported on 15.0% of returns)
Here:
$2,507
State:
$5,827
(% of AGI for various income ranges: 22.1% for AGIs below $25k, 22.7% for AGIs $25k-50k, 141.8% for AGIs $50k-75k, 146.2% for AGIs $100k-200k)
Net capital gain/loss in AGI: +$5,693 (reported on 14.0% of returns)
Here:
+$5,693
State:
+$17,730
(% of AGI for various income ranges: 28.2% for AGIs $25k-50k, 208.2% for AGIs $50k-75k, 633.8% for AGIs $100k-200k)
Profit/loss from business: +$8,679 (reported on 14.0% of returns)
Here:
+$8,679
State:
+$12,144
(% of AGI for various income ranges: 38.3% for AGIs below $25k, 96.4% for AGIs $25k-50k, 234.5% for AGIs $50k-75k, 816.2% for AGIs $100k-200k)
Taxable individual retirement arrangement distribution: $13,120 (reported on 15.0% of returns)
46779:
$13,120
Indiana:
$18,302
(% of AGI for various income ranges: 76.2% for AGIs below $25k, 166.4% for AGIs $25k-50k, 629.1% for AGIs $50k-75k, 908.8% for AGIs $100k-200k)
Earned income credit: $2,162 (reported on 13.0% of returns)
Here:
$2,162
State:
$2,298
(% of AGI for various income ranges: 67.1% for AGIs below $25k, 54.5% for AGIs $25k-50k)
Percentage of individuals using paid preparers for their 2020 taxes: 95.0%
Here:
95%
State:
94%
(% for various income ranges: 94.1% for AGIs below $25k, 92.6% for AGIs $25k-50k, 93.8% for AGIs $50k-75k, 100.0% for AGIs $75k-100k, 100.0% for AGIs $100k-200k)
Averages for the 2012 tax year for zip code 46779, filed in 2013:
Average Adjusted Gross Income (AGI) in 2012: $42,016 (Individual Income Tax Returns)
Here:
$42,016
State:
$52,932
Salary/wage: $36,985 (reported on 84.5% of returns)
Here:
$36,985
State:
$45,173
(% of AGI for various income ranges: 72.2% for AGIs below $25k, 83.8% for AGIs $25k-50k, 80.1% for AGIs $50k-75k, 80.3% for AGIs $75k-100k, 56.5% for AGIs $100k-200k)
Taxable interest for individuals: $1,059 (reported on 27.8% of returns)
This zip code:
$1,059
Indiana:
$1,311
(% of AGI for various income ranges: 1.8% for AGIs below $25k, 0.5% for AGIs $25k-50k, 0.3% for AGIs $50k-75k, 1.2% for AGIs $75k-100k, 0.3% for AGIs $100k-200k)
Ordinary dividends: $1,521 (reported on 14.4% of returns)
Here:
$1,521
State:
$4,690
(% of AGI for various income ranges: 0.5% for AGIs below $25k, 0.5% for AGIs $25k-50k, 0.4% for AGIs $50k-75k, 0.8% for AGIs $75k-100k, 0.4% for AGIs $100k-200k)
Net capital gain/loss in AGI: +$14,000 (reported on 10.3% of returns)
Here:
+$14,000
State:
+$10,406
(% of AGI for various income ranges: 0.7% for AGIs $50k-75k, 14.0% for AGIs $100k-200k)
Profit/loss from business: +$2,046 (reported on 13.4% of returns)
Here:
+$2,046
State:
+$11,105
(% of AGI for various income ranges: 1.7% for AGIs below $25k, 0.7% for AGIs $25k-50k, 1.2% for AGIs $50k-75k)
Taxable individual retirement arrangement distribution: $9,967 (reported on 12.4% of returns)
46779:
$9,967
Indiana:
$13,841
(% of AGI for various income ranges: 4.2% for AGIs below $25k, 3.7% for AGIs $25k-50k, 8.2% for AGIs $75k-100k)
Total itemized deductions: $15,985 (21% of AGI, reported on 20.6% of returns)
Here:
$15,985
State:
$20,913
Here:
21.2% of AGI
State:
18.2% of AGI
(% of AGI for various income ranges: 10.6% for AGIs $25k-50k, 8.4% for AGIs $50k-75k, 8.1% for AGIs $75k-100k, 8.7% for AGIs $100k-200k)
Charity contributions: $3,838 (reported on 13.4% of returns)
Here:
$3,838
State:
$4,697
(% of AGI for various income ranges: 0.7% for AGIs $25k-50k, 1.2% for AGIs $50k-75k, 1.8% for AGIs $75k-100k, 1.9% for AGIs $100k-200k)
Taxes paid: $5,221 (reported on 19.6% of returns)
46779:
$5,221
State:
$7,456
(% of AGI for various income ranges: 1.9% for AGIs $25k-50k, 2.5% for AGIs $50k-75k, 2.7% for AGIs $75k-100k, 4.0% for AGIs $100k-200k)
Earned income credit: $2,181 (reported on 16.5% of returns)
Here:
$2,181
State:
$2,265
(% of AGI for various income ranges: 4.6% for AGIs below $25k, 1.2% for AGIs $25k-50k)
Percentage of individuals using paid preparers for their 2012 taxes: 61.9%
Here:
62%
State:
53%
(% for various income ranges: 54.8% for AGIs below $25k, 60.0% for AGIs $25k-50k, 73.3% for AGIs $50k-75k, 66.7% for AGIs $75k-100k, 83.3% for AGIs $100k-200k)
Averages for the 2004 tax year for zip code 46779, filed in 2005:
Average Adjusted Gross Income (AGI) in 2004: $38,629 (Individual Income Tax Returns)
Here:
$38,629
State:
$44,790
Salary/wage: $34,210 (reported on 86.8% of returns)
Here:
$34,210
State:
$39,615
(% of AGI for various income ranges: 105.8% for AGIs below $10k, 70.2% for AGIs $10k-25k, 83.3% for AGIs $25k-50k, 87.0% for AGIs $50k-75k, 81.5% for AGIs $75k-100k, 42.4% for AGIs over 100k)
Taxable interest for individuals: $980 (reported on 45.3% of returns)
This zip code:
$980
Indiana:
$1,535
(% of AGI for various income ranges: 7.0% for AGIs below $10k, 3.8% for AGIs $10k-25k, 1.5% for AGIs $25k-50k, 0.4% for AGIs $50k-75k, 0.5% for AGIs $75k-100k, 0.3% for AGIs over 100k)
Taxable dividends: $1,198 (reported on 17.2% of returns)
Here:
$1,198
State:
$2,998
(% of AGI for various income ranges: 1.3% for AGIs below $10k, 0.8% for AGIs $10k-25k, 0.3% for AGIs $25k-50k, 0.4% for AGIs $50k-75k, 0.2% for AGIs $75k-100k, 1.2% for AGIs over 100k)
Net capital gain/loss: +$3,117 (reported on 15.9% of returns)
Here:
+$3,117
State:
+$8,619
(% of AGI for various income ranges: -0.9% for AGIs below $10k, 0.6% for AGIs $10k-25k, 1.6% for AGIs $25k-50k, 1.3% for AGIs $50k-75k, 0.9% for AGIs $75k-100k, 1.8% for AGIs over 100k)
Profit/loss from business: +$3,504 (reported on 12.3% of returns)
Here:
+$3,504
State:
+$10,071
(% of AGI for various income ranges: 0.6% for AGIs below $10k, 2.9% for AGIs $10k-25k, 2.3% for AGIs $25k-50k, 0.2% for AGIs $50k-75k, 0.7% for AGIs $75k-100k)
IRA payment deduction: $2,633 (reported on 3.1% of returns)
46779:
$2,633
Indiana:
$2,840
Total itemized deductions: $14,207 (21% of AGI, reported on 27.4% of returns)
Here:
$14,207
State:
$17,065
Here:
21.0% of AGI
State:
19.5% of AGI
(% of AGI for various income ranges: 7.9% for AGIs $10k-25k, 8.3% for AGIs $25k-50k, 11.0% for AGIs $50k-75k, 10.8% for AGIs $75k-100k, 13.5% for AGIs over 100k)
Charity contributions deductions: $3,005 (4% of AGI, reported on 21.5% of returns)
Here:
$3,005
State:
$3,550
Here:
4.2% of AGI
State:
3.8% of AGI
(% of AGI for various income ranges: 0.8% for AGIs $10k-25k, 1.3% for AGIs $25k-50k, 1.8% for AGIs $50k-75k, 1.7% for AGIs $75k-100k, 2.8% for AGIs over 100k)
Total tax: $4,092 (reported on 77.4% of returns)
46779:
$4,092
State:
$6,914
(% of AGI for various income ranges: 3.0% for AGIs below $10k, 4.2% for AGIs $10k-25k, 6.6% for AGIs $25k-50k, 8.2% for AGIs $50k-75k, 10.2% for AGIs $75k-100k, 12.3% for AGIs over 100k)
Earned income credit: $1,441 (reported on 10.5% of returns)
Here:
$1,441
State:
$1,685
Percentage of individuals using paid preparers for their 2004 taxes: 63.9%
Here:
64%
State:
59%
(% for various income ranges: 51.0% for AGIs below $10k, 64.9% for AGIs $10k-25k, 66.7% for AGIs $25k-50k, 69.8% for AGIs $50k-75k, 61.4% for AGIs $75k-100k, 83.3% for AGIs over 100k)
Household received Food Stamps/SNAP in the past 12 months: 9 Household did not receive Food Stamps/SNAP in the past 12 months: 895
Women who had a birth in the past 12 months: 12 (13 now married, 0 unmarried) Women who did not have a birth in the past 12 months: 396 (288 now married, 110 unmarried)
Housing units in zip code 46779 with a mortgage: 562 (116 second mortgage, 28 both second mortgage and home equity loan) Median monthly owner costs for units with a mortgage: $1,215 Median monthly owner costs for units without a mortgage: $388
Residents with income below the poverty level in 2022:
This zip code:
3.9%
Whole state:
12.6%
Residents with income below 50% of the poverty level in 2022:
This zip code:
1.2%
Whole state:
6.3%
Median number of rooms in houses and condos:
Here:
6.4
State:
6.6
Median number of rooms in apartments:
Here:
6.6
State:
4.3
Notable locations in this zip code not listed on our city pages
Churches in zip code 46779 include: Mount Zion United Methodist Church (A), Mount Zion Church (B), West Trinity Church (C). Display/hide their locations on the map
Cemeteries: Hollister Cemetery (1), Pleasant Lake Cemetery (2), Mount Zion Cemetery (3), Trinity Cemetery (4), Carter Cemetery (5), Matson Cemetery (6). Display/hide their locations on the map
Lakes and reservoirs: Mink Lake (A), Meserve Lake (B), Long Lake (C), Reed Lakes (D), Little Bower Lake (E), Golden Lake (F), Black Lake (G), Tamarack Lake (H). Display/hide their locations on the map
Size of family households: 371 2-persons, 154 3-persons, 104 4-persons, 69 5-persons, 12 6-persons
Size of nonfamily households: 166 1-person, 28 2-persons
462 married couples with children.
48 single-parent households (26 men, 22 women).
99.1% of residents of 46779 zip code speak English at home.
Foreign born population: 0 (0.0%)
:
0.0%
Whole state:
6.1%
42%German
17%American
12%English
7%Italian
6%French
5%Irish
5%Russian
Housing units lacking complete plumbing facilities: 1.5% Housing units lacking complete kitchen facilities: 1.6%
38.9%Utility gas
34.4%Bottled, tank, or LP gas
13.2%Electricity
9.0%Wood
4.8%Fuel oil, kerosene, etc.
Population in 1990: 1,625. Population change in the 1990s: +566 (+34.8%).
Place of birth for U.S.-born residents:
This state: 1,613
Northeast: 276
Midwest: 450
South: 44
West: 16
58% of the 46779 zip code residents lived in the same house 5 years ago. Out of people who lived in different houses, 58% lived in this county. Out of people who lived in different counties, 50% lived in Indiana.
97% of the 46779 zip code residents lived in the same house 1 year ago. Out of people who lived in different houses, 110% moved from this county.
Private vs. public school enrollment:
Students in private schools in grades 1 to 8 (elementary and middle school): 42
Here:
26.8%
Indiana:
14.9%
Students in private schools in grades 9 to 12 (high school):
Here:
0.0%
Indiana:
11.4%
Students in private undergraduate colleges: 32
Here:
81.4%
Indiana:
22.3%
Occupation by median earnings in the past 12 months ($)
79,606Construction and extraction occupations
63,185Management occupations
53,140Installation, maintenance, and repair occupations
52,853Education, training, and library occupations
46,874Production occupations
43,631Office and administrative support occupations
Top industries in this zip code by the number of employees in 2005:
Construction: New Single-Family Housing Construction (except Operative Builders) (5-9 employees: 1 establishment, 1-4 employees: 2 establishments)
Other Services (except Public Administration): Religious Organizations (5-9: 1, 1-4: 2)
Mining: Construction Sand and Gravel Mining (5-9: 1)
Real Estate and Rental and Leasing: Offices of Real Estate Agents and Brokers (1-4: 2)
Other Services (except Public Administration): Commercial and Industrial Machinery and Equipment (except Automotive and Electronic) Repair and Maintenance (1-4: 1)
Construction: Commercial and Institutional Building Construction (1-4: 1)
Other Services (except Public Administration): Beauty Salons (1-4: 1)
Fatal accident statistics in 2013:
Fatal accident count: 1
Vehicles involved in fatal accidents: 1
Fatal accidents caused by drunken drivers: 0
Fatalities: 1
Persons involved in fatal accidents: 1
Pedestrians involved in fatal accidents: 0
Fatal accident statistics in 2012:
Fatal accident count: 1
Vehicles involved in fatal accidents: 1
Fatal accidents caused by drunken drivers: 1
Fatalities: 1
Persons involved in fatal accidents: 1
Pedestrians involved in fatal accidents: 0
2003 - 2018 National Fire Incident Reporting System (NFIRS) incidents
Based on the data from the years 2003 - 2018 the average number of fire incidents per year is 16. The highest number of reported fires - 26 took place in 2015, and the least - 1 in 2014. The data has a dropping trend.
When looking into fire subcategories, the most incidents belonged to: Outside Fires (46.1%), and Structure Fires (41.3%).
Fire incident types reported to NFIRS in Zip Code 46779


 Nearest zip codes: 46705, 46703, 46747, 46793, 46742, 46730.


 Based on the data from the years 2003 - 2018 the average number of fire incidents per year is 16. The highest number of reported fires - 26 took place in 2015, and the least - 1 in 2014. The data has a dropping trend.
 When looking into fire subcategories, the most incidents belonged to: Outside Fires (46.1%), and Structure Fires (41.3%).