Estimated zip code population in 2022: 1,469 Zip code population in 2010: 1,708 Zip code population in 2000: 1,833
Houses and condos: 645 Renter-occupied apartments: 46
% of renters here:
9%
State:
29%
March 2022 cost of living index in zip code 46926: 84.2 (less than average, U.S. average is 100)
Land area: 35.2 sq. mi. Water area: 0.2 sq. mi.
Population density: 42 people per square mile
(very low).
OSM Map
General Map
Google Map
MSN Map
OSM Map
General Map
Google Map
MSN Map
OSM Map
General Map
Google Map
MSN Map
OSM Map
General Map
Google Map
MSN Map
Please wait while loading the map...
Real estate property taxes paid for housing units in 2022:
This zip code:
0.4% ($500)
Indiana:
0.7% ($1,467)
Median real estate property taxes paid for housing units with mortgages in 2022: $497 (0.3%) Median real estate property taxes paid for housing units with no mortgage in 2022: $513 (0.5%)
Business Search- 14 Million verified businesses
Males: 775
(52.8%)
Females: 693
(47.2%)
For population 25 years and over in 46926:
High school or higher: 89.7%
Bachelor's degree or higher: 13.9%
Graduate or professional degree: 1.2%
Unemployed: 1.7%
Mean travel time to work (commute): 27.7 minutes
For population 15 years and over in 46926:
Never married: 19.8%
Now married: 58.6%
Separated: 1.0%
Widowed: 6.1%
Divorced: 14.4%
Zip code 46926 compared to state average:
Median house value below state average.
Unemployed percentage below state average.
Black race population percentage significantly below state average.
Hispanic race population percentage significantly below state average.
Median age above state average.
Foreign-born population percentage significantly below state average.
Renting percentage significantly below state average.
Length of stay since moving in significantly above state average.
House age above state average.
Percentage of population with a bachelor's degree or higher below state average.
Estimated median house/condo value in 2022: $137,201
46926:
$137,201
Indiana:
$208,700
Median resident age:
This zip code:
43.5 years
Indiana median age:
38.2 years
Average household size:
This zip code:
2.8 people
Indiana:
2.4 people
Averages for the 2020 tax year for zip code 46926, filed in 2021:
Average Adjusted Gross Income (AGI) in 2020: $52,670 (Individual Income Tax Returns)
Here:
$52,670
State:
$64,978
Salary/wage: $49,492 (reported on 77.2% of returns)
Here:
$49,492
State:
$55,245
(% of AGI for various income ranges: 1028.2% for AGIs below $25k, 3242.9% for AGIs $25k-50k, 6306.4% for AGIs $50k-75k, 8400.0% for AGIs $75k-100k, 14635.7% for AGIs $100k-200k)
Taxable interest for individuals: $433 (reported on 34.2% of returns)
This zip code:
$433
Indiana:
$1,351
(% of AGI for various income ranges: 9.4% for AGIs below $25k, 12.1% for AGIs $25k-50k, 35.5% for AGIs $50k-75k, 15.0% for AGIs $75k-100k, 47.1% for AGIs $100k-200k)
Ordinary dividends: $2,931 (reported on 16.5% of returns)
Here:
$2,931
State:
$5,827
(% of AGI for various income ranges: 25.9% for AGIs below $25k, 34.3% for AGIs $25k-50k, 65.5% for AGIs $50k-75k, 310.0% for AGIs $100k-200k)
Net capital gain/loss in AGI: +$4,600 (reported on 16.5% of returns)
Here:
+$4,600
State:
+$17,730
(% of AGI for various income ranges: 4.7% for AGIs below $25k, 0.7% for AGIs $25k-50k, 73.6% for AGIs $50k-75k, 725.7% for AGIs $100k-200k)
Profit/loss from business: +$7,800 (reported on 11.4% of returns)
Here:
+$7,800
State:
+$12,144
(% of AGI for various income ranges: 130.6% for AGIs below $25k, 80.0% for AGIs $25k-50k, 460.0% for AGIs $75k-100k)
Taxable individual retirement arrangement distribution: $10,900 (reported on 11.4% of returns)
46926:
$10,900
Indiana:
$18,302
(% of AGI for various income ranges: 52.4% for AGIs below $25k, 316.4% for AGIs $25k-50k, 561.2% for AGIs $75k-100k)
Earned income credit: $1,991 (reported on 13.9% of returns)
Here:
$1,991
State:
$2,298
(% of AGI for various income ranges: 60.0% for AGIs below $25k, 83.6% for AGIs $25k-50k)
Percentage of individuals using paid preparers for their 2020 taxes: 94.9%
Here:
95%
State:
94%
(% for various income ranges: 96.2% for AGIs below $25k, 94.4% for AGIs $25k-50k, 100.0% for AGIs $50k-75k, 90.0% for AGIs $75k-100k, 90.9% for AGIs $100k-200k)
Averages for the 2012 tax year for zip code 46926, filed in 2013:
Average Adjusted Gross Income (AGI) in 2012: $42,894 (Individual Income Tax Returns)
Here:
$42,894
State:
$52,932
Salary/wage: $40,748 (reported on 80.8% of returns)
Here:
$40,748
State:
$45,173
(% of AGI for various income ranges: 63.3% for AGIs below $25k, 71.8% for AGIs $25k-50k, 82.3% for AGIs $50k-75k, 85.2% for AGIs $75k-100k, 72.0% for AGIs $100k-200k)
Taxable interest for individuals: $611 (reported on 34.6% of returns)
This zip code:
$611
Indiana:
$1,311
(% of AGI for various income ranges: 1.1% for AGIs below $25k, 0.8% for AGIs $25k-50k, 0.2% for AGIs $50k-75k, 0.4% for AGIs $75k-100k, 0.3% for AGIs $100k-200k)
Ordinary dividends: $1,733 (reported on 15.4% of returns)
Here:
$1,733
State:
$4,690
(% of AGI for various income ranges: 2.0% for AGIs below $25k, 0.5% for AGIs $25k-50k, 1.2% for AGIs $75k-100k)
Profit/loss from business: +$3,142 (reported on 15.4% of returns)
Here:
+$3,142
State:
+$11,105
(% of AGI for various income ranges: 6.2% for AGIs below $25k, 1.6% for AGIs $25k-50k, 0.7% for AGIs $75k-100k)
Taxable individual retirement arrangement distribution: $8,889 (reported on 11.5% of returns)
46926:
$8,889
Indiana:
$13,841
(% of AGI for various income ranges: 4.2% for AGIs below $25k, 1.5% for AGIs $25k-50k, 6.7% for AGIs $50k-75k)
Total itemized deductions: $16,833 (22% of AGI, reported on 19.2% of returns)
Here:
$16,833
State:
$20,913
Here:
22.3% of AGI
State:
18.2% of AGI
(% of AGI for various income ranges: 8.1% for AGIs $25k-50k, 7.6% for AGIs $50k-75k, 8.8% for AGIs $75k-100k, 9.0% for AGIs $100k-200k)
Charity contributions: $3,389 (reported on 11.5% of returns)
Here:
$3,389
State:
$4,697
(% of AGI for various income ranges: 2.0% for AGIs below $25k, 0.7% for AGIs $50k-75k, 1.2% for AGIs $75k-100k, 1.5% for AGIs $100k-200k)
Taxes paid: $5,113 (reported on 19.2% of returns)
46926:
$5,113
State:
$7,456
(% of AGI for various income ranges: 1.3% for AGIs $25k-50k, 1.9% for AGIs $50k-75k, 3.2% for AGIs $75k-100k, 4.0% for AGIs $100k-200k)
Earned income credit: $1,931 (reported on 16.7% of returns)
Here:
$1,931
State:
$2,265
(% of AGI for various income ranges: 4.7% for AGIs below $25k, 1.3% for AGIs $25k-50k)
Percentage of individuals using paid preparers for their 2012 taxes: 73.1%
Here:
73%
State:
53%
(% for various income ranges: 69.0% for AGIs below $25k, 72.7% for AGIs $25k-50k, 69.2% for AGIs $50k-75k, 88.9% for AGIs $75k-100k, 80.0% for AGIs $100k-200k)
Averages for the 2004 tax year for zip code 46926, filed in 2005:
Average Adjusted Gross Income (AGI) in 2004: $37,900 (Individual Income Tax Returns)
Here:
$37,900
State:
$44,790
Salary/wage: $35,908 (reported on 86.7% of returns)
Here:
$35,908
State:
$39,615
(% of AGI for various income ranges: 92.9% for AGIs below $10k, 71.2% for AGIs $10k-25k, 82.0% for AGIs $25k-50k, 87.8% for AGIs $50k-75k, 86.6% for AGIs $75k-100k, 71.9% for AGIs over 100k)
Taxable interest for individuals: $756 (reported on 45.1% of returns)
This zip code:
$756
Indiana:
$1,535
(% of AGI for various income ranges: 8.4% for AGIs below $10k, 1.8% for AGIs $10k-25k, 1.3% for AGIs $25k-50k, 0.3% for AGIs $50k-75k, 0.3% for AGIs $75k-100k, 0.4% for AGIs over 100k)
Taxable dividends: $910 (reported on 18.6% of returns)
Here:
$910
State:
$2,998
(% of AGI for various income ranges: 3.9% for AGIs below $10k, 0.5% for AGIs $10k-25k, 0.5% for AGIs $25k-50k, 0.3% for AGIs $50k-75k, 0.2% for AGIs $75k-100k, 0.6% for AGIs over 100k)
Net capital gain/loss: +$3,621 (reported on 12.2% of returns)
Here:
+$3,621
State:
+$8,619
(% of AGI for various income ranges: -4.7% for AGIs below $10k, 0.3% for AGIs $10k-25k, 0.8% for AGIs $25k-50k, 1.2% for AGIs $50k-75k, 0.3% for AGIs $75k-100k, 4.2% for AGIs over 100k)
Profit/loss from business: +$4,469 (reported on 14.5% of returns)
Here:
+$4,469
State:
+$10,071
(% of AGI for various income ranges: 11.0% for AGIs below $10k, 5.2% for AGIs $10k-25k, 0.9% for AGIs $25k-50k, 1.3% for AGIs $50k-75k, 2.5% for AGIs $75k-100k)
IRA payment deduction: $2,333 (reported on 1.5% of returns)
46926:
$2,333
Indiana:
$2,840
Total itemized deductions: $14,170 (22% of AGI, reported on 21.2% of returns)
Here:
$14,170
State:
$17,065
Here:
22.2% of AGI
State:
19.5% of AGI
(% of AGI for various income ranges: 5.7% for AGIs $10k-25k, 7.5% for AGIs $25k-50k, 7.4% for AGIs $50k-75k, 9.9% for AGIs $75k-100k, 10.1% for AGIs over 100k)
Charity contributions deductions: $2,469 (4% of AGI, reported on 16.4% of returns)
Here:
$2,469
State:
$3,550
Here:
3.7% of AGI
State:
3.8% of AGI
(% of AGI for various income ranges: 2.8% for AGIs below $10k, 0.9% for AGIs $25k-50k, 1.1% for AGIs $50k-75k, 1.2% for AGIs $75k-100k, 1.8% for AGIs over 100k)
Total tax: $4,236 (reported on 74.9% of returns)
46926:
$4,236
State:
$6,914
(% of AGI for various income ranges: 3.0% for AGIs below $10k, 3.6% for AGIs $10k-25k, 6.3% for AGIs $25k-50k, 8.1% for AGIs $50k-75k, 10.4% for AGIs $75k-100k, 15.3% for AGIs over 100k)
Earned income credit: $1,815 (reported on 11.8% of returns)
Here:
$1,815
State:
$1,685
Percentage of individuals using paid preparers for their 2004 taxes: 73.1%
Here:
73%
State:
59%
(% for various income ranges: 66.2% for AGIs below $10k, 75.1% for AGIs $10k-25k, 74.4% for AGIs $25k-50k, 72.5% for AGIs $50k-75k, 70.4% for AGIs $75k-100k, 90.3% for AGIs over 100k)
Likely homosexual households (counted as self-reported same-sex unmarried-partner households)
Lesbian couples: 1.8% of all households
Gay men: 0.0% of all households
Household received Food Stamps/SNAP in the past 12 months: 45 Household did not receive Food Stamps/SNAP in the past 12 months: 483
Women who had a birth in the past 12 months: 8 (8 now married, 0 unmarried) Women who did not have a birth in the past 12 months: 314 (168 now married, 145 unmarried)
Housing units in zip code 46926 with a mortgage: 293 (32 second mortgage, 10 home equity loan, 24 both second mortgage and home equity loan) Houses without a mortgage: 3
Median monthly owner costs for units with a mortgage: $1,007 Median monthly owner costs for units without a mortgage: $391
Residents with income below the poverty level in 2022:
This zip code:
5.4%
Whole state:
12.6%
Residents with income below 50% of the poverty level in 2022:
This zip code:
2.0%
Whole state:
6.3%
Median number of rooms in houses and condos:
Here:
6.8
State:
6.6
Median number of rooms in apartments:
Here:
5.3
State:
4.3
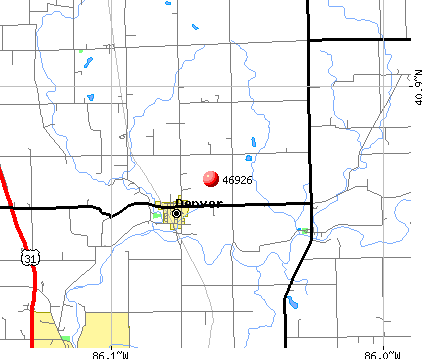
Notable locations in this zip code not listed on our city pages
Cemeteries: Mount Zion Cemetery (1), Westlawn Cemetery (2), Musselman Cemetery (3), Yike Cemetery (4), Macedonia Cemetery (5). Display/hide their locations on the map
Size of family households: 176 2-persons, 129 3-persons, 71 4-persons, 32 5-persons, 11 6-persons, 6 7-or-more-persons
Size of nonfamily households: 90 1-person, 1 2-persons, 8 3-persons
209 married couples with children.
70 single-parent households (17 men, 53 women).
93.8% of residents of 46926 zip code speak English at home.
5.3% of residents speak Spanish at home (100% very well).
0.1% of residents speak other Indo-European language at home (100% very well).
Foreign born population: 0 (0.0%)
:
0.0%
Whole state:
6.1%
34%German
19%English
16%American
11%Irish
4%European
2%Polish
1%Scotch-Irish
Year of entry for the foreign-born population
02010 or later
02000 to 2009
01990 to 1999
15Before 1990
Facilities with environmental interests located in this zip code:
NORTH MIAMI COMMUNITY SCHOOLS (CR 900 N & MERIDIAN in DENVER, IN)
STATE MASTER (Indiana facility tracking) - UST-6334, UNDERGROUND STORAGE TANK PROGRAM, IN-NPDES-IN0031208, National Pollutant Discharge Elimination System Permit COMPLIANCE ACTIVITY (Tracking inspections of insecticide, fungicide, and rodenticide, and toxic substances) National Pollutant Discharge Elimination System NON-MAJOR (Tracking pollutant discharge elimination systems) - permit Business SIC classification: ELEMENTARY AND SECONDARY SCHOOLS Organizations: WESLEY HAWKINS 14704 090102 (CONTACT/OPERATOR)
Alternative names: NORTH MIAMI ELEM & HIGH SCHOOL, NORTH MIAMI ELEMENTARY SCHOOL
DENVER MUNICIPAL WWTP (383 W LITTLE ST in DENVER, IN)
STATE MASTER (Indiana facility tracking) - CRTK-973, EPCRA National Pollutant Discharge Elimination System NON-MAJOR (Tracking pollutant discharge elimination systems) - permit Business SIC classification: SEWERAGE SYSTEMS Organizations: BRUCE MURPHY CERT OP 15466 (CONTACT/OPERATOR)
, DENVER TOWN COUNCIL (CONTACT/OWNER)
Alternative names: DENVER MUNICIPAL STP, DENVER WWTP, TOWN OF
NORTH MIAMI ELEM SCHOOL (632 E 900 N in DENVER, IN)
(National Center for Education Statistics) - STATE ID-6051 Organizations: NORTH MIAMI COMMUNITY SCHOOLS (SCHOOL DISTRICT)
NORTH MIAMI MIDDLE/HIGH SCHOOL (570 E 900 N in DENVER, IN)
(National Center for Education Statistics) - STATE ID-6049 Organizations: NORTH MIAMI COMMUNITY SCHOOLS (SCHOOL DISTRICT)
DELTA TUBE INC (US 31 N in DENVER, IN)
STATE MASTER (Indiana facility tracking) (Resource Conservation and Recovery Act (tracking hazardous waste)) Organizations: HILL BOB SR (CONTACT/OWNER)
LIPPERT COMPONENTS, INC. (7761 N. OLD RTE. 31 in DENVER, IN)
AIR SYNTHETIC MINOR (AIRS/AFS) STATE MASTER (Indiana facility tracking) CRITERIA AND HAZARDOUS AIR POLLUTANT INVENTORY (Inventory of air pollution sources) TRI REPORTER (Tracking of toxic chemicals releasing facilities) Business SIC classification: TRAVEL TRAILERS AND CAMPERS
Housing units lacking complete plumbing facilities: 1.2% Housing units lacking complete kitchen facilities: 5.9%
41.0%Utility gas
29.9%Electricity
18.2%Bottled, tank, or LP gas
6.8%Wood
3.1%Fuel oil, kerosene, etc.
1.6%Other fuel
Population in 1990: 5,339.
Place of birth for U.S.-born residents:
This state: 1,167
Northeast: 10
Midwest: 128
South: 88
West: 49
67% of the 46926 zip code residents lived in the same house 5 years ago. Out of people who lived in different houses, 67% lived in this county. Out of people who lived in different counties, 50% lived in Indiana.
97% of the 46926 zip code residents lived in the same house 1 year ago. Out of people who lived in different houses, 34% moved from this county. Out of people who lived in different houses, 60% moved from different county within same state. Out of people who lived in different houses, 20% moved from different state.
Private vs. public school enrollment:
Students in private schools in grades 1 to 8 (elementary and middle school): 23
Here:
22.6%
Indiana:
14.9%
Students in private schools in grades 9 to 12 (high school):
Here:
0.0%
Indiana:
11.4%
Students in private undergraduate colleges: 16
Here:
14.8%
Indiana:
22.3%
Occupation by median earnings in the past 12 months ($)
78,395Installation, maintenance, and repair occupations
73,431Management occupations
50,198Health diagnosing and treating practitioners and other technical occupations
48,732Education, training, and library occupations
46,052Material moving occupations
44,733Production occupations
Top industries in this zip code by the number of employees in 2005:
Construction: Land Subdivision (20-49 employees: 1 establishment)
Other Services (except Public Administration): Pet Care (except Veterinary) Services (10-19: 1)
Accommodation and Food Services: Full-Service Restaurants (10-19: 1)
Other Services (except Public Administration): General Automotive Repair (5-9: 1, 1-4: 2)
Health Care and Social Assistance: Offices of Dentists (5-9: 1)
Other Services (except Public Administration): Religious Organizations (5-9: 1)
Construction: Residential Remodelers (1-4: 2)
2002 - 2018 National Fire Incident Reporting System (NFIRS) incidents
Based on the data from the years 2002 - 2018 the average number of fires per year is 8. The highest number of reported fire incidents - 20 took place in 2007, and the least - 0 in 2014. The data has a decreasing trend.
When looking into fire subcategories, the most reports belonged to: Outside Fires (43.1%), and Structure Fires (34.0%).
Fire incident types reported to NFIRS in Zip Code 46926

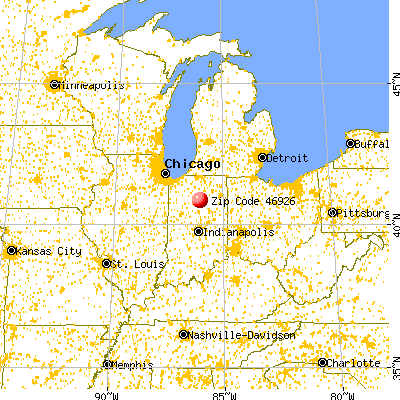


 Nearest zip codes: 46951, 46958, 46970, 46974, 46910, 46988.


 Based on the data from the years 2002 - 2018 the average number of fires per year is 8. The highest number of reported fire incidents - 20 took place in 2007, and the least - 0 in 2014. The data has a decreasing trend.
 When looking into fire subcategories, the most reports belonged to: Outside Fires (43.1%), and Structure Fires (34.0%).