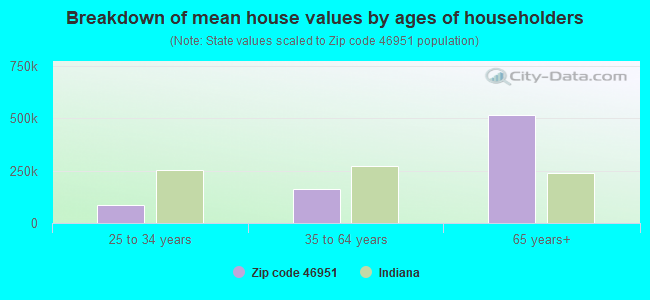
Estimated median house/condo value in 2022: $151,523
46951:
$151,523
Indiana:
$208,700
According to our research of Indiana and other state lists, there was 1 registered sex offender living in 46951 zip code as of May 28, 2024. The ratio of all residents to sex offenders in zip code 46951 is 1,937 to 1. The ratio of registered sex offenders to all residents in this zip code is much lower than the state average.
Median resident age:
This zip code:
38.3 years
Indiana median age:
38.2 years
Average household size:
This zip code:
3.0 people
Indiana:
2.4 people
Averages for the 2020 tax year for zip code 46951, filed in 2021:
Average Adjusted Gross Income (AGI) in 2020: $50,979 (Individual Income Tax Returns)
Here:
$50,979
State:
$64,978
Salary/wage: $46,968 (reported on 75.3% of returns)
Here:
$46,968
State:
$55,245
(% of AGI for various income ranges: 1157.6% for AGIs below $25k, 3455.3% for AGIs $25k-50k, 6404.5% for AGIs $50k-75k, 9860.0% for AGIs $75k-100k, 15784.3% for AGIs $100k-200k)
Taxable interest for individuals: $730 (reported on 34.0% of returns)
This zip code:
$730
Indiana:
$1,351
(% of AGI for various income ranges: 25.2% for AGIs below $25k, 21.2% for AGIs $25k-50k, 36.4% for AGIs $50k-75k, 68.8% for AGIs $75k-100k, 81.4% for AGIs $100k-200k)
Ordinary dividends: $1,933 (reported on 15.5% of returns)
Here:
$1,933
State:
$5,827
(% of AGI for various income ranges: 8.1% for AGIs below $25k, 22.4% for AGIs $25k-50k, 60.9% for AGIs $50k-75k, 120.0% for AGIs $75k-100k, 102.9% for AGIs $100k-200k)
Net capital gain/loss in AGI: +$5,900 (reported on 14.4% of returns)
Here:
+$5,900
State:
+$17,730
(% of AGI for various income ranges: 8.6% for AGIs below $25k, 6.5% for AGIs $25k-50k, 60.9% for AGIs $50k-75k, 185.0% for AGIs $75k-100k, 831.4% for AGIs $100k-200k)
Profit/loss from business: +$8,615 (reported on 13.4% of returns)
Here:
+$8,615
State:
+$12,144
(% of AGI for various income ranges: 134.3% for AGIs below $25k, 192.9% for AGIs $25k-50k, 303.6% for AGIs $50k-75k, 220.0% for AGIs $75k-100k)
Taxable individual retirement arrangement distribution: $13,800 (reported on 10.3% of returns)
46951:
$13,800
Indiana:
$18,302
(% of AGI for various income ranges: 40.5% for AGIs below $25k, 262.9% for AGIs $25k-50k, 1060.0% for AGIs $75k-100k)
Earned income credit: $2,114 (reported on 14.4% of returns)
Here:
$2,114
State:
$2,298
(% of AGI for various income ranges: 81.9% for AGIs below $25k, 72.9% for AGIs $25k-50k)
Percentage of individuals using paid preparers for their 2020 taxes: 93.8%
Here:
94%
State:
94%
(% for various income ranges: 93.9% for AGIs below $25k, 95.8% for AGIs $25k-50k, 93.8% for AGIs $50k-75k, 91.7% for AGIs $75k-100k, 91.7% for AGIs $100k-200k)
Averages for the 2012 tax year for zip code 46951, filed in 2013:
Average Adjusted Gross Income (AGI) in 2012: $41,274 (Individual Income Tax Returns)
Here:
$41,274
State:
$52,932
Salary/wage: $35,733 (reported on 82.3% of returns)
Here:
$35,733
State:
$45,173
(% of AGI for various income ranges: 69.2% for AGIs below $25k, 74.8% for AGIs $25k-50k, 79.1% for AGIs $50k-75k, 76.0% for AGIs $75k-100k, 58.3% for AGIs $100k-200k)
Taxable interest for individuals: $617 (reported on 36.5% of returns)
This zip code:
$617
Indiana:
$1,311
(% of AGI for various income ranges: 1.2% for AGIs below $25k, 0.5% for AGIs $25k-50k, 0.2% for AGIs $50k-75k, 0.4% for AGIs $75k-100k, 0.6% for AGIs $100k-200k)
Ordinary dividends: $1,236 (reported on 14.6% of returns)
Here:
$1,236
State:
$4,690
(% of AGI for various income ranges: 0.5% for AGIs below $25k, 0.9% for AGIs $25k-50k, 0.4% for AGIs $50k-75k, 0.3% for AGIs $100k-200k)
Net capital gain/loss in AGI: +$1,556 (reported on 9.4% of returns)
Here:
+$1,556
State:
+$10,406
Profit/loss from business: +$6,938 (reported on 16.7% of returns)
Here:
+$6,938
State:
+$11,105
(% of AGI for various income ranges: 8.1% for AGIs below $25k, 3.2% for AGIs $25k-50k, 0.3% for AGIs $50k-75k, 6.1% for AGIs $75k-100k)
Taxable individual retirement arrangement distribution: $7,011 (reported on 9.4% of returns)
46951:
$7,011
Indiana:
$13,841
(% of AGI for various income ranges: 1.6% for AGIs below $25k, 3.1% for AGIs $25k-50k, 4.0% for AGIs $75k-100k)
Total itemized deductions: $17,638 (24% of AGI, reported on 16.7% of returns)
Here:
$17,638
State:
$20,913
Here:
23.7% of AGI
State:
18.2% of AGI
(% of AGI for various income ranges: 8.0% for AGIs $25k-50k, 7.6% for AGIs $50k-75k, 6.8% for AGIs $75k-100k, 9.4% for AGIs $100k-200k)
Charity contributions: $5,110 (reported on 10.4% of returns)
Here:
$5,110
State:
$4,697
(% of AGI for various income ranges: 2.5% for AGIs below $25k, 2.2% for AGIs $50k-75k, 2.0% for AGIs $100k-200k)
Taxes paid: $5,112 (reported on 17.7% of returns)
46951:
$5,112
State:
$7,456
(% of AGI for various income ranges: 0.6% for AGIs below $25k, 1.0% for AGIs $25k-50k, 1.9% for AGIs $50k-75k, 2.6% for AGIs $75k-100k, 4.1% for AGIs $100k-200k)
Earned income credit: $2,025 (reported on 20.8% of returns)
Here:
$2,025
State:
$2,265
(% of AGI for various income ranges: 5.7% for AGIs below $25k, 1.5% for AGIs $25k-50k)
Percentage of individuals using paid preparers for their 2012 taxes: 70.8%
Here:
71%
State:
53%
(% for various income ranges: 66.7% for AGIs below $25k, 70.4% for AGIs $25k-50k, 73.3% for AGIs $50k-75k, 75.0% for AGIs $75k-100k, 85.7% for AGIs $100k-200k)
Averages for the 2004 tax year for zip code 46951, filed in 2005:
Average Adjusted Gross Income (AGI) in 2004: $34,193 (Individual Income Tax Returns)
Here:
$34,193
State:
$44,790
Salary/wage: $31,963 (reported on 86.2% of returns)
Here:
$31,963
State:
$39,615
(% of AGI for various income ranges: 82.4% for AGIs below $10k, 76.2% for AGIs $10k-25k, 80.0% for AGIs $25k-50k, 85.0% for AGIs $50k-75k, 77.9% for AGIs $75k-100k, 79.5% for AGIs over 100k)
Taxable interest for individuals: $633 (reported on 44.1% of returns)
This zip code:
$633
Indiana:
$1,535
(% of AGI for various income ranges: 6.0% for AGIs below $10k, 1.4% for AGIs $10k-25k, 0.7% for AGIs $25k-50k, 0.7% for AGIs $50k-75k, 0.5% for AGIs $75k-100k, 0.2% for AGIs over 100k)
Taxable dividends: $563 (reported on 15.7% of returns)
Here:
$563
State:
$2,998
(% of AGI for various income ranges: 0.3% for AGIs below $10k, 0.5% for AGIs $10k-25k, 0.3% for AGIs $25k-50k, 0.2% for AGIs $50k-75k, 0.1% for AGIs $75k-100k, 0.2% for AGIs over 100k)
Net capital gain/loss: +$2,163 (reported on 12.8% of returns)
Here:
+$2,163
State:
+$8,619
(% of AGI for various income ranges: 0.5% for AGIs below $10k, 0.4% for AGIs $10k-25k, 0.3% for AGIs $25k-50k, 0.8% for AGIs $50k-75k, 2.8% for AGIs $75k-100k)
Profit/loss from business: +$6,563 (reported on 15.0% of returns)
Here:
+$6,563
State:
+$10,071
(% of AGI for various income ranges: 3.4% for AGIs below $10k, 6.3% for AGIs $10k-25k, 3.0% for AGIs $25k-50k, 3.3% for AGIs $50k-75k, 1.0% for AGIs $75k-100k)
Profit/loss from farming: +$3,575 (reported on 11.2% of returns)
Here:
+$3,575
State:
-$2,212
(% of AGI for various income ranges: -4.8% for AGIs below $10k, -2.3% for AGIs $10k-25k, 1.7% for AGIs $25k-50k, 0.6% for AGIs $50k-75k, 5.5% for AGIs $75k-100k)
IRA payment deduction: $2,750 (reported on 2.0% of returns)
46951:
$2,750
Indiana:
$2,840
Total itemized deductions: $13,842 (24% of AGI, reported on 19.5% of returns)
Here:
$13,842
State:
$17,065
Here:
23.7% of AGI
State:
19.5% of AGI
(% of AGI for various income ranges: 8.5% for AGIs $10k-25k, 6.3% for AGIs $25k-50k, 8.1% for AGIs $50k-75k, 9.6% for AGIs $75k-100k, 9.9% for AGIs over 100k)
Charity contributions deductions: $2,804 (4% of AGI, reported on 15.2% of returns)
Here:
$2,804
State:
$3,550
Here:
4.5% of AGI
State:
3.8% of AGI
(% of AGI for various income ranges: 1.4% for AGIs $10k-25k, 0.7% for AGIs $25k-50k, 1.2% for AGIs $50k-75k, 1.7% for AGIs $75k-100k, 2.2% for AGIs over 100k)
Total tax: $3,772 (reported on 74.0% of returns)
46951:
$3,772
State:
$6,914
(% of AGI for various income ranges: 2.6% for AGIs below $10k, 3.9% for AGIs $10k-25k, 6.3% for AGIs $25k-50k, 8.9% for AGIs $50k-75k, 10.9% for AGIs $75k-100k, 13.3% for AGIs over 100k)
Earned income credit: $1,560 (reported on 16.5% of returns)
Here:
$1,560
State:
$1,685
Percentage of individuals using paid preparers for their 2004 taxes: 74.9%
Here:
75%
State:
59%
(% for various income ranges: 65.7% for AGIs below $10k, 75.4% for AGIs $10k-25k, 76.9% for AGIs $25k-50k, 80.1% for AGIs $50k-75k, 79.1% for AGIs $75k-100k, 78.1% for AGIs over 100k)
Household received Food Stamps/SNAP in the past 12 months: 40 Household did not receive Food Stamps/SNAP in the past 12 months: 685
Women who had a birth in the past 12 months: 8 (9 now married, 0 unmarried) Women who did not have a birth in the past 12 months: 418 (227 now married, 191 unmarried)
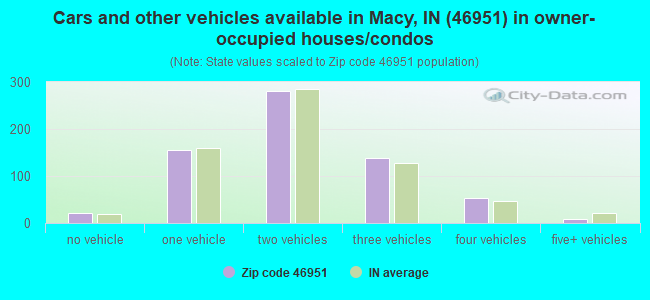
Housing units in zip code 46951 with a mortgage: 434 (35 second mortgage, 11 home equity loan, 16 both second mortgage and home equity loan) Houses without a mortgage: 1
Median monthly owner costs for units with a mortgage: $974 Median monthly owner costs for units without a mortgage: $438
Residents with income below the poverty level in 2022:
This zip code:
16.7%
Whole state:
12.6%
Residents with income below 50% of the poverty level in 2022:
This zip code:
2.4%
Whole state:
6.3%
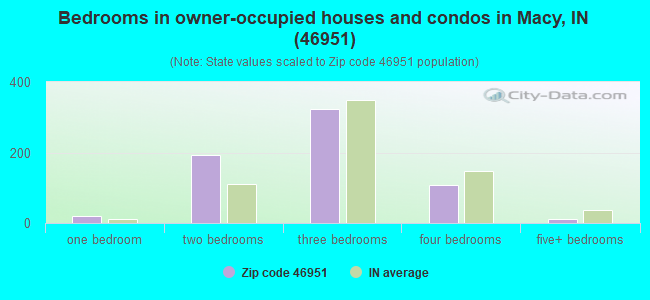
Median number of rooms in houses and condos:
Here:
6.2
State:
6.6
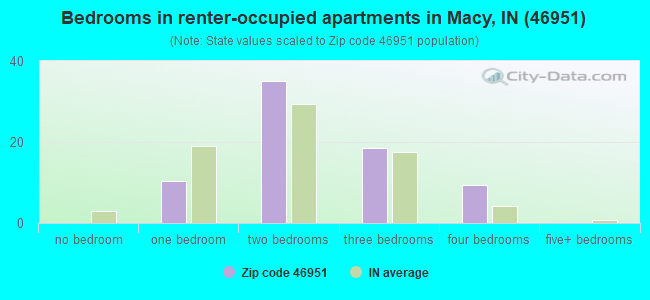
Median number of rooms in apartments:
Here:
5.3
State:
4.3
Notable locations in this zip code not listed on our city pages
Cemeteries: Gaerte Cemetery (1), Independent Order of Odd Fellows Cemetery (2), Shoemaker Cemetery (3), Tilden Cemetery (4), Plainview Cemetery (5), Five Corners Cemetery (6). Display/hide their locations on the map
Size of family households: 279 2-persons, 95 3-persons, 75 4-persons, 35 5-persons, 47 6-persons, 10 7-or-more-persons
Size of nonfamily households: 142 1-person, 42 2-persons
411 married couples with children.
82 single-parent households (15 men, 67 women).
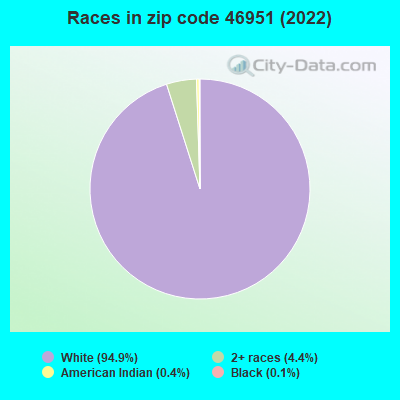
94.3% of residents of 46951 zip code speak English at home.
5.3% of residents speak other Indo-European language at home (89% very well, 10% well, 1% not at all).
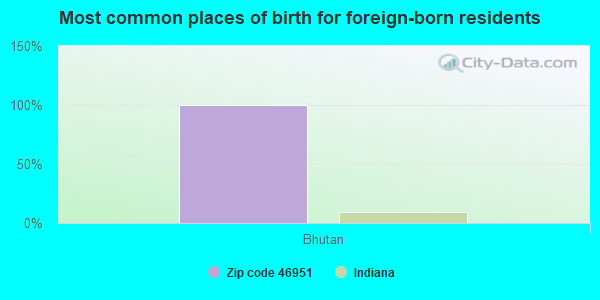
Foreign born population: 2 (0.1%) (100.0% of them are naturalized citizens)
This zip code:
0.1%
Whole state:
6.1%
100%Bhutan
30%German
20%English
10%American
9%Swiss
7%Irish
3%Italian
3%Scottish
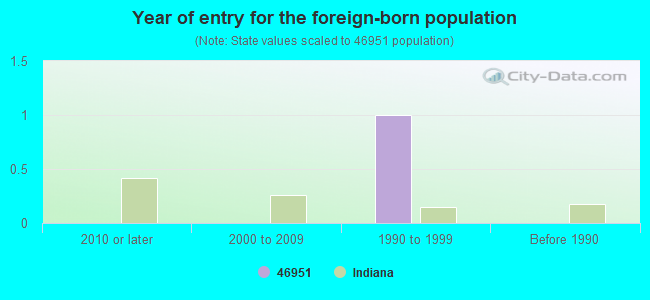
Year of entry for the foreign-born population
02010 or later
02000 to 2009
11990 to 1999
0Before 1990
Facilities with environmental interests located in this zip code:
CROPMATE CO UAP RICHTER (WALNUT ST & MAIN ST in MACY, IN)
STATE MASTER (Indiana facility tracking) - CRTK-673, EPCRA COMPLIANCE ACTIVITY (Tracking inspections of insecticide, fungicide, and rodenticide, and toxic substances) Alternative names: CROPMATE FERTILIZER CO
AMOCO FERTILIZER PLT (RAILROAD ST in MACY, IN)
STATE MASTER (Indiana facility tracking) (Resource Conservation and Recovery Act (tracking hazardous waste))
NYONA/SOUTH MUD LAKE C.D. (MACY QUAD: T29N R3E SEC15 SWQ in MACY, IN)
National Pollutant Discharge Elimination System NON-MAJOR (Tracking pollutant discharge elimination systems) - permit Business SIC classification: SEWERAGE SYSTEMS Organizations: (FACILITY NOT BUILT YET) (CONTACT/OPERATOR)
Housing units lacking complete plumbing facilities: 0.6% Housing units lacking complete kitchen facilities: 3.0%
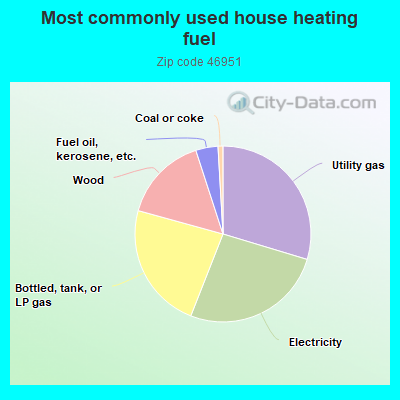
29.8%Utility gas
26.4%Electricity
23.4%Bottled, tank, or LP gas
15.8%Wood
4.1%Fuel oil, kerosene, etc.
0.9%Coal or coke
Population in 1990: 633. Population change in the 1990s: +1,649 (+260.5%).
Place of birth for U.S.-born residents:
This state: 1,747
Northeast: 17
Midwest: 275
South: 82
West: 22
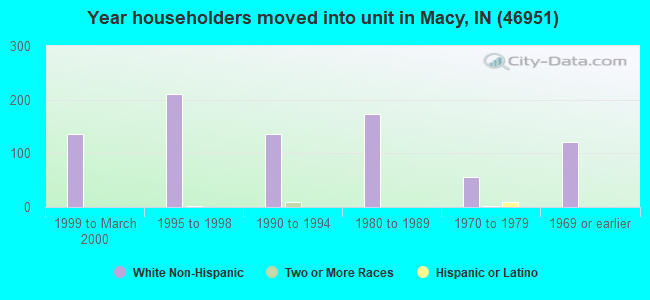
68% of the 46951 zip code residents lived in the same house 5 years ago. Out of people who lived in different houses, 51% lived in this county. Out of people who lived in different counties, 50% lived in Indiana.
98% of the 46951 zip code residents lived in the same house 1 year ago. Out of people who lived in different houses, 112% moved from this county. Out of people who lived in different houses, 12% moved from different county within same state.
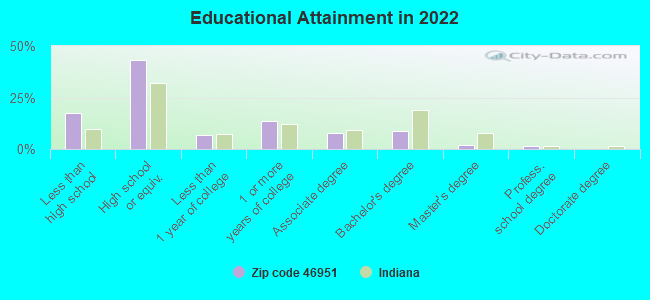
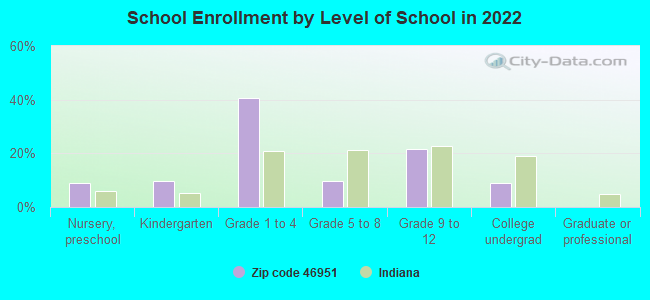
Private vs. public school enrollment:
Students in private schools in grades 1 to 8 (elementary and middle school): 24
Here:
11.7%
Indiana:
14.9%
Students in private schools in grades 9 to 12 (high school): 10
Here:
11.6%
Indiana:
11.4%
Students in private undergraduate colleges: 1
Here:
5.4%
Indiana:
22.3%
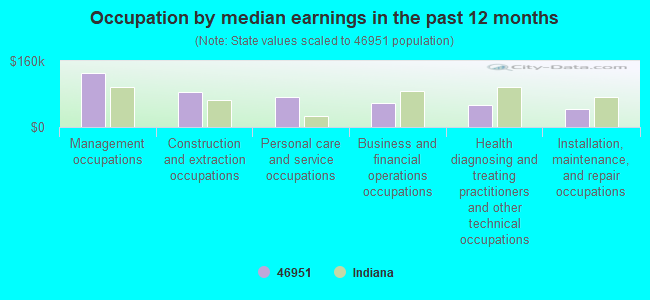
Occupation by median earnings in the past 12 months ($)
129,976Management occupations
84,330Construction and extraction occupations
73,777Personal care and service occupations
59,171Business and financial operations occupations
53,591Health diagnosing and treating practitioners and other technical occupations
44,766Installation, maintenance, and repair occupations
Top industries in this zip code by the number of employees in 2005:
Construction: Commercial and Institutional Building Construction (20-49 employees: 1 establishment)
Accommodation and Food Services: Full-Service Restaurants (5-9: 1)
Wholesale Trade: Grain and Field Bean Merchant Wholesalers (5-9: 1)
Professional, Scientific, and Technical Services: Testing Laboratories (1-4: 1)
Finance and Insurance: Insurance Agencies and Brokerages (1-4: 1)
Administrative and Support and Waste Management and Remediation Services: Court Reporting and Stenotype Services (1-4: 1)
Fatal accident statistics in 2013:
Fatal accident count: 2
Vehicles involved in fatal accidents: 3
Fatal accidents caused by drunken drivers: 1
Fatalities: 2
Persons involved in fatal accidents: 3
Pedestrians involved in fatal accidents: 0
2002 - 2018 National Fire Incident Reporting System (NFIRS) incidents
Based on the data from the years 2002 - 2018 the average number of fires per year is 8. The highest number of reported fire incidents - 20 took place in 2005, and the least - 0 in 2014. The data has a dropping trend.
When looking into fire subcategories, the most incidents belonged to: Structure Fires (53.6%), and Outside Fires (27.5%).
Fire incident types reported to NFIRS in Zip Code 46951


+$3,575
-$2,212
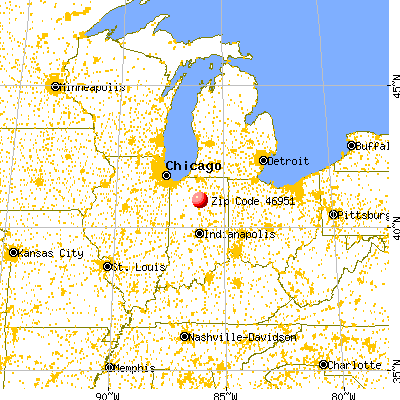
(% of AGI for various income ranges: -4.8% for AGIs below $10k, -2.3% for AGIs $10k-25k, 1.7% for AGIs $25k-50k, 0.6% for AGIs $50k-75k, 5.5% for AGIs $75k-100k)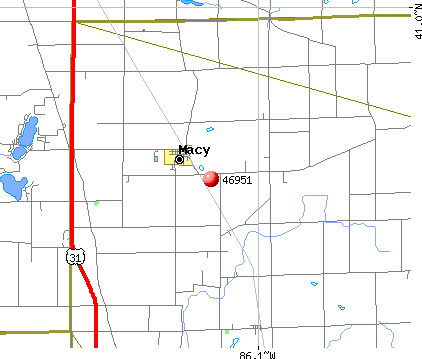 Nearest zip codes: 46926, 46910, 46958, 46988, 46931, 46974.
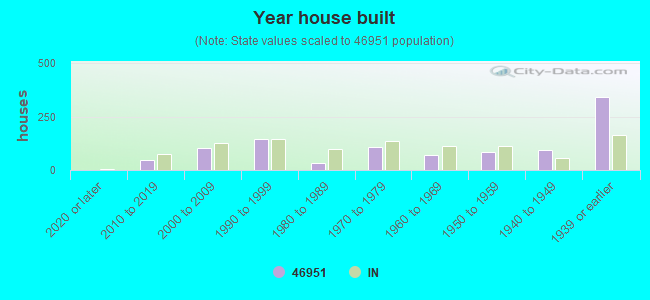


 Based on the data from the years 2002 - 2018 the average number of fires per year is 8. The highest number of reported fire incidents - 20 took place in 2005, and the least - 0 in 2014. The data has a dropping trend.
 When looking into fire subcategories, the most incidents belonged to: Structure Fires (53.6%), and Outside Fires (27.5%).