Estimated zip code population in 2022: 1,777 Zip code population in 2010: 2,101 Zip code population in 2000: 2,172
Houses and condos: 1,025 Renter-occupied apartments: 68
% of renters here:
8%
State:
29%
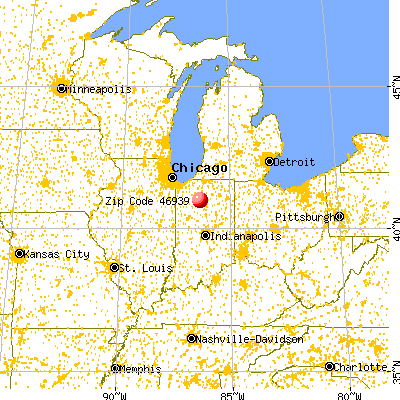
March 2022 cost of living index in zip code 46939: 84.4 (less than average, U.S. average is 100)
Land area: 94.5 sq. mi. Water area: 0.5 sq. mi.
Population density: 19 people per square mile
(very low).
OSM Map
General Map
Google Map
MSN Map
OSM Map
General Map
Google Map
MSN Map
OSM Map
General Map
Google Map
MSN Map
OSM Map
General Map
Google Map
MSN Map
Please wait while loading the map...
Real estate property taxes paid for housing units in 2022:
This zip code:
0.5% ($537)
Indiana:
0.7% ($1,467)
Median real estate property taxes paid for housing units with mortgages in 2022: $485 (0.4%) Median real estate property taxes paid for housing units with no mortgage in 2022: $572 (0.5%)
Estimated median house/condo value in 2022: $119,241
46939:
$119,241
Indiana:
$208,700
Median resident age:
This zip code:
50.9 years
Indiana median age:
38.2 years
Average household size:
This zip code:
2.2 people
Indiana:
2.4 people
Averages for the 2020 tax year for zip code 46939, filed in 2021:
Average Adjusted Gross Income (AGI) in 2020: $53,343 (Individual Income Tax Returns)
Here:
$53,343
State:
$64,978
Salary/wage: $45,695 (reported on 78.5% of returns)
Here:
$45,695
State:
$55,245
(% of AGI for various income ranges: 1030.0% for AGIs below $25k, 3578.5% for AGIs $25k-50k, 7011.0% for AGIs $50k-75k, 9358.3% for AGIs $75k-100k, 18846.7% for AGIs $100k-200k)
Taxable interest for individuals: $915 (reported on 35.5% of returns)
This zip code:
$915
Indiana:
$1,351
(% of AGI for various income ranges: 20.5% for AGIs below $25k, 13.5% for AGIs $25k-50k, 42.0% for AGIs $50k-75k, 221.7% for AGIs $75k-100k, 91.7% for AGIs $100k-200k)
Ordinary dividends: $2,069 (reported on 14.0% of returns)
Here:
$2,069
State:
$5,827
(% of AGI for various income ranges: 19.1% for AGIs below $25k, 13.0% for AGIs $25k-50k, 39.0% for AGIs $50k-75k, 71.7% for AGIs $75k-100k, 198.3% for AGIs $100k-200k)
Net capital gain/loss in AGI: +$3,169 (reported on 14.0% of returns)
Here:
+$3,169
State:
+$17,730
(% of AGI for various income ranges: 21.4% for AGIs below $25k, 40.0% for AGIs $50k-75k, 541.7% for AGIs $100k-200k)
Profit/loss from business: +$5,438 (reported on 14.0% of returns)
Here:
+$5,438
State:
+$12,144
(% of AGI for various income ranges: 93.2% for AGIs below $25k, 64.0% for AGIs $25k-50k, 196.0% for AGIs $50k-75k, 296.7% for AGIs $100k-200k)
Taxable individual retirement arrangement distribution: $10,933 (reported on 9.7% of returns)
46939:
$10,933
Indiana:
$18,302
(% of AGI for various income ranges: 70.0% for AGIs below $25k, 110.0% for AGIs $25k-50k, 180.0% for AGIs $50k-75k, 716.7% for AGIs $75k-100k)
Earned income credit: $2,240 (reported on 16.1% of returns)
Here:
$2,240
State:
$2,298
(% of AGI for various income ranges: 82.3% for AGIs below $25k, 77.5% for AGIs $25k-50k)
Percentage of individuals using paid preparers for their 2020 taxes: 95.7%
Here:
96%
State:
94%
(% for various income ranges: 93.8% for AGIs below $25k, 96.0% for AGIs $25k-50k, 93.3% for AGIs $50k-75k, 100.0% for AGIs $75k-100k, 100.0% for AGIs $100k-200k, 100.0% for AGIs over 200k)
Averages for the 2012 tax year for zip code 46939, filed in 2013:
Average Adjusted Gross Income (AGI) in 2012: $45,100 (Individual Income Tax Returns)
Here:
$45,100
State:
$52,932
Salary/wage: $37,165 (reported on 77.2% of returns)
Here:
$37,165
State:
$45,173
(% of AGI for various income ranges: 66.0% for AGIs below $25k, 76.6% for AGIs $25k-50k, 77.5% for AGIs $50k-75k, 70.1% for AGIs $75k-100k, 38.4% for AGIs $100k-200k)
Taxable interest for individuals: $879 (reported on 37.0% of returns)
This zip code:
$879
Indiana:
$1,311
(% of AGI for various income ranges: 2.0% for AGIs below $25k, 0.8% for AGIs $25k-50k, 0.9% for AGIs $50k-75k, 0.4% for AGIs $75k-100k, 0.4% for AGIs $100k-200k)
Ordinary dividends: $1,800 (reported on 15.2% of returns)
Here:
$1,800
State:
$4,690
(% of AGI for various income ranges: 1.4% for AGIs below $25k, 0.6% for AGIs $25k-50k, 0.5% for AGIs $75k-100k, 0.8% for AGIs $100k-200k)
Net capital gain/loss in AGI: +$3,520 (reported on 10.9% of returns)
Here:
+$3,520
State:
+$10,406
(% of AGI for various income ranges: 0.1% for AGIs $25k-50k, 0.9% for AGIs $50k-75k, 2.4% for AGIs $100k-200k)
Profit/loss from business: +$7,333 (reported on 13.0% of returns)
Here:
+$7,333
State:
+$11,105
(% of AGI for various income ranges: 7.2% for AGIs below $25k, 2.5% for AGIs $25k-50k, 4.6% for AGIs $75k-100k)
Taxable individual retirement arrangement distribution: $10,522 (reported on 9.8% of returns)
46939:
$10,522
Indiana:
$13,841
(% of AGI for various income ranges: 2.6% for AGIs below $25k, 3.5% for AGIs $25k-50k, 6.4% for AGIs $75k-100k)
Total itemized deductions: $17,000 (20% of AGI, reported on 16.3% of returns)
Here:
$17,000
State:
$20,913
Here:
19.5% of AGI
State:
18.2% of AGI
(% of AGI for various income ranges: 6.8% for AGIs $25k-50k, 5.5% for AGIs $50k-75k, 7.5% for AGIs $75k-100k, 7.1% for AGIs $100k-200k)
Charity contributions: $3,409 (reported on 12.0% of returns)
Here:
$3,409
State:
$4,697
(% of AGI for various income ranges: 1.3% for AGIs $25k-50k, 1.3% for AGIs $75k-100k, 1.3% for AGIs $100k-200k)
Taxes paid: $5,733 (reported on 16.3% of returns)
46939:
$5,733
State:
$7,456
(% of AGI for various income ranges: 1.2% for AGIs $25k-50k, 1.5% for AGIs $50k-75k, 2.5% for AGIs $75k-100k, 3.5% for AGIs $100k-200k)
Earned income credit: $2,176 (reported on 18.5% of returns)
Here:
$2,176
State:
$2,265
(% of AGI for various income ranges: 6.4% for AGIs below $25k, 1.3% for AGIs $25k-50k)
Percentage of individuals using paid preparers for their 2012 taxes: 73.9%
Here:
74%
State:
53%
(% for various income ranges: 71.4% for AGIs below $25k, 73.1% for AGIs $25k-50k, 71.4% for AGIs $50k-75k, 80.0% for AGIs $75k-100k, 85.7% for AGIs $100k-200k)
Averages for the 2004 tax year for zip code 46939, filed in 2005:
Average Adjusted Gross Income (AGI) in 2004: $32,662 (Individual Income Tax Returns)
Here:
$32,662
State:
$44,790
Salary/wage: $30,498 (reported on 82.7% of returns)
Here:
$30,498
State:
$39,615
(% of AGI for various income ranges: 112.7% for AGIs below $10k, 72.1% for AGIs $10k-25k, 79.8% for AGIs $25k-50k, 79.2% for AGIs $50k-75k, 84.4% for AGIs $75k-100k, 53.1% for AGIs over 100k)
Taxable interest for individuals: $1,322 (reported on 46.2% of returns)
This zip code:
$1,322
Indiana:
$1,535
(% of AGI for various income ranges: 6.9% for AGIs below $10k, 1.8% for AGIs $10k-25k, 2.6% for AGIs $25k-50k, 1.7% for AGIs $50k-75k, 0.6% for AGIs $75k-100k, 1.5% for AGIs over 100k)
Taxable dividends: $865 (reported on 16.1% of returns)
Here:
$865
State:
$2,998
(% of AGI for various income ranges: 1.3% for AGIs below $10k, 0.5% for AGIs $10k-25k, 0.7% for AGIs $25k-50k, 0.2% for AGIs $50k-75k, 0.4% for AGIs $75k-100k)
Net capital gain/loss: +$1,331 (reported on 12.2% of returns)
Here:
+$1,331
State:
+$8,619
(% of AGI for various income ranges: -0.5% for AGIs below $10k, -0.4% for AGIs $10k-25k, 0.4% for AGIs $25k-50k, 1.1% for AGIs $50k-75k, 0.9% for AGIs $75k-100k)
Profit/loss from business: +$4,050 (reported on 16.5% of returns)
Here:
+$4,050
State:
+$10,071
(% of AGI for various income ranges: 0.5% for AGIs below $10k, 5.1% for AGIs $10k-25k, 1.7% for AGIs $25k-50k, 2.6% for AGIs $50k-75k, 0.6% for AGIs $75k-100k)
Profit/loss from farming: +$450 (reported on 11.3% of returns)
Here:
+$450
State:
-$2,212
(% of AGI for various income ranges: -32.2% for AGIs below $10k, 1.3% for AGIs $10k-25k, 0.3% for AGIs $25k-50k, 1.2% for AGIs $50k-75k, 2.1% for AGIs $75k-100k)
IRA payment deduction: $2,280 (reported on 2.6% of returns)
46939:
$2,280
Indiana:
$2,840
Total itemized deductions: $14,544 (25% of AGI, reported on 17.7% of returns)
Here:
$14,544
State:
$17,065
Here:
25.0% of AGI
State:
19.5% of AGI
(% of AGI for various income ranges: 11.4% for AGIs $10k-25k, 5.8% for AGIs $25k-50k, 6.7% for AGIs $50k-75k, 11.2% for AGIs $75k-100k, 7.9% for AGIs over 100k)
Charity contributions deductions: $2,329 (4% of AGI, reported on 14.5% of returns)
Here:
$2,329
State:
$3,550
Here:
3.8% of AGI
State:
3.8% of AGI
(% of AGI for various income ranges: 0.9% for AGIs $10k-25k, 0.7% for AGIs $25k-50k, 0.7% for AGIs $50k-75k, 2.1% for AGIs $75k-100k, 1.4% for AGIs over 100k)
Total tax: $3,869 (reported on 71.9% of returns)
46939:
$3,869
State:
$6,914
(% of AGI for various income ranges: 3.6% for AGIs below $10k, 4.6% for AGIs $10k-25k, 6.6% for AGIs $25k-50k, 8.3% for AGIs $50k-75k, 10.5% for AGIs $75k-100k, 17.0% for AGIs over 100k)
Earned income credit: $1,726 (reported on 16.2% of returns)
Here:
$1,726
State:
$1,685
Percentage of individuals using paid preparers for their 2004 taxes: 74.6%
Here:
75%
State:
59%
(% for various income ranges: 68.8% for AGIs below $10k, 72.1% for AGIs $10k-25k, 79.3% for AGIs $25k-50k, 80.1% for AGIs $50k-75k, 69.8% for AGIs $75k-100k, 91.3% for AGIs over 100k)
Likely homosexual households (counted as self-reported same-sex unmarried-partner households)
Lesbian couples: 0.0% of all households
Gay men: 0.2% of all households
Household received Food Stamps/SNAP in the past 12 months: 38 Household did not receive Food Stamps/SNAP in the past 12 months: 765
Women who had a birth in the past 12 months: 86 (5 now married, 69 unmarried) Women who did not have a birth in the past 12 months: 271 (117 now married, 153 unmarried)
Housing units in zip code 46939 with a mortgage: 361 (47 second mortgage, 46 both second mortgage and home equity loan) Median monthly owner costs for units with a mortgage: $1,080 Median monthly owner costs for units without a mortgage: $474
Residents with income below the poverty level in 2022:
This zip code:
13.2%
Whole state:
12.6%
Residents with income below 50% of the poverty level in 2022:
This zip code:
7.6%
Whole state:
6.3%
Median number of rooms in houses and condos:
Here:
6.0
State:
6.6
Median number of rooms in apartments:
Here:
5.9
State:
4.3
Notable locations in this zip code not listed on our city pages
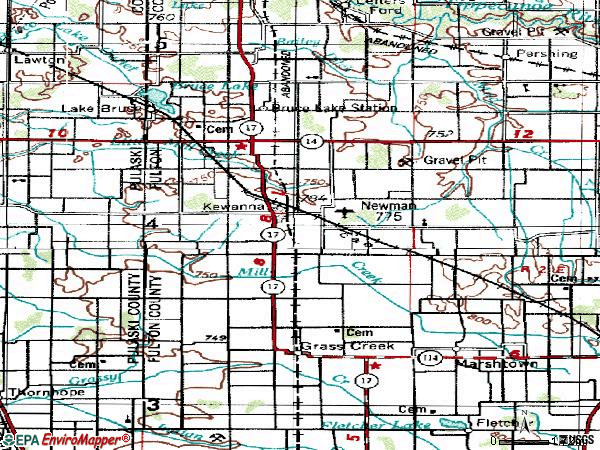
Notable locations in zip code 46939: Wayne Township Volunteer Fire Department (A), Kewanna - Union Township Volunteer Fire Department (B). Display/hide their locations on the map
Churches in zip code 46939 include: Olive Branch Church (A), Pleasant Hill Church (B), Prairie Grove Church (C), Sharon Church (D). Display/hide their locations on the map
Cemeteries: Barnett Cemetery (1), Bowman Cemetery (2), Bruce Lake Cemetery (3), Reed Cemetery (4), Shaffer Cemetery (5), Independent Order of Odd Fellows Cemetery (6), Saint Anns Cemetery (7). Display/hide their locations on the map
Size of family households: 298 2-persons, 73 3-persons, 51 4-persons, 47 5-persons, 2 7-or-more-persons
Size of nonfamily households: 279 1-person, 52 2-persons, 1 3-persons
134 married couples with children.
71 single-parent households (20 men, 51 women).
96.4% of residents of 46939 zip code speak English at home.
0.7% of residents speak Spanish at home (50% very well, 50% well).
2.5% of residents speak other Indo-European language at home (100% very well).
0.3% of residents speak other language at home (100% very well).
Foreign born population: 24 (1.4%) (69.3% of them are naturalized citizens)
This zip code:
1.4%
Whole state:
6.1%
46%Dominica
38%Cambodia
25%North Macedonia (Macedonia)
4%France
22%German
18%American
16%English
8%Irish
4%Polish
2%Scotch-Irish
2%French
Year of entry for the foreign-born population
02010 or later
02000 to 2009
01990 to 1999
28Before 1990
Facilities with environmental interests located in this zip code:
COWLES SAND & GRAVEL (101 S CR 600 W in KEWANNA, IN)
AIR SYNTHETIC MINOR (AIRS/AFS) STATE MASTER (Indiana facility tracking) - ACES-OP-04903200, AIR PROGRAM, LUST-199812598, LEAKING STORAGE TANK, UST-13855, UNDERGROUND STORAGE TANK PROGRAM Business SIC classification: ASPHALT PAVING MIXTURES AND BLOCKS
PLYMOUTH TUBE CO (718 E MAIN ST in KEWANNA, IN)
STATE MASTER (Indiana facility tracking) (Resource Conservation and Recovery Act (tracking hazardous waste))
SADLER SERVICE CENTER (RR 2 BOX 107 in KEWANNA, IN)
STATE MASTER (Indiana facility tracking) COMPLIANCE ACTIVITY (Tracking inspections of insecticide, fungicide, and rodenticide, and toxic substances)
Housing units lacking complete plumbing facilities: 2.7% Housing units lacking complete kitchen facilities: 5.7%
43.5%Utility gas
33.7%Bottled, tank, or LP gas
17.8%Electricity
3.2%Fuel oil, kerosene, etc.
2.2%Wood
Population in 1990: 1,966. Population change in the 1990s: +206 (+10.5%).
Place of birth for U.S.-born residents:
This state: 1,294
Midwest: 245
South: 167
West: 27
66% of the 46939 zip code residents lived in the same house 5 years ago. Out of people who lived in different houses, 47% lived in this county. Out of people who lived in different counties, 50% lived in Indiana.
92% of the 46939 zip code residents lived in the same house 1 year ago. Out of people who lived in different houses, 30% moved from this county. Out of people who lived in different houses, 70% moved from different county within same state. Out of people who lived in different houses, 1% moved from different state.
Private vs. public school enrollment:
Students in private schools in grades 1 to 8 (elementary and middle school): 16
Here:
17.7%
Indiana:
14.9%
Students in private schools in grades 9 to 12 (high school):
Here:
0.0%
Indiana:
11.4%
Students in private undergraduate colleges: 2
Here:
16.6%
Indiana:
22.3%
Occupation by median earnings in the past 12 months ($)
115,985Health diagnosing and treating practitioners and other technical occupations
85,525Installation, maintenance, and repair occupations
80,030Business and financial operations occupations
61,351Transportation occupations
44,266Management occupations
43,946Building and grounds cleaning and maintenance occupations
Top industries in this zip code by the number of employees in 2005:
Other Services (except Public Administration): Religious Organizations (1-4: 2)
Health Care and Social Assistance: Community Food Services (1-4: 1)
Construction: New Single-Family Housing Construction (except Operative Builders) (1-4: 1)
Fatal accident statistics in 2010:
Fatal accident count: 1
Vehicles involved in fatal accidents: 2
Fatal accidents caused by drunken drivers: 0
Fatalities: 1
Persons involved in fatal accidents: 4
Pedestrians involved in fatal accidents: 0
2002 - 2018 National Fire Incident Reporting System (NFIRS) incidents
Based on the data from the years 2002 - 2018 the average number of fires per year is 10. The highest number of reported fire incidents - 18 took place in 2009, and the least - 1 in 2018. The data has a dropping trend.
When looking into fire subcategories, the most incidents belonged to: Structure Fires (43.5%), and Outside Fires (38.7%).
Fire incident types reported to NFIRS in Zip Code 46939


+$450
-$2,212
(% of AGI for various income ranges: -32.2% for AGIs below $10k, 1.3% for AGIs $10k-25k, 0.3% for AGIs $25k-50k, 1.2% for AGIs $50k-75k, 2.1% for AGIs $75k-100k)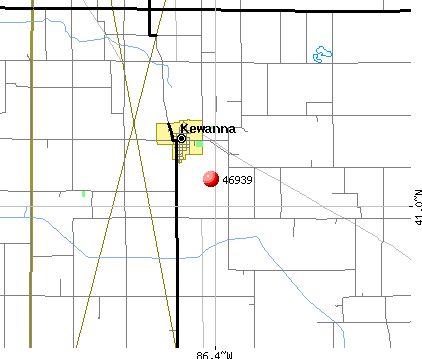 Nearest zip codes: 46950, 46931, 46922, 46975, 46978, 46985.


 Based on the data from the years 2002 - 2018 the average number of fires per year is 10. The highest number of reported fire incidents - 18 took place in 2009, and the least - 1 in 2018. The data has a dropping trend.
 When looking into fire subcategories, the most incidents belonged to: Structure Fires (43.5%), and Outside Fires (38.7%).