Estimated zip code population in 2022: 1,161 Zip code population in 2010: 1,441 Zip code population in 2000: 1,584
Houses and condos: 647 Renter-occupied apartments: 76
% of renters here:
17%
State:
29%
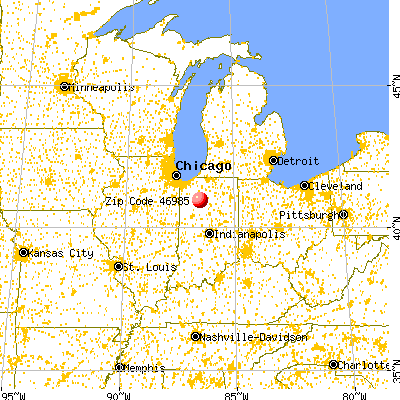
March 2022 cost of living index in zip code 46985: 84.9 (less than average, U.S. average is 100)
Land area: 70.3 sq. mi. Water area: 0.1 sq. mi.
Population density: 17 people per square mile
(very low).
OSM Map
General Map
Google Map
MSN Map
OSM Map
General Map
Google Map
MSN Map
OSM Map
General Map
Google Map
MSN Map
OSM Map
General Map
Google Map
MSN Map
Please wait while loading the map...
Real estate property taxes paid for housing units in 2022:
This zip code:
0.5% ($537)
Indiana:
0.7% ($1,467)
Median real estate property taxes paid for housing units with mortgages in 2022: $560 (0.4%) Median real estate property taxes paid for housing units with no mortgage in 2022: $519 (0.5%)
Business Search- 14 Million verified businesses
Males: 561
(48.3%)
Females: 599
(51.7%)
For population 25 years and over in 46985:
High school or higher: 79.4%
Bachelor's degree or higher: 12.6%
Graduate or professional degree: 3.8%
Unemployed: 8.0%
Mean travel time to work (commute): 21.0 minutes
For population 15 years and over in 46985:
Never married: 15.6%
Now married: 50.3%
Separated: 0.0%
Widowed: 9.0%
Divorced: 25.1%
Zip code 46985 compared to state average:
Median house value below state average.
Unemployed percentage above state average.
Black race population percentage significantly below state average.
Hispanic race population percentage significantly below state average.
Median age significantly above state average.
Foreign-born population percentage significantly below state average.
Renting percentage below state average.
Length of stay since moving in significantly above state average.
Percentage of population with a bachelor's degree or higher below state average.
Estimated median house/condo value in 2022: $109,465
46985:
$109,465
Indiana:
$208,700
Median resident age:
This zip code:
50.9 years
Indiana median age:
38.2 years
Average household size:
This zip code:
2.5 people
Indiana:
2.4 people
Averages for the 2020 tax year for zip code 46985, filed in 2021:
Average Adjusted Gross Income (AGI) in 2020: $53,464 (Individual Income Tax Returns)
Here:
$53,464
State:
$64,978
Salary/wage: $45,181 (reported on 80.6% of returns)
Here:
$45,181
State:
$55,245
(% of AGI for various income ranges: 1008.1% for AGIs below $25k, 3806.2% for AGIs $25k-50k, 6720.0% for AGIs $50k-75k, 10620.0% for AGIs $75k-100k, 17770.0% for AGIs $100k-200k)
Taxable interest for individuals: $904 (reported on 35.8% of returns)
This zip code:
$904
Indiana:
$1,351
(% of AGI for various income ranges: 13.8% for AGIs below $25k, 38.5% for AGIs $25k-50k, 47.1% for AGIs $50k-75k, 52.5% for AGIs $75k-100k, 182.0% for AGIs $100k-200k)
Ordinary dividends: $2,164 (reported on 16.4% of returns)
Here:
$2,164
State:
$5,827
(% of AGI for various income ranges: 53.1% for AGIs $25k-50k, 81.4% for AGIs $50k-75k, 224.0% for AGIs $100k-200k)
Net capital gain/loss in AGI: +$6,162 (reported on 11.9% of returns)
Here:
+$6,162
State:
+$17,730
(% of AGI for various income ranges: 22.5% for AGIs below $25k, 207.1% for AGIs $50k-75k, 624.0% for AGIs $100k-200k)
Profit/loss from business: +$4,086 (reported on 10.4% of returns)
Here:
+$4,086
State:
+$12,144
(% of AGI for various income ranges: 130.0% for AGIs below $25k, 111.4% for AGIs $50k-75k)
Taxable individual retirement arrangement distribution: $12,243 (reported on 10.4% of returns)
46985:
$12,243
Indiana:
$18,302
(% of AGI for various income ranges: 89.4% for AGIs below $25k, 187.7% for AGIs $25k-50k, 1175.0% for AGIs $75k-100k)
Earned income credit: $1,850 (reported on 17.9% of returns)
Here:
$1,850
State:
$2,298
(% of AGI for various income ranges: 90.0% for AGIs below $25k, 60.0% for AGIs $25k-50k)
Percentage of individuals using paid preparers for their 2020 taxes: 97.0%
Here:
97%
State:
94%
(% for various income ranges: 95.8% for AGIs below $25k, 94.1% for AGIs $25k-50k, 100.0% for AGIs $50k-75k, 100.0% for AGIs $75k-100k, 100.0% for AGIs $100k-200k)
Averages for the 2012 tax year for zip code 46985, filed in 2013:
Average Adjusted Gross Income (AGI) in 2012: $46,797 (Individual Income Tax Returns)
Here:
$46,797
State:
$52,932
Salary/wage: $38,460 (reported on 86.9% of returns)
Here:
$38,460
State:
$45,173
(% of AGI for various income ranges: 70.8% for AGIs below $25k, 82.1% for AGIs $25k-50k, 79.4% for AGIs $50k-75k, 73.4% for AGIs $75k-100k, 57.9% for AGIs $100k-200k)
Taxable interest for individuals: $604 (reported on 41.0% of returns)
This zip code:
$604
Indiana:
$1,311
(% of AGI for various income ranges: 1.5% for AGIs below $25k, 0.5% for AGIs $25k-50k, 0.3% for AGIs $50k-75k, 0.4% for AGIs $75k-100k, 0.5% for AGIs $100k-200k)
Ordinary dividends: $1,327 (reported on 18.0% of returns)
Here:
$1,327
State:
$4,690
(% of AGI for various income ranges: 1.0% for AGIs $25k-50k, 0.7% for AGIs $50k-75k, 0.5% for AGIs $100k-200k)
Net capital gain/loss in AGI: +$1,114 (reported on 11.5% of returns)
Here:
+$1,114
State:
+$10,406
Profit/loss from business: +$6,638 (reported on 13.1% of returns)
Here:
+$6,638
State:
+$11,105
(% of AGI for various income ranges: 7.6% for AGIs below $25k, 3.4% for AGIs $25k-50k, 2.2% for AGIs $75k-100k)
Taxable individual retirement arrangement distribution: $6,920 (reported on 8.2% of returns)
46985:
$6,920
Indiana:
$13,841
Total itemized deductions: $18,291 (20% of AGI, reported on 18.0% of returns)
Here:
$18,291
State:
$20,913
Here:
19.6% of AGI
State:
18.2% of AGI
(% of AGI for various income ranges: 9.7% for AGIs $25k-50k, 7.8% for AGIs $75k-100k, 11.4% for AGIs $100k-200k)
Charity contributions: $2,200 (reported on 9.8% of returns)
Here:
$2,200
State:
$4,697
Taxes paid: $7,445 (reported on 18.0% of returns)
46985:
$7,445
State:
$7,456
(% of AGI for various income ranges: 3.0% for AGIs $25k-50k, 3.0% for AGIs $75k-100k, 5.4% for AGIs $100k-200k)
Earned income credit: $2,009 (reported on 18.0% of returns)
Here:
$2,009
State:
$2,265
(% of AGI for various income ranges: 5.3% for AGIs below $25k, 1.2% for AGIs $25k-50k)
Percentage of individuals using paid preparers for their 2012 taxes: 68.9%
Here:
69%
State:
53%
(% for various income ranges: 60.9% for AGIs below $25k, 64.7% for AGIs $25k-50k, 77.8% for AGIs $50k-75k, 83.3% for AGIs $75k-100k, 83.3% for AGIs $100k-200k)
Averages for the 2004 tax year for zip code 46985, filed in 2005:
Average Adjusted Gross Income (AGI) in 2004: $34,336 (Individual Income Tax Returns)
Here:
$34,336
State:
$44,790
Salary/wage: $32,861 (reported on 83.5% of returns)
Here:
$32,861
State:
$39,615
(% of AGI for various income ranges: 73.3% for AGIs below $10k, 74.0% for AGIs $10k-25k, 79.8% for AGIs $25k-50k, 84.5% for AGIs $50k-75k, 84.6% for AGIs $75k-100k, 70.4% for AGIs over 100k)
Taxable interest for individuals: $1,079 (reported on 54.1% of returns)
This zip code:
$1,079
Indiana:
$1,535
(% of AGI for various income ranges: 5.1% for AGIs below $10k, 4.3% for AGIs $10k-25k, 2.1% for AGIs $25k-50k, 0.8% for AGIs $50k-75k, 0.8% for AGIs $75k-100k, 0.6% for AGIs over 100k)
Taxable dividends: $748 (reported on 20.6% of returns)
Here:
$748
State:
$2,998
(% of AGI for various income ranges: 1.1% for AGIs below $10k, 0.5% for AGIs $10k-25k, 0.6% for AGIs $25k-50k, 0.4% for AGIs $50k-75k, 0.3% for AGIs $75k-100k)
Net capital gain/loss: +$2,610 (reported on 16.1% of returns)
Here:
+$2,610
State:
+$8,619
(% of AGI for various income ranges: 4.1% for AGIs below $10k, 2.7% for AGIs $10k-25k, 0.3% for AGIs $25k-50k, 0.4% for AGIs $50k-75k, 3.7% for AGIs $75k-100k)
Profit/loss from business: +$2,988 (reported on 13.0% of returns)
Here:
+$2,988
State:
+$10,071
(% of AGI for various income ranges: 3.0% for AGIs below $10k, 3.0% for AGIs $10k-25k, 1.5% for AGIs $25k-50k, 0.9% for AGIs $50k-75k)
Profit/loss from farming: +$2,356 (reported on 9.0% of returns)
Here:
+$2,356
State:
-$2,212
IRA payment deduction: $2,846 (reported on 2.0% of returns)
46985:
$2,846
Indiana:
$2,840
Total itemized deductions: $12,944 (21% of AGI, reported on 16.5% of returns)
Here:
$12,944
State:
$17,065
Here:
20.9% of AGI
State:
19.5% of AGI
(% of AGI for various income ranges: 8.6% for AGIs $10k-25k, 6.0% for AGIs $25k-50k, 4.2% for AGIs $50k-75k, 7.6% for AGIs $75k-100k, 9.3% for AGIs over 100k)
Charity contributions deductions: $1,521 (2% of AGI, reported on 10.9% of returns)
Here:
$1,521
State:
$3,550
Here:
2.2% of AGI
State:
3.8% of AGI
(% of AGI for various income ranges: 0.7% for AGIs $25k-50k, 0.3% for AGIs $50k-75k, 0.8% for AGIs $75k-100k, 0.7% for AGIs over 100k)
Total tax: $4,000 (reported on 73.7% of returns)
46985:
$4,000
State:
$6,914
(% of AGI for various income ranges: 2.3% for AGIs below $10k, 3.5% for AGIs $10k-25k, 7.2% for AGIs $25k-50k, 8.5% for AGIs $50k-75k, 11.3% for AGIs $75k-100k, 15.7% for AGIs over 100k)
Earned income credit: $1,369 (reported on 12.8% of returns)
Here:
$1,369
State:
$1,685
Percentage of individuals using paid preparers for their 2004 taxes: 72.8%
Here:
73%
State:
59%
(% for various income ranges: 62.8% for AGIs below $10k, 76.8% for AGIs $10k-25k, 74.2% for AGIs $25k-50k, 79.2% for AGIs $50k-75k, 73.2% for AGIs $75k-100k, 72.2% for AGIs over 100k)
Household received Food Stamps/SNAP in the past 12 months: 6 Household did not receive Food Stamps/SNAP in the past 12 months: 447
Women who had a birth in the past 12 months: 19 (20 now married, 0 unmarried) Women who did not have a birth in the past 12 months: 89 (63 now married, 25 unmarried)
Housing units in zip code 46985 with a mortgage: 151 (12 second mortgage, 12 both second mortgage and home equity loan) Median monthly owner costs for units with a mortgage: $863 Median monthly owner costs for units without a mortgage: $397
Residents with income below the poverty level in 2022:
This zip code:
8.0%
Whole state:
12.6%
Residents with income below 50% of the poverty level in 2022:
This zip code:
7.1%
Whole state:
6.3%
Median number of rooms in houses and condos:
Here:
5.6
State:
6.6
Median number of rooms in apartments:
Here:
4.3
State:
4.3
Notable locations in this zip code not listed on our city pages
Cemeteries: Mull Cemetery (1), Victor Chapel Cemetery (2), Hoover Cemetery (3), Independent Order of Odd Fellows Cemetery (4), Indian Creek Cemetery (5), Saint Josephs Cemetery (6), Buck Cemetery (7). Display/hide their locations on the map
Size of family households: 174 2-persons, 65 3-persons, 21 4-persons, 14 5-persons, 14 6-persons, 13 7-or-more-persons
Size of nonfamily households: 143 1-person, 9 2-persons
180 married couples with children.
46 single-parent households (10 men, 36 women).
98.3% of residents of 46985 zip code speak English at home.
0.9% of residents speak Spanish at home (100% very well).
0.7% of residents speak other Indo-European language at home (100% well).
Foreign born population: 6 (0.6%) (100.0% of them are naturalized citizens)
This zip code:
0.6%
Whole state:
6.1%
43%German
20%American
14%European
10%Irish
2%Swedish
2%Italian
1%Greek
Year of entry for the foreign-born population
02010 or later
02000 to 2009
01990 to 1999
5Before 1990
Facilities with environmental interests located in this zip code:
PULASKI WHITE RURAL TELEPHONE (5573 S US HWY 35 in STAR CITY, IN)
STATE MASTER (Indiana facility tracking) - UST-14616, UNDERGROUND STORAGE TANK PROGRAM, UST-17532, UST-21125, (Resource Conservation and Recovery Act (tracking hazardous waste)) Alternative names: SOCIETY BANK STAR CITY BRANCH
Housing units lacking complete plumbing facilities: 4.6% Housing units lacking complete kitchen facilities: 4.9%
53.3%Bottled, tank, or LP gas
37.4%Utility gas
8.2%Electricity
1.6%Wood
Population in 1990: 951. Population change in the 1990s: +633 (+66.6%).
Place of birth for U.S.-born residents:
This state: 950
Northeast: 11
Midwest: 76
South: 93
West: 12
64% of the 46985 zip code residents lived in the same house 5 years ago. Out of people who lived in different houses, 49% lived in this county. Out of people who lived in different counties, 50% lived in Indiana.
92% of the 46985 zip code residents lived in the same house 1 year ago. Out of people who lived in different houses, 28% moved from this county. Out of people who lived in different houses, 44% moved from different county within same state. Out of people who lived in different houses, 31% moved from different state.
Private vs. public school enrollment:
Students in private schools in grades 1 to 8 (elementary and middle school):
Here:
0.0%
Indiana:
14.9%
Students in private undergraduate colleges: 13
Here:
32.9%
Indiana:
22.3%
Occupation by median earnings in the past 12 months ($)
75,910Sales and related occupations
71,947Construction and extraction occupations
34,484Office and administrative support occupations
28,634Production occupations
Top industries in this zip code by the number of employees in 2005:
Wholesale Trade: Grain and Field Bean Merchant Wholesalers (10-19 employees: 1 establishment, 5-9 employees: 1 establishment)
Wholesale Trade: Recyclable Material Merchant Wholesalers (10-19: 1)
Accommodation and Food Services: Full-Service Restaurants (5-9: 1)
Wholesale Trade: Farm and Garden Machinery and Equipment Merchant Wholesalers (5-9: 1)
Arts, Entertainment, and Recreation: Golf Courses and Country Clubs (5-9: 1)
Construction: New Single-Family Housing Construction (except Operative Builders) (1-4: 2)
2002 - 2018 National Fire Incident Reporting System (NFIRS) incidents
According to the data from the years 2002 - 2018 the average number of fire incidents per year is 14. The highest number of fire incidents - 30 took place in 2010, and the least - 3 in 2014. The data has a constant trend.
When looking into fire subcategories, the most reports belonged to: Outside Fires (46.5%), and Structure Fires (46.1%).
Fire incident types reported to NFIRS in Zip Code 46985


+$2,356
-$2,212
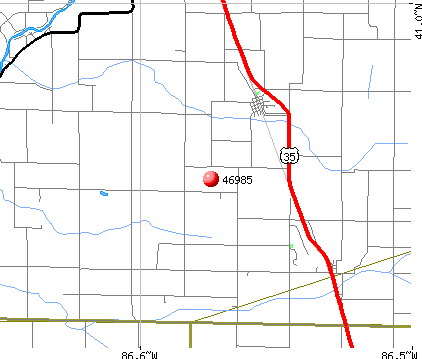 Nearest zip codes: 46978, 46996, 47950, 47926, 46939, 47925.


 According to the data from the years 2002 - 2018 the average number of fire incidents per year is 14. The highest number of fire incidents - 30 took place in 2010, and the least - 3 in 2014. The data has a constant trend.
 When looking into fire subcategories, the most reports belonged to: Outside Fires (46.5%), and Structure Fires (46.1%).