Estimated zip code population in 2022: 3,691 Zip code population in 2010: 3,502 Zip code population in 2000: 3,375
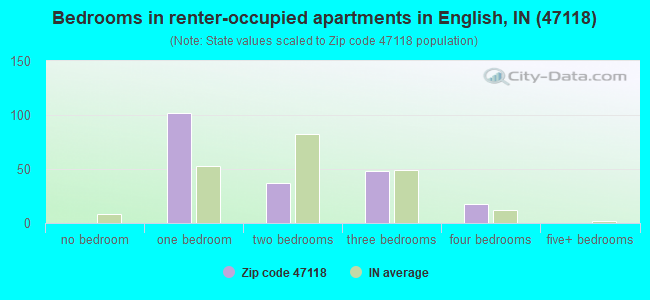
Houses and condos: 1,850 Renter-occupied apartments: 201
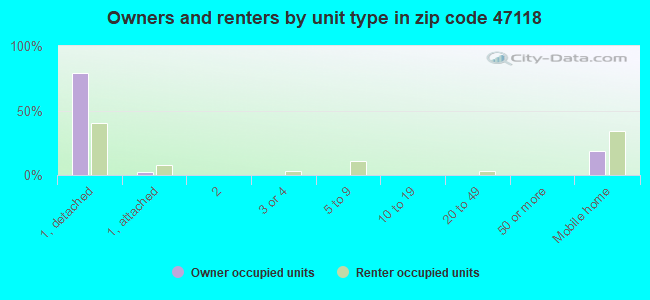
% of renters here:
14%
State:
29%
March 2022 cost of living index in zip code 47118: 84.6 (less than average, U.S. average is 100)
Land area: 142.0 sq. mi. Water area: 1.9 sq. mi.
Population density: 26 people per square mile
(very low).
OSM Map
General Map
Google Map
MSN Map
OSM Map
General Map
Google Map
MSN Map
OSM Map
General Map
Google Map
MSN Map
OSM Map
General Map
Google Map
MSN Map
Please wait while loading the map...
Real estate property taxes paid for housing units in 2022:
This zip code:
0.7% ($831)
Indiana:
0.7% ($1,467)
Median real estate property taxes paid for housing units with mortgages in 2022: $1,204 (0.8%) Median real estate property taxes paid for housing units with no mortgage in 2022: $709 (0.7%)
Business Search- 14 Million verified businesses
Males: 1,954
(53.0%)
Females: 1,736
(47.0%)
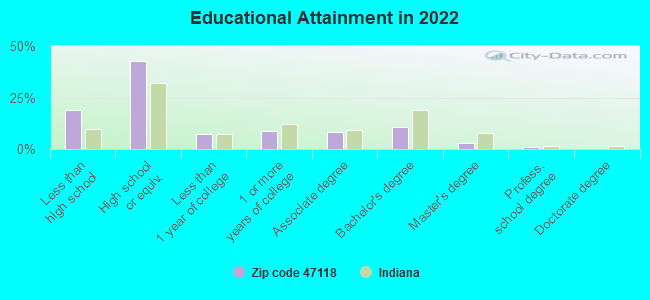
For population 25 years and over in 47118:
High school or higher: 79.9%
Bachelor's degree or higher: 14.2%
Graduate or professional degree: 3.7%
Unemployed: 1.5%
Mean travel time to work (commute): 40.8 minutes
For population 15 years and over in 47118:
Never married: 20.8%
Now married: 52.7%
Separated: 0.6%
Widowed: 10.7%
Divorced: 15.3%
Zip code 47118 compared to state average:
Median household income below state average.
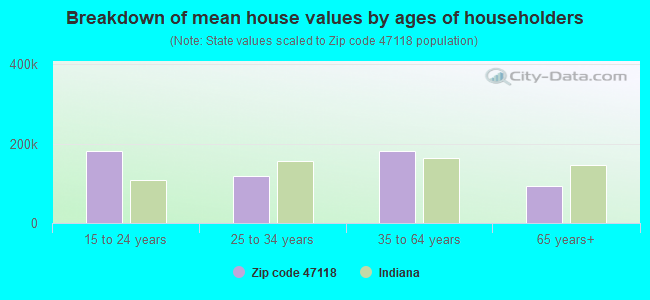
Median house value below state average.
Unemployed percentage below state average.
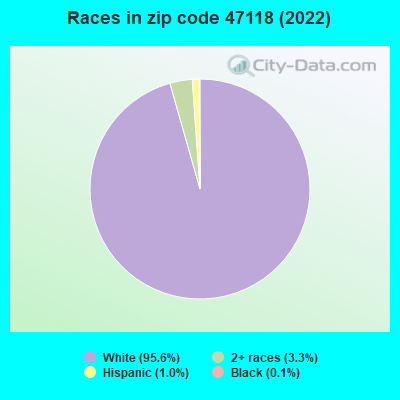
Black race population percentage significantly below state average.
Hispanic race population percentage significantly below state average.
Foreign-born population percentage significantly below state average.
Renting percentage below state average.
Length of stay since moving in above state average.
Number of college students significantly below state average.
Percentage of population with a bachelor's degree or higher below state average.
Estimated median house/condo value in 2022: $122,651
47118:
$122,651
Indiana:
$208,700
Median resident age:
This zip code:
40.8 years
Indiana median age:
38.2 years
Average household size:
This zip code:
2.5 people
Indiana:
2.4 people
Averages for the 2020 tax year for zip code 47118, filed in 2021:
Average Adjusted Gross Income (AGI) in 2020: $43,097 (Individual Income Tax Returns)
Here:
$43,097
State:
$64,978
Salary/wage: $39,731 (reported on 77.9% of returns)
Here:
$39,731
State:
$55,245
(% of AGI for various income ranges: 969.5% for AGIs below $25k, 3373.1% for AGIs $25k-50k, 6050.0% for AGIs $50k-75k, 8632.2% for AGIs $75k-100k, 17247.1% for AGIs $100k-200k)
Taxable interest for individuals: $516 (reported on 22.1% of returns)
This zip code:
$516
Indiana:
$1,351
(% of AGI for various income ranges: 17.3% for AGIs below $25k, 8.8% for AGIs $25k-50k, 14.7% for AGIs $50k-75k, 8.9% for AGIs $75k-100k, 47.1% for AGIs $100k-200k)
Ordinary dividends: $2,073 (reported on 10.3% of returns)
Here:
$2,073
State:
$5,827
(% of AGI for various income ranges: 12.7% for AGIs below $25k, 21.2% for AGIs $25k-50k, 82.4% for AGIs $50k-75k, 72.9% for AGIs $100k-200k)
Net capital gain/loss in AGI: +$4,593 (reported on 10.3% of returns)
Here:
+$4,593
State:
+$17,730
(% of AGI for various income ranges: 14.9% for AGIs below $25k, 20.3% for AGIs $25k-50k, 140.6% for AGIs $50k-75k, 462.9% for AGIs $100k-200k)
Profit/loss from business: +$10,155 (reported on 13.8% of returns)
Here:
+$10,155
State:
+$12,144
(% of AGI for various income ranges: 86.1% for AGIs below $25k, 265.6% for AGIs $25k-50k, 313.5% for AGIs $50k-75k, 327.8% for AGIs $75k-100k)
Taxable individual retirement arrangement distribution: $12,009 (reported on 7.6% of returns)
47118:
$12,009
Indiana:
$18,302
(% of AGI for various income ranges: 59.0% for AGIs below $25k, 155.6% for AGIs $25k-50k, 645.6% for AGIs $75k-100k)
Total itemized deductions: $32,667 (reported on 2.1% of returns)
Here:
$32,667
State:
$35,601
(% of AGI for various income ranges: 576.5% for AGIs $50k-75k)
Charity contributions: $7,367 (reported on 2.1% of returns)
Here:
$7,367
State:
$15,596
(% of AGI for various income ranges: 130.0% for AGIs $50k-75k)
Taxes paid: $5,933 (reported on 2.1% of returns)
47118:
$5,933
State:
$7,542
(% of AGI for various income ranges: 104.7% for AGIs $50k-75k)
Earned income credit: $2,159 (reported on 20.0% of returns)
Here:
$2,159
State:
$2,298
(% of AGI for various income ranges: 90.0% for AGIs below $25k, 80.3% for AGIs $25k-50k)
Percentage of individuals using paid preparers for their 2020 taxes: 95.2%
Here:
95%
State:
94%
(% for various income ranges: 94.8% for AGIs below $25k, 95.1% for AGIs $25k-50k, 95.5% for AGIs $50k-75k, 91.7% for AGIs $75k-100k, 100.0% for AGIs $100k-200k)
Averages for the 2012 tax year for zip code 47118, filed in 2013:
Average Adjusted Gross Income (AGI) in 2012: $35,302 (Individual Income Tax Returns)
Here:
$35,302
State:
$52,932
Salary/wage: $33,138 (reported on 83.3% of returns)
Here:
$33,138
State:
$45,173
(% of AGI for various income ranges: 70.2% for AGIs below $25k, 83.5% for AGIs $25k-50k, 81.3% for AGIs $50k-75k, 85.6% for AGIs $75k-100k, 68.0% for AGIs $100k-200k)
Taxable interest for individuals: $894 (reported on 25.0% of returns)
This zip code:
$894
Indiana:
$1,311
(% of AGI for various income ranges: 1.4% for AGIs below $25k, 0.6% for AGIs $25k-50k, 0.7% for AGIs $50k-75k, 0.1% for AGIs $75k-100k, 0.2% for AGIs $100k-200k)
Ordinary dividends: $807 (reported on 9.7% of returns)
Here:
$807
State:
$4,690
(% of AGI for various income ranges: 0.5% for AGIs below $25k, 0.2% for AGIs $25k-50k, 0.2% for AGIs $50k-75k, 0.4% for AGIs $75k-100k)
Net capital gain/loss in AGI: +$2,075 (reported on 8.3% of returns)
Here:
+$2,075
State:
+$10,406
(% of AGI for various income ranges: 0.3% for AGIs below $25k, 0.4% for AGIs $25k-50k, 0.7% for AGIs $50k-75k, 1.0% for AGIs $75k-100k)
Profit/loss from business: +$9,105 (reported on 15.3% of returns)
Here:
+$9,105
State:
+$11,105
(% of AGI for various income ranges: 10.2% for AGIs below $25k, 3.2% for AGIs $25k-50k, 3.6% for AGIs $50k-75k, 3.5% for AGIs $75k-100k)
Taxable individual retirement arrangement distribution: $10,064 (reported on 7.6% of returns)
47118:
$10,064
Indiana:
$13,841
(% of AGI for various income ranges: 2.3% for AGIs below $25k, 1.6% for AGIs $25k-50k, 5.5% for AGIs $50k-75k)
Total itemized deductions: $16,873 (25% of AGI, reported on 15.3% of returns)
Here:
$16,873
State:
$20,913
Here:
24.6% of AGI
State:
18.2% of AGI
(% of AGI for various income ranges: 3.4% for AGIs below $25k, 5.6% for AGIs $25k-50k, 8.9% for AGIs $50k-75k, 9.9% for AGIs $75k-100k, 9.4% for AGIs $100k-200k)
Charity contributions: $3,146 (reported on 9.0% of returns)
Here:
$3,146
State:
$4,697
(% of AGI for various income ranges: 0.7% for AGIs $25k-50k, 1.5% for AGIs $50k-75k, 1.4% for AGIs $100k-200k)
Taxes paid: $4,386 (reported on 15.3% of returns)
47118:
$4,386
State:
$7,456
(% of AGI for various income ranges: 0.5% for AGIs below $25k, 1.1% for AGIs $25k-50k, 2.2% for AGIs $50k-75k, 2.2% for AGIs $75k-100k, 3.8% for AGIs $100k-200k)
Earned income credit: $2,450 (reported on 23.6% of returns)
Here:
$2,450
State:
$2,265
(% of AGI for various income ranges: 7.7% for AGIs below $25k, 1.3% for AGIs $25k-50k)
Percentage of individuals using paid preparers for their 2012 taxes: 70.8%
Here:
71%
State:
53%
(% for various income ranges: 68.1% for AGIs below $25k, 71.8% for AGIs $25k-50k, 71.4% for AGIs $50k-75k, 75.0% for AGIs $75k-100k, 85.7% for AGIs $100k-200k)
Averages for the 2004 tax year for zip code 47118, filed in 2005:
Average Adjusted Gross Income (AGI) in 2004: $30,496 (Individual Income Tax Returns)
Here:
$30,496
State:
$44,790
Salary/wage: $29,402 (reported on 87.4% of returns)
Here:
$29,402
State:
$39,615
(% of AGI for various income ranges: 100.2% for AGIs below $10k, 77.8% for AGIs $10k-25k, 85.3% for AGIs $25k-50k, 87.8% for AGIs $50k-75k, 91.8% for AGIs $75k-100k, 66.3% for AGIs over 100k)
Taxable interest for individuals: $987 (reported on 36.3% of returns)
This zip code:
$987
Indiana:
$1,535
(% of AGI for various income ranges: 6.6% for AGIs below $10k, 2.5% for AGIs $10k-25k, 0.9% for AGIs $25k-50k, 0.6% for AGIs $50k-75k, 0.7% for AGIs $75k-100k, 0.5% for AGIs over 100k)
Taxable dividends: $604 (reported on 11.0% of returns)
Here:
$604
State:
$2,998
(% of AGI for various income ranges: 0.8% for AGIs below $10k, 0.5% for AGIs $10k-25k, 0.3% for AGIs $25k-50k, 0.1% for AGIs $50k-75k, 0.1% for AGIs $75k-100k, 0.0% for AGIs over 100k)
Net capital gain/loss: +$2,248 (reported on 7.8% of returns)
Here:
+$2,248
State:
+$8,619
(% of AGI for various income ranges: -1.1% for AGIs below $10k, 0.7% for AGIs $10k-25k, 0.6% for AGIs $25k-50k, 0.2% for AGIs $50k-75k, 1.9% for AGIs $75k-100k)
Profit/loss from business: +$6,146 (reported on 17.1% of returns)
Here:
+$6,146
State:
+$10,071
(% of AGI for various income ranges: 14.6% for AGIs below $10k, 7.4% for AGIs $10k-25k, 3.6% for AGIs $25k-50k, 2.3% for AGIs $50k-75k, 0.4% for AGIs $75k-100k)
IRA payment deduction: $2,385 (reported on 1.8% of returns)
47118:
$2,385
Indiana:
$2,840
Total itemized deductions: $14,168 (24% of AGI, reported on 15.7% of returns)
Here:
$14,168
State:
$17,065
Here:
24.1% of AGI
State:
19.5% of AGI
(% of AGI for various income ranges: 5.0% for AGIs $10k-25k, 4.9% for AGIs $25k-50k, 9.1% for AGIs $50k-75k, 12.9% for AGIs $75k-100k, 9.4% for AGIs over 100k)
Charity contributions deductions: $2,565 (4% of AGI, reported on 11.8% of returns)
Here:
$2,565
State:
$3,550
Here:
4.1% of AGI
State:
3.8% of AGI
(% of AGI for various income ranges: 0.3% for AGIs $10k-25k, 0.4% for AGIs $25k-50k, 1.4% for AGIs $50k-75k, 2.4% for AGIs $75k-100k, 1.6% for AGIs over 100k)
Total tax: $3,351 (reported on 71.2% of returns)
47118:
$3,351
State:
$6,914
(% of AGI for various income ranges: 2.9% for AGIs below $10k, 4.2% for AGIs $10k-25k, 6.4% for AGIs $25k-50k, 8.5% for AGIs $50k-75k, 9.7% for AGIs $75k-100k, 15.8% for AGIs over 100k)
Earned income credit: $1,665 (reported on 23.6% of returns)
Here:
$1,665
State:
$1,685
Percentage of individuals using paid preparers for their 2004 taxes: 76.7%
Here:
77%
State:
59%
(% for various income ranges: 75.5% for AGIs below $10k, 76.7% for AGIs $10k-25k, 76.2% for AGIs $25k-50k, 76.1% for AGIs $50k-75k, 82.4% for AGIs $75k-100k, 87.1% for AGIs over 100k)
Household received Food Stamps/SNAP in the past 12 months: 176 Household did not receive Food Stamps/SNAP in the past 12 months: 1,308
Women who had a birth in the past 12 months: 67 (64 now married, 7 unmarried) Women who did not have a birth in the past 12 months: 460 (235 now married, 225 unmarried)
Housing units in zip code 47118 with a mortgage: 439 (70 second mortgage, 50 both second mortgage and home equity loan) Houses without a mortgage: 19
Median monthly owner costs for units with a mortgage: $1,051 Median monthly owner costs for units without a mortgage: $393
Residents with income below the poverty level in 2022:
This zip code:
29.6%
Whole state:
12.6%
Residents with income below 50% of the poverty level in 2022:
This zip code:
11.3%
Whole state:
6.3%
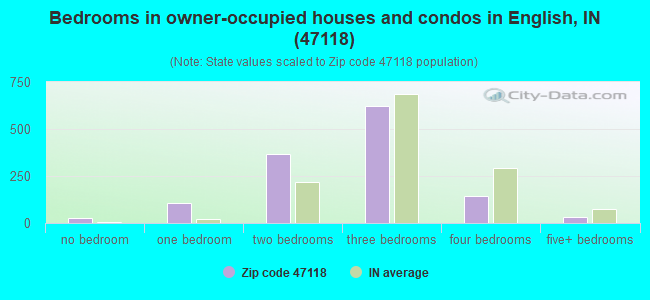
Median number of rooms in houses and condos:
Here:
5.6
State:
6.6
Median number of rooms in apartments:
Here:
3.4
State:
4.3
Notable locations in this zip code not listed on our city pages
Notable locations in zip code 47118: Hemlock Cliffs Recreation Area (A), English Volunteer Fire Department Union Station (B), English Volunteer Fire Department (C). Display/hide their locations on the map
Churches in zip code 47118 include: Bethel Church (A), McDonald Church (B), Old Union Church (C), Patoka Church (D), Pleasant Ridge Church (E), Bogard Church (F), Mathers Chapel (G), Mount Sterling Church (H), Dillman Church (I). Display/hide their locations on the map
Cemeteries: Senn Cemetery (1), Purkhiser Cemetery (2), Keysacker Cemetery (3), Jones Cemetery (4), Jeffries Cemetery (5), Hedden Cemetery (6), Goad Cemetery (7). Display/hide their locations on the map
Lakes and reservoirs: Bluegill Pond (A), Grant Lake (B), Spring Lake (C), Timberlin Lake (D), Whispering Pines Pond (E), English Water Supply Dam (F), Oriole Lake (G), English Reservoir (H). Display/hide their locations on the map
Streams, rivers, and creeks: Russell Branch (A), Jaby Creek (B), Youngs Creek (C), Bird Hollow Creek (D), Brownstown Creek (E), Cane Branch (F), Dog Creek (G), Dumplin Branch (H), Otter Creek (I). Display/hide their locations on the map
In group quarters: 17 (-1 institutionalized population)
Size of family households: 510 2-persons, 158 3-persons, 92 4-persons, 53 5-persons, 53 6-persons, 16 7-or-more-persons
Size of nonfamily households: 575 1-person, 28 2-persons
842 married couples with children.
65 single-parent households (40 men, 25 women).
97.1% of residents of 47118 zip code speak English at home.
1.1% of residents speak Spanish at home (77% very well, 23% not well).
1.7% of residents speak other Indo-European language at home (71% very well, 29% not at all).
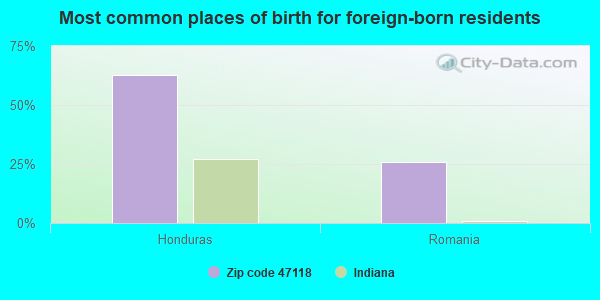
Foreign born population: 35 (1.0%) (69.8% of them are naturalized citizens)
This zip code:
1.0%
Whole state:
6.1%
63%Honduras
26%Romania
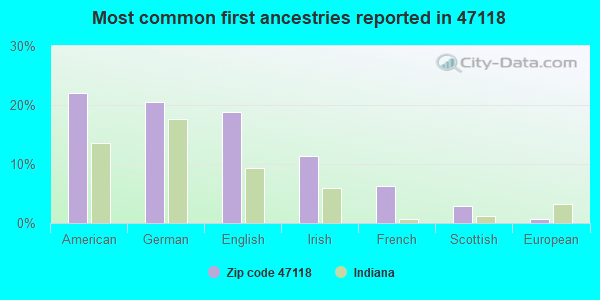
22%American
21%German
19%English
11%Irish
6%French
3%Scottish
1%European
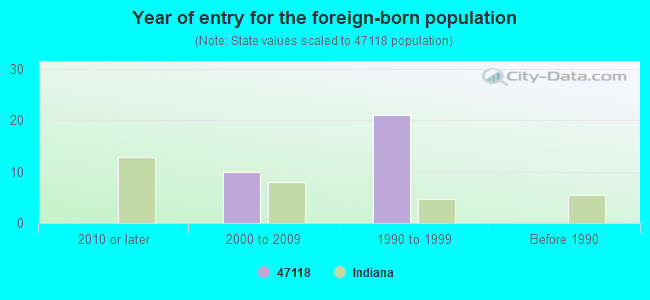
Year of entry for the foreign-born population
02010 or later
102000 to 2009
211990 to 1999
0Before 1990
Facilities with environmental interests located in this zip code:
MULZER CRUSHED STONE (2785 E TEMPLE RD in ENGLISH, IN)
AIR MINOR (AIRS/AFS) STATE MASTER (Indiana facility tracking) - ACES-OP-02500004, AIR PROGRAM, UST-5849, UNDERGROUND STORAGE TANK PROGRAM CRITERIA AND HAZARDOUS AIR POLLUTANT INVENTORY (Inventory of air pollution sources) Business SIC classification: CRUSHED AND BROKEN LIMESTONE; ASPHALT PAVING MIXTURES AND BLOCKS Business NAICS classification: ASPHALT PAVING MIXTURE AND BLOCK MANUFACTURING. Alternative names: GOHMANN ASPHALT AND CONSTRUCTION INC
Housing units lacking complete plumbing facilities: 5.1% Housing units lacking complete kitchen facilities: 9.3%
37.7%Electricity
25.7%Bottled, tank, or LP gas
21.1%Wood
12.4%Utility gas
3.3%Fuel oil, kerosene, etc.
Population in 1990: 3,424.
Place of birth for U.S.-born residents:
This state: 2,505
Northeast: 21
Midwest: 235
South: 751
West: 107
69% of the 47118 zip code residents lived in the same house 5 years ago. Out of people who lived in different houses, 45% lived in this county. Out of people who lived in different counties, 50% lived in Indiana.
97% of the 47118 zip code residents lived in the same house 1 year ago. Out of people who lived in different houses, 33% moved from this county. Out of people who lived in different houses, 19% moved from different county within same state. Out of people who lived in different houses, 66% moved from different state.
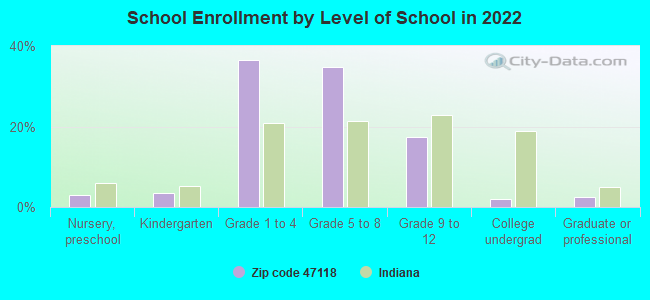
Private vs. public school enrollment:
Students in private schools in grades 1 to 8 (elementary and middle school): 72
Here:
14.4%
Indiana:
14.9%
Students in private schools in grades 9 to 12 (high school): 75
Here:
58.4%
Indiana:
11.4%
Students in private undergraduate colleges:
Here:
0.0%
Indiana:
22.3%
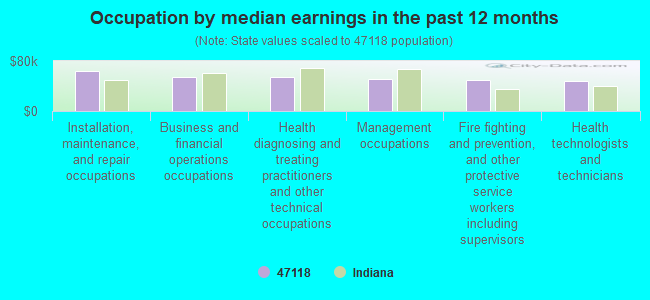
Occupation by median earnings in the past 12 months ($)
63,342Installation, maintenance, and repair occupations
55,048Business and financial operations occupations
54,887Health diagnosing and treating practitioners and other technical occupations
50,980Management occupations
50,339Fire fighting and prevention, and other protective service workers including supervisors
47,497Health technologists and technicians
Top industries in this zip code by the number of employees in 2005:
Mining: Crushed and Broken Limestone Mining and Quarrying (20-49 employees: 1 establishment)
Health Care and Social Assistance: Other Individual and Family Services (10-19: 1)
Finance and Insurance: Commercial Banking (5-9: 1, 1-4: 1)
Other Services (except Public Administration): Funeral Homes and Funeral Services (5-9: 1)
People in group quarters in 2000:
14 people in local jails and other confinement facilities (including police lockups)
Fatal accident statistics in 2014:
Fatal accident count: 1
Vehicles involved in fatal accidents: 1
Fatal accidents caused by drunken drivers: 0
Fatalities: 1
Persons involved in fatal accidents: 2
Pedestrians involved in fatal accidents: 0
Fatal accident statistics in 2012:
Fatal accident count: 1
Vehicles involved in fatal accidents: 1
Fatal accidents caused by drunken drivers: 0
Fatalities: 1
Persons involved in fatal accidents: 1
Pedestrians involved in fatal accidents: 0
2002 - 2018 National Fire Incident Reporting System (NFIRS) incidents
According to the data from the years 2002 - 2018 the average number of fire incidents per year is 16. The highest number of reported fire incidents - 34 took place in 2005, and the least - 1 in 2014. The data has a decreasing trend.
When looking into fire subcategories, the most reports belonged to: Structure Fires (37.5%), and Outside Fires (36.4%).
Fire incident types reported to NFIRS in Zip Code 47118

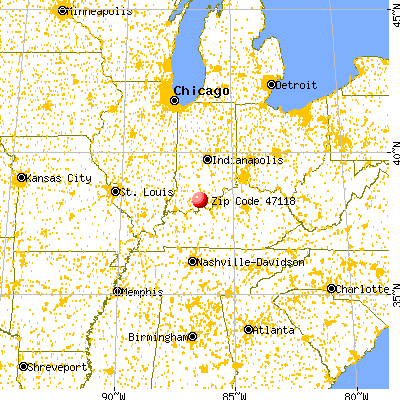


 Nearest zip codes: 47123, 47175, 47116, 47140, 47514, 47137.


 According to the data from the years 2002 - 2018 the average number of fire incidents per year is 16. The highest number of reported fire incidents - 34 took place in 2005, and the least - 1 in 2014. The data has a decreasing trend.
 When looking into fire subcategories, the most reports belonged to: Structure Fires (37.5%), and Outside Fires (36.4%).