Estimated zip code population in 2022: 2,384 Zip code population in 2010: 2,669 Zip code population in 2000: 2,843
Houses and condos: 1,269 Renter-occupied apartments: 309
% of renters here:
29%
State:
29%
March 2022 cost of living index in zip code 47140: 84.0 (less than average, U.S. average is 100)
Land area: 41.4 sq. mi. Water area: 0.0 sq. mi.
Population density: 58 people per square mile
(very low).
OSM Map
General Map
Google Map
MSN Map
OSM Map
General Map
Google Map
MSN Map
OSM Map
General Map
Google Map
MSN Map
OSM Map
General Map
Google Map
MSN Map
Please wait while loading the map...
Real estate property taxes paid for housing units in 2022:
This zip code:
0.6% ($773)
Indiana:
0.7% ($1,467)
Median real estate property taxes paid for housing units with mortgages in 2022: $918 (0.7%) Median real estate property taxes paid for housing units with no mortgage in 2022: $710 (0.7%)
Business Search- 14 Million verified businesses
Males: 1,172
(49.2%)
Females: 1,212
(50.8%)
For population 25 years and over in 47140:
High school or higher: 89.0%
Bachelor's degree or higher: 9.1%
Graduate or professional degree: 3.2%
Unemployed: 2.6%
Mean travel time to work (commute): 29.8 minutes
For population 15 years and over in 47140:
Never married: 22.6%
Now married: 56.0%
Separated: 1.9%
Widowed: 7.2%
Divorced: 12.2%
Zip code 47140 compared to state average:
Median house value below state average.
Black race population percentage significantly below state average.
Hispanic race population percentage significantly below state average.
Number of college students below state average.
Percentage of population with a bachelor's degree or higher significantly below state average.
Estimated median house/condo value in 2022: $121,628
47140:
$121,628
Indiana:
$208,700
Median resident age:
This zip code:
40.7 years
Indiana median age:
38.2 years
Average household size:
This zip code:
2.2 people
Indiana:
2.4 people
Averages for the 2020 tax year for zip code 47140, filed in 2021:
Average Adjusted Gross Income (AGI) in 2020: $43,477 (Individual Income Tax Returns)
Here:
$43,477
State:
$64,978
Salary/wage: $41,011 (reported on 82.5% of returns)
Here:
$41,011
State:
$55,245
(% of AGI for various income ranges: 1075.7% for AGIs below $25k, 3433.4% for AGIs $25k-50k, 6466.7% for AGIs $50k-75k, 9120.0% for AGIs $75k-100k, 15918.8% for AGIs $100k-200k)
Taxable interest for individuals: $441 (reported on 18.3% of returns)
This zip code:
$441
Indiana:
$1,351
(% of AGI for various income ranges: 9.7% for AGIs below $25k, 3.1% for AGIs $25k-50k, 4.2% for AGIs $50k-75k, 44.3% for AGIs $75k-100k, 22.5% for AGIs $100k-200k)
Ordinary dividends: $1,060 (reported on 8.3% of returns)
Here:
$1,060
State:
$5,827
(% of AGI for various income ranges: 5.4% for AGIs below $25k, 9.7% for AGIs $25k-50k, 33.3% for AGIs $50k-75k, 23.8% for AGIs $100k-200k)
Net capital gain/loss in AGI: +$3,350 (reported on 6.7% of returns)
Here:
+$3,350
State:
+$17,730
(% of AGI for various income ranges: 19.3% for AGIs $25k-50k, 302.9% for AGIs $75k-100k)
Profit/loss from business: +$6,138 (reported on 10.8% of returns)
Here:
+$6,138
State:
+$12,144
(% of AGI for various income ranges: 83.1% for AGIs below $25k, 154.8% for AGIs $25k-50k, 82.9% for AGIs $75k-100k)
Taxable individual retirement arrangement distribution: $13,250 (reported on 6.7% of returns)
47140:
$13,250
Indiana:
$18,302
(% of AGI for various income ranges: 59.7% for AGIs below $25k, 71.4% for AGIs $25k-50k, 536.7% for AGIs $50k-75k)
Earned income credit: $2,500 (reported on 20.0% of returns)
Here:
$2,500
State:
$2,298
(% of AGI for various income ranges: 107.7% for AGIs below $25k, 76.9% for AGIs $25k-50k)
Percentage of individuals using paid preparers for their 2020 taxes: 95.8%
Here:
96%
State:
94%
(% for various income ranges: 93.9% for AGIs below $25k, 100.0% for AGIs $25k-50k, 93.3% for AGIs $50k-75k, 90.0% for AGIs $75k-100k, 100.0% for AGIs $100k-200k)
Averages for the 2012 tax year for zip code 47140, filed in 2013:
Average Adjusted Gross Income (AGI) in 2012: $34,533 (Individual Income Tax Returns)
Here:
$34,533
State:
$52,932
Salary/wage: $33,527 (reported on 83.8% of returns)
Here:
$33,527
State:
$45,173
(% of AGI for various income ranges: 71.6% for AGIs below $25k, 81.1% for AGIs $25k-50k, 83.8% for AGIs $50k-75k, 89.5% for AGIs $75k-100k, 79.0% for AGIs $100k-200k)
Taxable interest for individuals: $543 (reported on 25.6% of returns)
This zip code:
$543
Indiana:
$1,311
(% of AGI for various income ranges: 1.1% for AGIs below $25k, 0.6% for AGIs $25k-50k, 0.1% for AGIs $50k-75k, 0.1% for AGIs $100k-200k)
Ordinary dividends: $1,100 (reported on 10.3% of returns)
Here:
$1,100
State:
$4,690
(% of AGI for various income ranges: 0.8% for AGIs below $25k, 0.5% for AGIs $25k-50k, 0.3% for AGIs $75k-100k)
Net capital gain/loss in AGI: +$311 (reported on 7.7% of returns)
Here:
+$311
State:
+$10,406
(% of AGI for various income ranges: 0.2% for AGIs below $25k, 0.1% for AGIs $75k-100k)
Profit/loss from business: +$5,517 (reported on 15.4% of returns)
Here:
+$5,517
State:
+$11,105
(% of AGI for various income ranges: 6.8% for AGIs below $25k, 3.6% for AGIs $25k-50k, 1.3% for AGIs $50k-75k, 0.7% for AGIs $75k-100k)
Taxable individual retirement arrangement distribution: $6,640 (reported on 8.5% of returns)
47140:
$6,640
Indiana:
$13,841
(% of AGI for various income ranges: 3.0% for AGIs below $25k, 1.4% for AGIs $25k-50k, 3.5% for AGIs $50k-75k)
Total itemized deductions: $18,233 (27% of AGI, reported on 15.4% of returns)
Here:
$18,233
State:
$20,913
Here:
26.8% of AGI
State:
18.2% of AGI
(% of AGI for various income ranges: 5.4% for AGIs below $25k, 5.3% for AGIs $25k-50k, 9.1% for AGIs $50k-75k, 9.6% for AGIs $75k-100k, 12.4% for AGIs $100k-200k)
Charity contributions: $3,625 (reported on 10.3% of returns)
Here:
$3,625
State:
$4,697
(% of AGI for various income ranges: 1.1% for AGIs $25k-50k, 0.7% for AGIs $50k-75k, 1.3% for AGIs $75k-100k, 2.3% for AGIs $100k-200k)
Taxes paid: $4,811 (reported on 15.4% of returns)
47140:
$4,811
State:
$7,456
(% of AGI for various income ranges: 0.6% for AGIs below $25k, 1.1% for AGIs $25k-50k, 1.9% for AGIs $50k-75k, 3.3% for AGIs $75k-100k, 4.4% for AGIs $100k-200k)
Earned income credit: $2,041 (reported on 27.4% of returns)
Here:
$2,041
State:
$2,265
(% of AGI for various income ranges: 7.7% for AGIs below $25k, 1.6% for AGIs $25k-50k)
Percentage of individuals using paid preparers for their 2012 taxes: 67.5%
Here:
68%
State:
53%
(% for various income ranges: 67.3% for AGIs below $25k, 66.7% for AGIs $25k-50k, 73.3% for AGIs $50k-75k, 62.5% for AGIs $75k-100k, 66.7% for AGIs $100k-200k)
Averages for the 2004 tax year for zip code 47140, filed in 2005:
Average Adjusted Gross Income (AGI) in 2004: $30,667 (Individual Income Tax Returns)
Here:
$30,667
State:
$44,790
Salary/wage: $30,168 (reported on 85.9% of returns)
Here:
$30,168
State:
$39,615
(% of AGI for various income ranges: 94.6% for AGIs below $10k, 78.0% for AGIs $10k-25k, 87.5% for AGIs $25k-50k, 87.3% for AGIs $50k-75k, 94.2% for AGIs $75k-100k, 62.5% for AGIs over 100k)
Taxable interest for individuals: $1,036 (reported on 37.1% of returns)
This zip code:
$1,036
Indiana:
$1,535
(% of AGI for various income ranges: 4.2% for AGIs below $10k, 2.9% for AGIs $10k-25k, 1.3% for AGIs $25k-50k, 0.6% for AGIs $50k-75k, 0.2% for AGIs $75k-100k, 0.5% for AGIs over 100k)
Taxable dividends: $517 (reported on 12.0% of returns)
Here:
$517
State:
$2,998
(% of AGI for various income ranges: 0.5% for AGIs below $10k, 0.5% for AGIs $10k-25k, 0.2% for AGIs $25k-50k, 0.1% for AGIs $50k-75k, 0.3% for AGIs $75k-100k)
Net capital gain/loss: +$3,411 (reported on 9.3% of returns)
Here:
+$3,411
State:
+$8,619
(% of AGI for various income ranges: 0.0% for AGIs below $10k, 0.8% for AGIs $10k-25k, 0.7% for AGIs $25k-50k, 2.2% for AGIs $50k-75k, 0.8% for AGIs $75k-100k)
Profit/loss from business: +$4,715 (reported on 16.0% of returns)
Here:
+$4,715
State:
+$10,071
(% of AGI for various income ranges: 14.7% for AGIs below $10k, 5.5% for AGIs $10k-25k, 3.6% for AGIs $25k-50k, -0.2% for AGIs $50k-75k)
IRA payment deduction: $1,571 (reported on 1.2% of returns)
47140:
$1,571
Indiana:
$2,840
Total itemized deductions: $14,767 (26% of AGI, reported on 18.8% of returns)
Here:
$14,767
State:
$17,065
Here:
25.6% of AGI
State:
19.5% of AGI
(% of AGI for various income ranges: 7.3% for AGIs $10k-25k, 8.5% for AGIs $25k-50k, 10.0% for AGIs $50k-75k, 11.1% for AGIs $75k-100k, 11.5% for AGIs over 100k)
Charity contributions deductions: $2,799 (5% of AGI, reported on 15.6% of returns)
Here:
$2,799
State:
$3,550
Here:
4.7% of AGI
State:
3.8% of AGI
(% of AGI for various income ranges: 0.8% for AGIs $10k-25k, 1.1% for AGIs $25k-50k, 1.6% for AGIs $50k-75k, 2.1% for AGIs $75k-100k, 2.6% for AGIs over 100k)
Total tax: $3,115 (reported on 68.6% of returns)
47140:
$3,115
State:
$6,914
(% of AGI for various income ranges: 4.5% for AGIs below $10k, 3.6% for AGIs $10k-25k, 6.2% for AGIs $25k-50k, 8.0% for AGIs $50k-75k, 9.3% for AGIs $75k-100k, 10.7% for AGIs over 100k)
Earned income credit: $1,691 (reported on 21.4% of returns)
Here:
$1,691
State:
$1,685
Percentage of individuals using paid preparers for their 2004 taxes: 74.3%
Here:
74%
State:
59%
(% for various income ranges: 68.4% for AGIs below $10k, 74.7% for AGIs $10k-25k, 76.0% for AGIs $25k-50k, 78.8% for AGIs $50k-75k, 76.5% for AGIs $75k-100k, 75.0% for AGIs over 100k)
Likely homosexual households (counted as self-reported same-sex unmarried-partner households)
Lesbian couples: 0.1% of all households
Gay men: 0.0% of all households
Household received Food Stamps/SNAP in the past 12 months: 147 Household did not receive Food Stamps/SNAP in the past 12 months: 914
Women who had a birth in the past 12 months: 25 (13 now married, 10 unmarried) Women who did not have a birth in the past 12 months: 553 (276 now married, 278 unmarried)
Housing units in zip code 47140 with a mortgage: 383 (24 second mortgage, 15 both second mortgage and home equity loan) Houses without a mortgage: 14
Median monthly owner costs for units with a mortgage: $1,270 Median monthly owner costs for units without a mortgage: $439
Residents with income below the poverty level in 2022:
This zip code:
12.9%
Whole state:
12.6%
Residents with income below 50% of the poverty level in 2022:
This zip code:
7.2%
Whole state:
6.3%
Median number of rooms in houses and condos:
Here:
5.6
State:
6.6
Median number of rooms in apartments:
Here:
4.1
State:
4.3
Notable locations in this zip code not listed on our city pages
Cemeteries: White Cemetery (1), Marengo Cemetery Old Section (2), Marengo Cemetery New Section (3), Marengo Cemetery (4). Display/hide their locations on the map
In group quarters: 21 (-1 institutionalized population)
Size of family households: 381 2-persons, 93 3-persons, 90 4-persons, 80 5-persons, 7 7-or-more-persons
Size of nonfamily households: 326 1-person, 82 2-persons
414 married couples with children.
66 single-parent households (8 men, 58 women).
98.5% of residents of 47140 zip code speak English at home.
0.7% of residents speak other Indo-European language at home (69% very well, 19% well, 12% not well).
Foreign born population: 101 (4.3%) (77.8% of them are naturalized citizens)
This zip code:
4.3%
Whole state:
6.1%
55%Japan
10%Bhutan
8%France
4%Bolivia
1%Sweden
24%English
14%American
14%German
9%Irish
3%Scottish
2%Italian
1%European
Year of entry for the foreign-born population
02010 or later
282000 to 2009
21990 to 1999
74Before 1990
Facilities with environmental interests located in this zip code:
CRAWFORD COUNTY JR SR HIGH SCH (1130 S SR 66 in MARENGO, IN)
STATE MASTER (Indiana facility tracking) - ACES-CP-02500011, AIR PROGRAM, ACES-OP-02500011, COMPLIANCE ACTIVITY (Tracking inspections of insecticide, fungicide, and rodenticide, and toxic substances) National Pollutant Discharge Elimination System NON-MAJOR (Tracking pollutant discharge elimination systems) - permit Business SIC classification: ELEMENTARY AND SECONDARY SCHOOLS Organizations: TROY WHEELER 14975 010199 (CONTACT/OPERATOR)
, CRAWFORD COUNTY COMM SCH COR (CONTACT/OWNER)
Alternative names: CRAWFORD CO COMMUNITY SCH CORP, CRAWFORD CO. JR/SR HIGH SCH00L, CRAWFORD COUNTY JR-SR HS
MARENGO MUNICIPAL STP (INDUSTRIAL PARK RD & SR 64 in MARENGO, IN)
STATE MASTER (Indiana facility tracking) - CRTK-7136, EPCRA National Pollutant Discharge Elimination System NON-MAJOR (Tracking pollutant discharge elimination systems) - permit Business SIC classification: SEWERAGE SYSTEMS Organizations: JAMES PEVLOR (CONTACT/OPERATOR)
, TOWN COUNCIL PRESIDENT (CONTACT/OWNER)
Alternative names: MARENGO MUNICIPAL WWTP
MARENGO ELEMENTARY SCHOOL (177 S 2ND ST in MARENGO, IN)
(National Center for Education Statistics) - STATE ID-1061 Organizations: CRAWFORD CO COM SCHOOL CORP (SCHOOL DISTRICT)
MATRONIX CORP (MARENGO INDUSTRIAL PK in MARENGO, IN)
STATE MASTER (Indiana facility tracking) (Resource Conservation and Recovery Act (tracking hazardous waste)) Organizations: OLD CAPITAL BANK (CONTACT/OWNER)
Housing units lacking complete plumbing facilities: 6.4% Housing units lacking complete kitchen facilities: 5.8%
51.2%Electricity
17.4%Bottled, tank, or LP gas
16.6%Utility gas
14.3%Wood
0.7%No fuel used
Population in 1990: 1,539. Population change in the 1990s: +1,304 (+84.7%).
Place of birth for U.S.-born residents:
This state: 1,769
Northeast: 6
Midwest: 71
South: 375
West: 31
60% of the 47140 zip code residents lived in the same house 5 years ago. Out of people who lived in different houses, 52% lived in this county. Out of people who lived in different counties, 50% lived in Indiana.
89% of the 47140 zip code residents lived in the same house 1 year ago. Out of people who lived in different houses, 41% moved from this county. Out of people who lived in different houses, 41% moved from different county within same state. Out of people who lived in different houses, 18% moved from different state.
Private vs. public school enrollment:
Students in private schools in grades 1 to 8 (elementary and middle school): 34
Here:
11.4%
Indiana:
14.9%
Students in private schools in grades 9 to 12 (high school):
Here:
0.0%
Indiana:
11.4%
Students in private undergraduate colleges: 21
Here:
51.5%
Indiana:
22.3%
Occupation by median earnings in the past 12 months ($)
72,430Management occupations
54,643Construction and extraction occupations
54,071Production occupations
51,602Transportation occupations
39,437Installation, maintenance, and repair occupations
35,792Building and grounds cleaning and maintenance occupations
Companies with federal contracts located in this zip code:
MARENGO LLC (300 UNION in MARENGO, IN; small business) : $1,366,134 in 10 contractsfrom 2003 to 2004
Contracts for Lease or Rental of Facilities -- Food or Grain Storage Buildings, Maintenance, Repair or Alteration of Real Property -- Food or Grain Storage Buildings by Defense Logistics Agency Signed by year:2000: $0; 2001: $0; 2002: $0; 2003: $250,686; 2004: $1,115,448; 2005: $0; 2006: $0.
Biggest contracts:
$655,829 with Defense Logistics Agency for Lease or Rental of Facilities -- Food or Grain Storage Buildings. Signed on 2004-10-01. Completion date: 2005-09-30.
$308,358, same as above.Signed on 2004-10-01. Completion date: 2005-09-30.
$163,280 with Defense Logistics Agency for Maintenance, Repair or Alteration of Real Property -- Food or Grain Storage Buildings. Signed on 2003-10-01. Completion date: 2004-09-30.
$103,256 with Defense Logistics Agency for Lease or Rental of Facilities -- Food or Grain Storage Buildings. Signed on 2004-03-16. Completion date: 2004-09-30.
Top industries in this zip code by the number of employees in 2005:
Construction: Power and Communication Line and Related Structures Construction (50-99 employees: 1 establishment)
Accommodation and Food Services: Full-Service Restaurants (5-9: 3, 1-4: 1)
Health Care and Social Assistance: Child and Youth Services (10-19: 1)
Health Care and Social Assistance: All Other Outpatient Care Centers (10-19: 1)
Finance and Insurance: Commercial Banking (5-9: 2)
Construction: New Single-Family Housing Construction (except Operative Builders) (5-9: 1, 1-4: 1)
Health Care and Social Assistance: Child Day Care Services (5-9: 1, 1-4: 1)
People in group quarters in 2010:
5 people in group homes intended for adults
Fatal accident statistics in 2013:
Fatal accident count: 2
Vehicles involved in fatal accidents: 3
Fatal accidents caused by drunken drivers: 2
Fatalities: 2
Persons involved in fatal accidents: 4
Pedestrians involved in fatal accidents: 0
Fatal accident statistics in 2010:
Fatal accident count: 1
Vehicles involved in fatal accidents: 1
Fatal accidents caused by drunken drivers: 0
Fatalities: 1
Persons involved in fatal accidents: 2
Pedestrians involved in fatal accidents: 0
2002 - 2018 National Fire Incident Reporting System (NFIRS) incidents
According to the data from the years 2002 - 2018 the average number of fires per year is 16. The highest number of fire incidents - 30 took place in 2006, and the least - 3 in 2010. The data has a rising trend.
When looking into fire subcategories, the most reports belonged to: Structure Fires (45.8%), and Outside Fires (37.2%).
Fire incident types reported to NFIRS in Zip Code 47140

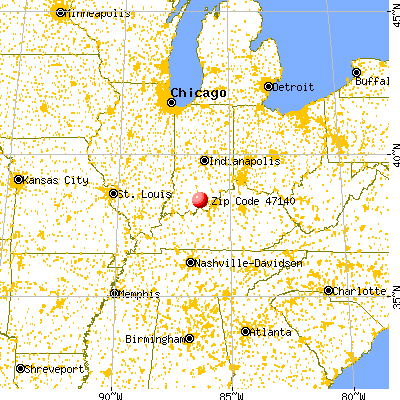


 Nearest zip codes: 47145, 47125, 47118, 47454, 47123, 47115.


 According to the data from the years 2002 - 2018 the average number of fires per year is 16. The highest number of fire incidents - 30 took place in 2006, and the least - 3 in 2010. The data has a rising trend.
 When looking into fire subcategories, the most reports belonged to: Structure Fires (45.8%), and Outside Fires (37.2%).