Estimated zip code population in 2022: 4,174 Zip code population in 2010: 4,250 Zip code population in 2000: 3,482
Houses and condos: 1,725 Renter-occupied apartments: 182
% of renters here:
12%
State:
29%
March 2022 cost of living index in zip code 47126: 86.1 (less than average, U.S. average is 100)
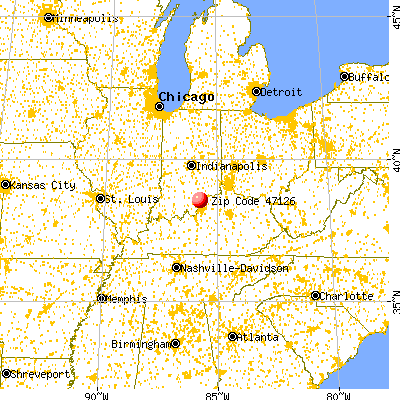
Land area: 35.0 sq. mi. Water area: 0.2 sq. mi.
Population density: 119 people per square mile
(very low).
OSM Map
General Map
Google Map
MSN Map
OSM Map
General Map
Google Map
MSN Map
OSM Map
General Map
Google Map
MSN Map
OSM Map
General Map
Google Map
MSN Map
Please wait while loading the map...
Real estate property taxes paid for housing units in 2022:
This zip code:
0.5% ($1,458)
Indiana:
0.7% ($1,467)
Median real estate property taxes paid for housing units with mortgages in 2022: $1,565 (0.5%) Median real estate property taxes paid for housing units with no mortgage in 2022: $1,236 (0.5%)
Business Search- 14 Million verified businesses
Males: 2,212
(53.0%)
Females: 1,961
(47.0%)
For population 25 years and over in 47126:
High school or higher: 88.5%
Bachelor's degree or higher: 25.0%
Graduate or professional degree: 11.0%
Unemployed: 2.2%
Mean travel time to work (commute): 30.4 minutes
For population 15 years and over in 47126:
Never married: 23.1%
Now married: 59.7%
Separated: 1.5%
Widowed: 6.6%
Divorced: 9.1%
Zip code 47126 compared to state average:
Black race population percentage significantly below state average.
Hispanic race population percentage significantly below state average.
Foreign-born population percentage significantly below state average.
Renting percentage significantly below state average.
House age significantly below state average.
Number of college students significantly below state average.
Estimated median house/condo value in 2022: $273,720
47126:
$273,720
Indiana:
$208,700
Median resident age:
This zip code:
38.8 years
Indiana median age:
38.2 years
Average household size:
This zip code:
2.6 people
Indiana:
2.4 people
Averages for the 2020 tax year for zip code 47126, filed in 2021:
Average Adjusted Gross Income (AGI) in 2020: $69,897 (Individual Income Tax Returns)
Here:
$69,897
State:
$64,978
Salary/wage: $62,808 (reported on 84.8% of returns)
Here:
$62,808
State:
$55,245
(% of AGI for various income ranges: 1020.4% for AGIs below $25k, 3769.3% for AGIs $25k-50k, 6557.6% for AGIs $50k-75k, 9571.1% for AGIs $75k-100k, 16955.9% for AGIs $100k-200k, 68846.7% for AGIs over 200k)
Taxable interest for individuals: $986 (reported on 27.7% of returns)
This zip code:
$986
Indiana:
$1,351
(% of AGI for various income ranges: 15.1% for AGIs below $25k, 11.4% for AGIs $25k-50k, 30.3% for AGIs $50k-75k, 32.2% for AGIs $75k-100k, 36.3% for AGIs $100k-200k, 903.3% for AGIs over 200k)
Ordinary dividends: $2,394 (reported on 15.6% of returns)
Here:
$2,394
State:
$5,827
(% of AGI for various income ranges: 15.6% for AGIs below $25k, 23.1% for AGIs $25k-50k, 51.7% for AGIs $50k-75k, 56.1% for AGIs $75k-100k, 97.4% for AGIs $100k-200k, 603.3% for AGIs over 200k)
Net capital gain/loss in AGI: +$8,494 (reported on 13.9% of returns)
Here:
+$8,494
State:
+$17,730
(% of AGI for various income ranges: 0.9% for AGIs below $25k, 27.6% for AGIs $25k-50k, 63.4% for AGIs $50k-75k, 96.1% for AGIs $75k-100k, 291.1% for AGIs $100k-200k, 4850.0% for AGIs over 200k)
Profit/loss from business: +$9,490 (reported on 13.4% of returns)
Here:
+$9,490
State:
+$12,144
(% of AGI for various income ranges: 90.2% for AGIs below $25k, 59.5% for AGIs $25k-50k, 96.9% for AGIs $50k-75k, 47.8% for AGIs $75k-100k, 477.4% for AGIs $100k-200k, 2100.0% for AGIs over 200k)
Taxable individual retirement arrangement distribution: $14,980 (reported on 10.8% of returns)
47126:
$14,980
Indiana:
$18,302
(% of AGI for various income ranges: 82.7% for AGIs below $25k, 116.4% for AGIs $25k-50k, 202.4% for AGIs $50k-75k, 291.1% for AGIs $75k-100k, 656.7% for AGIs $100k-200k)
Total itemized deductions: $31,886 (reported on 6.1% of returns)
Here:
$31,886
State:
$35,601
(% of AGI for various income ranges: 192.6% for AGIs $25k-50k, 265.0% for AGIs $75k-100k, 603.3% for AGIs $100k-200k, 5163.3% for AGIs over 200k)
Charity contributions: $10,800 (reported on 5.6% of returns)
Here:
$10,800
State:
$15,596
(% of AGI for various income ranges: 109.0% for AGIs $50k-75k, 157.4% for AGIs $100k-200k, 2210.0% for AGIs over 200k)
Taxes paid: $7,950 (reported on 6.1% of returns)
47126:
$7,950
State:
$7,542
(% of AGI for various income ranges: 38.6% for AGIs $25k-50k, 70.6% for AGIs $75k-100k, 168.5% for AGIs $100k-200k, 1230.0% for AGIs over 200k)
Earned income credit: $2,086 (reported on 12.1% of returns)
Here:
$2,086
State:
$2,298
(% of AGI for various income ranges: 69.8% for AGIs below $25k, 64.3% for AGIs $25k-50k)
Percentage of individuals using paid preparers for their 2020 taxes: 94.8%
Here:
95%
State:
94%
(% for various income ranges: 93.5% for AGIs below $25k, 94.4% for AGIs $25k-50k, 94.9% for AGIs $50k-75k, 96.0% for AGIs $75k-100k, 95.2% for AGIs $100k-200k, 100.0% for AGIs over 200k)
Averages for the 2012 tax year for zip code 47126, filed in 2013:
Average Adjusted Gross Income (AGI) in 2012: $48,929 (Individual Income Tax Returns)
Here:
$48,929
State:
$52,932
Salary/wage: $43,549 (reported on 86.2% of returns)
Here:
$43,549
State:
$45,173
(% of AGI for various income ranges: 73.0% for AGIs below $25k, 80.2% for AGIs $25k-50k, 76.2% for AGIs $50k-75k, 79.8% for AGIs $75k-100k, 82.8% for AGIs $100k-200k, 56.9% for AGIs over 200k)
Taxable interest for individuals: $739 (reported on 31.2% of returns)
This zip code:
$739
Indiana:
$1,311
(% of AGI for various income ranges: 1.3% for AGIs below $25k, 0.5% for AGIs $25k-50k, 0.6% for AGIs $50k-75k, 0.4% for AGIs $75k-100k, 0.2% for AGIs $100k-200k, 0.3% for AGIs over 200k)
Ordinary dividends: $1,412 (reported on 13.2% of returns)
Here:
$1,412
State:
$4,690
(% of AGI for various income ranges: 0.5% for AGIs below $25k, 0.4% for AGIs $25k-50k, 0.4% for AGIs $50k-75k, 0.2% for AGIs $75k-100k, 0.6% for AGIs $100k-200k)
Net capital gain/loss in AGI: +$7,367 (reported on 7.9% of returns)
Here:
+$7,367
State:
+$10,406
(% of AGI for various income ranges: 1.5% for AGIs $75k-100k, 3.9% for AGIs $100k-200k)
Profit/loss from business: +$7,104 (reported on 14.8% of returns)
Here:
+$7,104
State:
+$11,105
(% of AGI for various income ranges: 6.7% for AGIs below $25k, 2.6% for AGIs $25k-50k, 2.2% for AGIs $50k-75k, 0.9% for AGIs $75k-100k, 1.8% for AGIs $100k-200k)
Taxable individual retirement arrangement distribution: $13,038 (reported on 8.5% of returns)
47126:
$13,038
Indiana:
$13,841
(% of AGI for various income ranges: 1.6% for AGIs below $25k, 2.2% for AGIs $25k-50k, 3.8% for AGIs $50k-75k, 5.2% for AGIs $75k-100k)
Total itemized deductions: $19,841 (22% of AGI, reported on 28.6% of returns)
Here:
$19,841
State:
$20,913
Here:
22.3% of AGI
State:
18.2% of AGI
(% of AGI for various income ranges: 6.8% for AGIs below $25k, 10.9% for AGIs $25k-50k, 11.3% for AGIs $50k-75k, 12.9% for AGIs $75k-100k, 13.6% for AGIs $100k-200k, 11.3% for AGIs over 200k)
Charity contributions: $3,434 (reported on 21.7% of returns)
Here:
$3,434
State:
$4,697
(% of AGI for various income ranges: 0.4% for AGIs below $25k, 1.0% for AGIs $25k-50k, 1.4% for AGIs $50k-75k, 2.0% for AGIs $75k-100k, 1.8% for AGIs $100k-200k, 2.4% for AGIs over 200k)
Taxes paid: $6,380 (reported on 28.6% of returns)
47126:
$6,380
State:
$7,456
(% of AGI for various income ranges: 0.9% for AGIs below $25k, 2.3% for AGIs $25k-50k, 2.6% for AGIs $50k-75k, 4.4% for AGIs $75k-100k, 5.5% for AGIs $100k-200k, 6.0% for AGIs over 200k)
Earned income credit: $2,082 (reported on 18.0% of returns)
Here:
$2,082
State:
$2,265
(% of AGI for various income ranges: 6.1% for AGIs below $25k, 1.0% for AGIs $25k-50k)
Percentage of individuals using paid preparers for their 2012 taxes: 57.7%
Here:
58%
State:
53%
(% for various income ranges: 52.1% for AGIs below $25k, 56.9% for AGIs $25k-50k, 65.5% for AGIs $50k-75k, 63.2% for AGIs $75k-100k, 56.2% for AGIs $100k-200k, 100.0% for AGIs over 200k)
Averages for the 2004 tax year for zip code 47126, filed in 2005:
Average Adjusted Gross Income (AGI) in 2004: $39,384 (Individual Income Tax Returns)
Here:
$39,384
State:
$44,790
Salary/wage: $36,416 (reported on 88.2% of returns)
Here:
$36,416
State:
$39,615
(% of AGI for various income ranges: 92.3% for AGIs below $10k, 79.7% for AGIs $10k-25k, 83.5% for AGIs $25k-50k, 81.1% for AGIs $50k-75k, 84.0% for AGIs $75k-100k, 76.1% for AGIs over 100k)
Taxable interest for individuals: $932 (reported on 40.8% of returns)
This zip code:
$932
Indiana:
$1,535
(% of AGI for various income ranges: 4.1% for AGIs below $10k, 1.9% for AGIs $10k-25k, 0.8% for AGIs $25k-50k, 0.8% for AGIs $50k-75k, 0.8% for AGIs $75k-100k, 0.7% for AGIs over 100k)
Taxable dividends: $1,265 (reported on 13.2% of returns)
Here:
$1,265
State:
$2,998
(% of AGI for various income ranges: 2.3% for AGIs below $10k, 0.3% for AGIs $10k-25k, 0.2% for AGIs $25k-50k, 0.5% for AGIs $50k-75k, 0.4% for AGIs $75k-100k, 0.6% for AGIs over 100k)
Net capital gain/loss: +$4,533 (reported on 11.4% of returns)
Here:
+$4,533
State:
+$8,619
(% of AGI for various income ranges: -1.6% for AGIs below $10k, -0.2% for AGIs $10k-25k, 0.2% for AGIs $25k-50k, 1.3% for AGIs $50k-75k, 1.9% for AGIs $75k-100k, 3.5% for AGIs over 100k)
Profit/loss from business: +$7,599 (reported on 15.5% of returns)
Here:
+$7,599
State:
+$10,071
(% of AGI for various income ranges: 8.1% for AGIs below $10k, 3.8% for AGIs $10k-25k, 4.9% for AGIs $25k-50k, 3.8% for AGIs $50k-75k, 0.6% for AGIs $75k-100k, 0.3% for AGIs over 100k)
IRA payment deduction: $2,429 (reported on 2.0% of returns)
47126:
$2,429
Indiana:
$2,840
Total itemized deductions: $14,290 (21% of AGI, reported on 30.1% of returns)
Here:
$14,290
State:
$17,065
Here:
21.3% of AGI
State:
19.5% of AGI
(% of AGI for various income ranges: 17.8% for AGIs below $10k, 6.5% for AGIs $10k-25k, 9.9% for AGIs $25k-50k, 12.3% for AGIs $50k-75k, 11.1% for AGIs $75k-100k, 12.0% for AGIs over 100k)
Charity contributions deductions: $2,128 (3% of AGI, reported on 25.2% of returns)
Here:
$2,128
State:
$3,550
Here:
3.0% of AGI
State:
3.8% of AGI
(% of AGI for various income ranges: 0.7% for AGIs $10k-25k, 1.2% for AGIs $25k-50k, 1.6% for AGIs $50k-75k, 1.5% for AGIs $75k-100k, 1.7% for AGIs over 100k)
Total tax: $4,803 (reported on 76.3% of returns)
47126:
$4,803
State:
$6,914
(% of AGI for various income ranges: 3.2% for AGIs below $10k, 4.1% for AGIs $10k-25k, 6.8% for AGIs $25k-50k, 8.9% for AGIs $50k-75k, 10.7% for AGIs $75k-100k, 16.2% for AGIs over 100k)
Earned income credit: $1,690 (reported on 14.5% of returns)
Here:
$1,690
State:
$1,685
Percentage of individuals using paid preparers for their 2004 taxes: 61.5%
Here:
61%
State:
59%
(% for various income ranges: 56.3% for AGIs below $10k, 61.3% for AGIs $10k-25k, 65.0% for AGIs $25k-50k, 60.9% for AGIs $50k-75k, 57.2% for AGIs $75k-100k, 71.8% for AGIs over 100k)
Household received Food Stamps/SNAP in the past 12 months: 23 Household did not receive Food Stamps/SNAP in the past 12 months: 1,553
Women who had a birth in the past 12 months: 68 (74 now married, 0 unmarried) Women who did not have a birth in the past 12 months: 746 (449 now married, 298 unmarried)
Housing units in zip code 47126 with a mortgage: 958 (91 second mortgage, 72 both second mortgage and home equity loan) Houses without a mortgage: 71
Median monthly owner costs for units with a mortgage: $1,448 Median monthly owner costs for units without a mortgage: $468
Residents with income below the poverty level in 2022:
This zip code:
7.3%
Whole state:
12.6%
Residents with income below 50% of the poverty level in 2022:
This zip code:
3.4%
Whole state:
6.3%
Median number of rooms in houses and condos:
Here:
5.9
State:
6.6
Median number of rooms in apartments:
Here:
4.3
State:
4.3
Notable locations in this zip code not listed on our city pages
Notable locations in zip code 47126: Monroe Township Volunteer Fire Department Station 3 (A), Monroe Township Fire Department (B). Display/hide their locations on the map
Streams, rivers, and creeks: Sheep Branch (A), Left Branch Blue Lick Creek (B), Sticky Branch (C), Wolf Run (D), Wrong Branch (E), Out Brook (F), Right Branch Blue Lick Creek (G), Wheel Run (H), Hilltop Run (I). Display/hide their locations on the map
In group quarters: 79 (-1 institutionalized population)
Size of family households: 576 2-persons, 256 3-persons, 206 4-persons, 107 5-persons, 31 6-persons
Size of nonfamily households: 348 1-person, 44 2-persons, 8 5-persons
795 married couples with children.
154 single-parent households (116 men, 38 women).
97.7% of residents of 47126 zip code speak English at home.
1.6% of residents speak Spanish at home (69% very well, 31% well).
Foreign born population: 60 (1.5%) (100.0% of them are naturalized citizens)
This zip code:
1.5%
Whole state:
6.1%
51%Romania
27%German
18%American
11%English
6%Irish
3%Russian
2%European
1%Italian
Year of entry for the foreign-born population
422010 or later
342000 to 2009
01990 to 1999
20Before 1990
Facilities with environmental interests located in this zip code:
AT AND T LONG LINES HENRYVILLE IND (APPROX 3M SO FO NEW LIBERTY IN in HENRYVILLE, IN)
STATE MASTER (Indiana facility tracking) - CRTK-1138, EPCRA, UST-930, UNDERGROUND STORAGE TANK PROGRAM (Resource Conservation and Recovery Act (tracking hazardous waste))
Housing units lacking complete plumbing facilities: 0.4% Housing units lacking complete kitchen facilities: 3.3%
41.2%Electricity
30.6%Utility gas
21.0%Bottled, tank, or LP gas
2.9%Wood
2.4%No fuel used
2.0%Fuel oil, kerosene, etc.
Population in 1990: 2,648. Population change in the 1990s: +834 (+31.5%).
Place of birth for U.S.-born residents:
This state: 2,355
Northeast: 159
Midwest: 302
South: 1,102
West: 122
58% of the 47126 zip code residents lived in the same house 5 years ago. Out of people who lived in different houses, 59% lived in this county. Out of people who lived in different counties, 50% lived in Indiana.
91% of the 47126 zip code residents lived in the same house 1 year ago. Out of people who lived in different houses, 38% moved from this county. Out of people who lived in different houses, 21% moved from different county within same state. Out of people who lived in different houses, 36% moved from different state. Out of people who lived in different houses, 8% moved from abroad.
Private vs. public school enrollment:
Students in private schools in grades 1 to 8 (elementary and middle school): 67
Here:
33.8%
Indiana:
14.9%
Students in private schools in grades 9 to 12 (high school): 43
Here:
12.6%
Indiana:
11.4%
Students in private undergraduate colleges: 11
Here:
25.4%
Indiana:
22.3%
Occupation by median earnings in the past 12 months ($)
116,545Architecture and engineering occupations
86,914Installation, maintenance, and repair occupations
78,983Health diagnosing and treating practitioners and other technical occupations
77,921Management occupations
72,343Transportation occupations
67,674Production occupations
Top industries in this zip code by the number of employees in 2005:
Health Care and Social Assistance: Offices of Physicians (except Mental Health Specialists) (20-49 employees: 1 establishment, 1-4 employees: 1 establishment)
Real Estate and Rental and Leasing: Lessors of Nonresidential Buildings (except Miniwarehouses) (20-49: 1)
Accommodation and Food Services: Full-Service Restaurants (20-49: 1)
Administrative and Support and Waste Management and Remediation Services: Employment Placement Agencies (20-49: 1)
Construction: Plumbing, Heating, and Air-Conditioning Contractors (10-19: 1, 1-4: 3)
Construction: New Single-Family Housing Construction (except Operative Builders) (5-9: 2, 1-4: 1)
Construction: Residential Remodelers (10-19: 1)
People in group quarters in 2010:
194 people in state prisons
12 people in group homes intended for adults
People in group quarters in 2000:
97 people in state prisons
8 people in homes for the mentally retarded
Fatal accident statistics in 2014:
Fatal accident count: 1
Vehicles involved in fatal accidents: 2
Fatal accidents caused by drunken drivers: 0
Fatalities: 1
Persons involved in fatal accidents: 2
Pedestrians involved in fatal accidents: 0
Fatal accident statistics in 2011:
Fatal accident count: 2
Vehicles involved in fatal accidents: 3
Fatal accidents caused by drunken drivers: 0
Fatalities: 2
Persons involved in fatal accidents: 4
Pedestrians involved in fatal accidents: 0
Home Mortgage Disclosure Act Aggregated Statistics For Year 2009 (Based on 2 partial tracts)
A) FHA, FSA/RHS & VA Home Purchase Loans
B) Conventional Home Purchase Loans
C) Refinancings
D) Home Improvement Loans
F) Non-occupant Loans on < 5 Family Dwellings (A B C & D)
G) Loans On Manufactured Home Dwelling (A B C & D)
Number
Average Value
Number
Average Value
Number
Average Value
Number
Average Value
Number
Average Value
Number
Average Value
LOANS ORIGINATED
64
$133,320
46
$129,082
228
$141,236
15
$41,141
22
$107,381
12
$57,402
APPLICATIONS APPROVED, NOT ACCEPTED
8
$133,320
4
$103,272
18
$135,957
0
$0
1
$65,650
4
$93,425
APPLICATIONS DENIED
11
$125,975
10
$95,748
92
$143,760
13
$40,788
9
$70,588
4
$87,618
APPLICATIONS WITHDRAWN
6
$122,715
2
$132,310
39
$141,763
3
$27,607
2
$124,735
2
$127,260
FILES CLOSED FOR INCOMPLETENESS
6
$119,853
2
$153,520
13
$114,441
1
$40,400
0
$0
0
$0
Aggregated Statistics For Year 2008 (Based on 2 partial tracts)
A) FHA, FSA/RHS & VA Home Purchase Loans
B) Conventional Home Purchase Loans
C) Refinancings
D) Home Improvement Loans
E) Loans on Dwellings For 5+ Families
F) Non-occupant Loans on < 5 Family Dwellings (A B C & D)
G) Loans On Manufactured Home Dwelling (A B C & D)
Number
Average Value
Number
Average Value
Number
Average Value
Number
Average Value
Number
Average Value
Number
Average Value
Number
Average Value
LOANS ORIGINATED
43
$133,343
63
$139,460
127
$122,178
17
$50,916
2
$348,450
22
$117,527
18
$62,115
APPLICATIONS APPROVED, NOT ACCEPTED
2
$193,920
18
$111,661
11
$128,178
3
$93,257
0
$0
2
$156,550
6
$45,955
APPLICATIONS DENIED
15
$139,178
10
$115,443
114
$124,443
16
$48,732
0
$0
4
$153,520
17
$71,710
APPLICATIONS WITHDRAWN
3
$101,000
5
$90,092
40
$133,219
3
$99,317
0
$0
0
$0
1
$98,980
FILES CLOSED FOR INCOMPLETENESS
2
$112,615
1
$122,210
11
$157,101
0
$0
0
$0
0
$0
1
$122,210
Aggregated Statistics For Year 2007 (Based on 2 partial tracts)
A) FHA, FSA/RHS & VA Home Purchase Loans
B) Conventional Home Purchase Loans
C) Refinancings
D) Home Improvement Loans
E) Loans on Dwellings For 5+ Families
F) Non-occupant Loans on < 5 Family Dwellings (A B C & D)
G) Loans On Manufactured Home Dwelling (A B C & D)
Number
Average Value
Number
Average Value
Number
Average Value
Number
Average Value
Number
Average Value
Number
Average Value
Number
Average Value
LOANS ORIGINATED
30
$126,587
135
$139,694
142
$101,192
33
$31,371
1
$83,830
33
$95,858
21
$77,530
APPLICATIONS APPROVED, NOT ACCEPTED
2
$123,220
18
$120,190
26
$135,573
6
$46,797
0
$0
0
$0
6
$72,215
APPLICATIONS DENIED
8
$117,160
28
$107,529
129
$114,005
18
$55,943
0
$0
7
$92,631
10
$65,549
APPLICATIONS WITHDRAWN
2
$93,425
20
$130,138
35
$113,380
3
$55,213
0
$0
0
$0
2
$60,600
FILES CLOSED FOR INCOMPLETENESS
0
$0
8
$130,669
11
$152,235
0
$0
0
$0
1
$151,500
0
$0
Aggregated Statistics For Year 2006 (Based on 2 partial tracts)
A) FHA, FSA/RHS & VA Home Purchase Loans
B) Conventional Home Purchase Loans
C) Refinancings
D) Home Improvement Loans
E) Loans on Dwellings For 5+ Families
F) Non-occupant Loans on < 5 Family Dwellings (A B C & D)
G) Loans On Manufactured Home Dwelling (A B C & D)
Number
Average Value
Number
Average Value
Number
Average Value
Number
Average Value
Number
Average Value
Number
Average Value
Number
Average Value
LOANS ORIGINATED
17
$125,894
150
$118,049
185
$120,627
28
$50,464
0
$0
29
$105,110
17
$65,056
APPLICATIONS APPROVED, NOT ACCEPTED
3
$169,680
20
$111,302
26
$144,275
3
$17,507
1
$101,000
1
$60,600
4
$89,385
APPLICATIONS DENIED
5
$115,746
32
$109,364
123
$128,155
19
$55,018
0
$0
10
$112,110
11
$59,315
APPLICATIONS WITHDRAWN
1
$80,800
11
$125,056
66
$115,737
2
$122,715
0
$0
5
$82,416
5
$78,174
FILES CLOSED FOR INCOMPLETENESS
2
$101,505
3
$98,980
28
$151,248
0
$0
0
$0
3
$87,870
0
$0
Aggregated Statistics For Year 2005 (Based on 2 partial tracts)
A) FHA, FSA/RHS & VA Home Purchase Loans
B) Conventional Home Purchase Loans
C) Refinancings
D) Home Improvement Loans
F) Non-occupant Loans on < 5 Family Dwellings (A B C & D)
G) Loans On Manufactured Home Dwelling (A B C & D)
Number
Average Value
Number
Average Value
Number
Average Value
Number
Average Value
Number
Average Value
Number
Average Value
LOANS ORIGINATED
20
$113,726
148
$125,718
174
$108,285
37
$41,465
28
$99,485
27
$64,229
APPLICATIONS APPROVED, NOT ACCEPTED
2
$92,920
13
$93,308
45
$114,422
5
$40,400
4
$71,205
4
$42,925
APPLICATIONS DENIED
6
$111,942
31
$101,000
143
$117,471
18
$47,863
3
$78,107
23
$66,748
APPLICATIONS WITHDRAWN
1
$160,590
24
$99,317
68
$125,314
8
$141,274
9
$97,633
5
$54,338
FILES CLOSED FOR INCOMPLETENESS
1
$79,790
7
$104,607
19
$136,509
1
$25,250
1
$114,130
0
$0
Aggregated Statistics For Year 2004 (Based on 2 partial tracts)
A) FHA, FSA/RHS & VA Home Purchase Loans
B) Conventional Home Purchase Loans
C) Refinancings
D) Home Improvement Loans
F) Non-occupant Loans on < 5 Family Dwellings (A B C & D)
G) Loans On Manufactured Home Dwelling (A B C & D)
Number
Average Value
Number
Average Value
Number
Average Value
Number
Average Value
Number
Average Value
Number
Average Value
LOANS ORIGINATED
15
$119,786
122
$117,483
237
$116,546
28
$32,464
27
$166,987
25
$49,046
APPLICATIONS APPROVED, NOT ACCEPTED
1
$129,280
17
$93,752
41
$106,149
4
$45,702
0
$0
7
$65,361
APPLICATIONS DENIED
3
$101,337
36
$77,461
134
$108,726
19
$43,536
8
$65,271
28
$80,259
APPLICATIONS WITHDRAWN
4
$109,080
12
$112,447
56
$116,421
2
$93,425
0
$0
3
$106,723
FILES CLOSED FOR INCOMPLETENESS
1
$54,540
5
$113,726
25
$110,050
0
$0
2
$86,860
2
$49,995
Aggregated Statistics For Year 2003 (Based on 2 partial tracts)
A) FHA, FSA/RHS & VA Home Purchase Loans
B) Conventional Home Purchase Loans
C) Refinancings
D) Home Improvement Loans
F) Non-occupant Loans on < 5 Family Dwellings (A B C & D)
Number
Average Value
Number
Average Value
Number
Average Value
Number
Average Value
Number
Average Value
LOANS ORIGINATED
17
$116,685
94
$117,515
534
$108,711
28
$32,572
26
$75,284
APPLICATIONS APPROVED, NOT ACCEPTED
1
$73,730
9
$87,421
76
$107,897
4
$23,230
2
$65,145
APPLICATIONS DENIED
1
$72,720
30
$84,032
159
$96,661
10
$20,301
9
$60,488
APPLICATIONS WITHDRAWN
0
$0
15
$94,132
65
$101,280
1
$15,150
6
$82,147
FILES CLOSED FOR INCOMPLETENESS
0
$0
2
$143,420
26
$135,301
0
$0
1
$63,630
Aggregated Statistics For Year 2002 (Based on 2 partial tracts)
A) FHA, FSA/RHS & VA Home Purchase Loans
B) Conventional Home Purchase Loans
C) Refinancings
D) Home Improvement Loans
F) Non-occupant Loans on < 5 Family Dwellings (A B C & D)
Number
Average Value
Number
Average Value
Number
Average Value
Number
Average Value
Number
Average Value
LOANS ORIGINATED
10
$98,475
97
$113,859
402
$105,859
42
$26,837
23
$77,638
APPLICATIONS APPROVED, NOT ACCEPTED
3
$100,327
16
$75,750
53
$83,277
7
$31,454
1
$47,470
APPLICATIONS DENIED
2
$169,680
27
$69,578
96
$93,141
10
$5,454
6
$38,548
APPLICATIONS WITHDRAWN
3
$145,777
12
$110,932
75
$105,713
5
$37,774
1
$56,560
FILES CLOSED FOR INCOMPLETENESS
0
$0
5
$77,568
14
$107,204
0
$0
0
$0
Aggregated Statistics For Year 2001 (Based on 2 partial tracts)
A) FHA, FSA/RHS & VA Home Purchase Loans
B) Conventional Home Purchase Loans
C) Refinancings
D) Home Improvement Loans
F) Non-occupant Loans on < 5 Family Dwellings (A B C & D)
Number
Average Value
Number
Average Value
Number
Average Value
Number
Average Value
Number
Average Value
LOANS ORIGINATED
22
$98,291
112
$106,095
365
$98,211
37
$17,743
24
$112,152
APPLICATIONS APPROVED, NOT ACCEPTED
1
$90,900
17
$75,334
57
$77,008
9
$28,392
1
$35,350
APPLICATIONS DENIED
2
$103,525
43
$59,050
113
$78,083
11
$28,096
5
$49,288
APPLICATIONS WITHDRAWN
3
$99,317
10
$111,201
69
$89,992
4
$65,397
7
$80,656
FILES CLOSED FOR INCOMPLETENESS
0
$0
7
$59,301
15
$101,135
0
$0
0
$0
Aggregated Statistics For Year 2000 (Based on 2 partial tracts)
A) FHA, FSA/RHS & VA Home Purchase Loans
B) Conventional Home Purchase Loans
C) Refinancings
D) Home Improvement Loans
F) Non-occupant Loans on < 5 Family Dwellings (A B C & D)
Number
Average Value
Number
Average Value
Number
Average Value
Number
Average Value
Number
Average Value
LOANS ORIGINATED
13
$84,762
104
$100,592
178
$78,939
38
$16,957
12
$59,085
APPLICATIONS APPROVED, NOT ACCEPTED
2
$75,245
15
$54,742
56
$64,892
8
$51,510
1
$9,090
APPLICATIONS DENIED
2
$55,045
47
$58,473
88
$53,817
16
$17,422
4
$49,490
APPLICATIONS WITHDRAWN
0
$0
10
$118,978
44
$71,871
3
$110,763
1
$29,290
FILES CLOSED FOR INCOMPLETENESS
2
$76,760
0
$0
12
$84,840
0
$0
0
$0
Aggregated Statistics For Year 1999 (Based on 1 partial tract)
A) FHA, FSA/RHS & VA Home Purchase Loans
B) Conventional Home Purchase Loans
C) Refinancings
D) Home Improvement Loans
F) Non-occupant Loans on < 5 Family Dwellings (A B C & D)
Detailed PMIC statistics for the following Tracts:0508.02
2002 - 2018 National Fire Incident Reporting System (NFIRS) incidents
According to the data from the years 2002 - 2018 the average number of fire incidents per year is 27. The highest number of reported fire incidents - 64 took place in 2007, and the least - 3 in 2014. The data has an increasing trend.
When looking into fire subcategories, the most reports belonged to: Outside Fires (37.6%), and Structure Fires (31.1%).
Fire incident types reported to NFIRS in Zip Code 47126


 Nearest zip codes: 47177, 47143, 47163, 47172, 47106, 47170.


 According to the data from the years 2002 - 2018 the average number of fire incidents per year is 27. The highest number of reported fire incidents - 64 took place in 2007, and the least - 3 in 2014. The data has an increasing trend.
 When looking into fire subcategories, the most reports belonged to: Outside Fires (37.6%), and Structure Fires (31.1%).