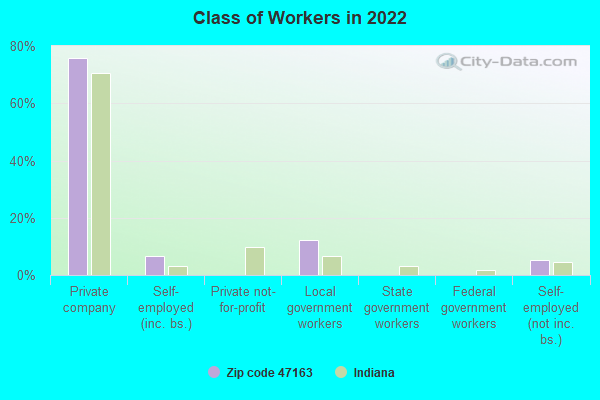
Estimated zip code population in 2022: 816 Zip code population in 2010: 1,746 Zip code population in 2000: 1,733
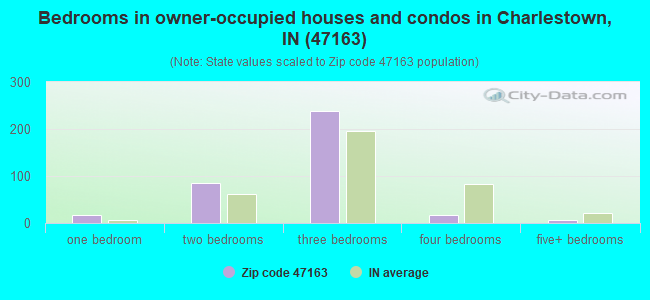
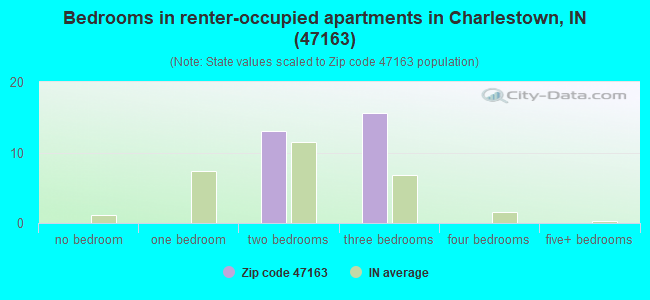
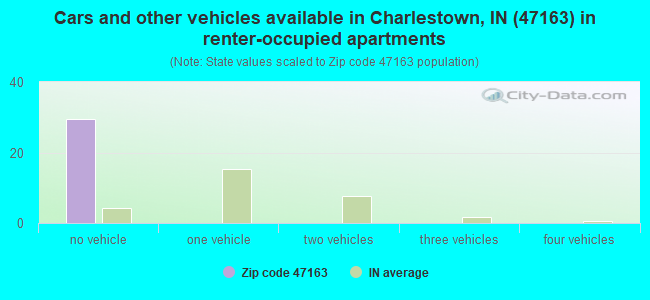
Houses and condos: 431 Renter-occupied apartments: 29
% of renters here:
7%
State:
29%
March 2022 cost of living index in zip code 47163: 83.7 (less than average, U.S. average is 100)
Land area: 20.8 sq. mi. Water area: 0.1 sq. mi.
Population density: 39 people per square mile
(very low).
OSM Map
General Map
Google Map
MSN Map
OSM Map
General Map
Google Map
MSN Map
OSM Map
General Map
Google Map
MSN Map
OSM Map
General Map
Google Map
MSN Map
Please wait while loading the map...
Real estate property taxes paid for housing units in 2022:
This zip code:
0.6% ($953)
Indiana:
0.7% ($1,467)
Median real estate property taxes paid for housing units with mortgages in 2022: $955 (0.4%) Median real estate property taxes paid for housing units with no mortgage in 2022: $1,016 (0.7%)
Business Search- 14 Million verified businesses
Males: 470
(57.6%)
Females: 346
(42.4%)
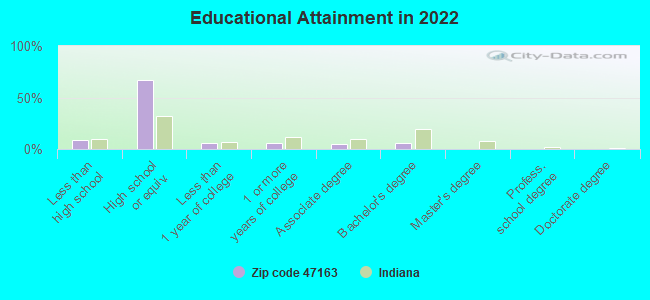
For population 25 years and over in 47163:
High school or higher: 89.0%
Bachelor's degree or higher: 6.2%
Graduate or professional degree: 0.0%
Unemployed: 2.9%
Mean travel time to work (commute): 25.3 minutes
For population 15 years and over in 47163:
Never married: 14.0%
Now married: 68.0%
Separated: 2.3%
Widowed: 2.2%
Divorced: 13.5%
Zip code 47163 compared to state average:
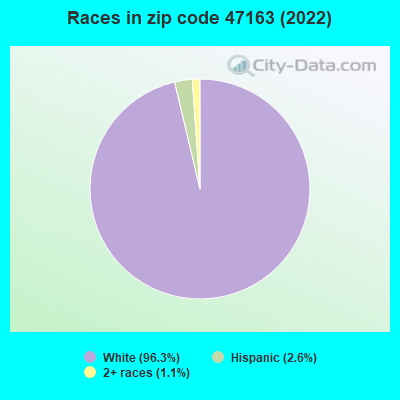
Black race population percentage significantly below state average.
Hispanic race population percentage significantly below state average.
Median age significantly above state average.
Foreign-born population percentage significantly below state average.
Renting percentage significantly below state average.
Length of stay since moving in above state average.
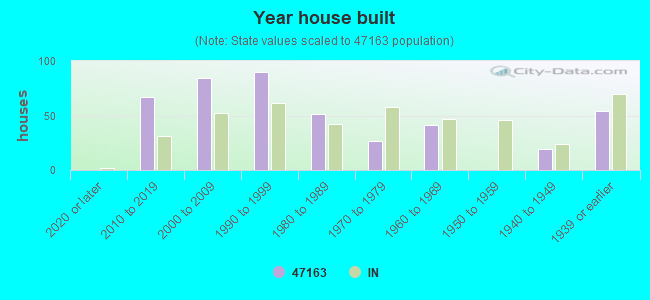
House age below state average.
Percentage of population with a bachelor's degree or higher significantly below state average.
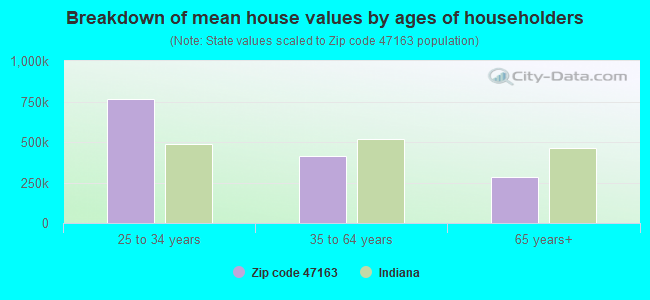
Estimated median house/condo value in 2022: $172,325
47163:
$172,325
Indiana:
$208,700
Median resident age:
This zip code:
59.4 years
Indiana median age:
38.2 years
Average household size:
This zip code:
2.1 people
Indiana:
2.4 people
Averages for the 2020 tax year for zip code 47163, filed in 2021:
Average Adjusted Gross Income (AGI) in 2020: $64,274 (Individual Income Tax Returns)
Here:
$64,274
State:
$64,978
Salary/wage: $52,868 (reported on 82.2% of returns)
Here:
$52,868
State:
$55,245
(% of AGI for various income ranges: 1071.9% for AGIs below $25k, 3631.4% for AGIs $25k-50k, 6245.0% for AGIs $50k-75k, 8544.3% for AGIs $75k-100k, 11892.9% for AGIs $100k-200k)
Taxable interest for individuals: $590 (reported on 27.4% of returns)
This zip code:
$590
Indiana:
$1,351
(% of AGI for various income ranges: 10.0% for AGIs below $25k, 9.3% for AGIs $25k-50k, 4.0% for AGIs $50k-75k, 8.6% for AGIs $75k-100k, 112.9% for AGIs $100k-200k)
Ordinary dividends: $2,062 (reported on 11.0% of returns)
Here:
$2,062
State:
$5,827
(% of AGI for various income ranges: 12.5% for AGIs below $25k, 24.0% for AGIs $50k-75k, 172.9% for AGIs $100k-200k)
Net capital gain/loss in AGI: +$8,286 (reported on 9.6% of returns)
Here:
+$8,286
State:
+$17,730
(% of AGI for various income ranges: 130.0% for AGIs $50k-75k, 642.9% for AGIs $100k-200k)
Profit/loss from business: +$5,090 (reported on 13.7% of returns)
Here:
+$5,090
State:
+$12,144
(% of AGI for various income ranges: 106.2% for AGIs below $25k, 104.3% for AGIs $25k-50k, 275.7% for AGIs $75k-100k)
Taxable individual retirement arrangement distribution: $16,875 (reported on 11.0% of returns)
47163:
$16,875
Indiana:
$18,302
(% of AGI for various income ranges: 384.3% for AGIs $25k-50k, 1160.0% for AGIs $100k-200k)
Total itemized deductions: $32,200 (reported on 4.1% of returns)
Here:
$32,200
State:
$35,601
(% of AGI for various income ranges: 1380.0% for AGIs $75k-100k)
Taxes paid: $6,500 (reported on 4.1% of returns)
47163:
$6,500
State:
$7,542
(% of AGI for various income ranges: 278.6% for AGIs $75k-100k)
Earned income credit: $2,178 (reported on 12.3% of returns)
Here:
$2,178
State:
$2,298
(% of AGI for various income ranges: 78.8% for AGIs below $25k, 50.0% for AGIs $25k-50k)
Percentage of individuals using paid preparers for their 2020 taxes: 94.5%
Here:
95%
State:
94%
(% for various income ranges: 91.3% for AGIs below $25k, 94.4% for AGIs $25k-50k, 92.3% for AGIs $50k-75k, 100.0% for AGIs $75k-100k, 100.0% for AGIs $100k-200k, 100.0% for AGIs over 200k)
Averages for the 2012 tax year for zip code 47163, filed in 2013:
Average Adjusted Gross Income (AGI) in 2012: $44,461 (Individual Income Tax Returns)
Here:
$44,461
State:
$52,932
Salary/wage: $39,107 (reported on 84.3% of returns)
Here:
$39,107
State:
$45,173
(% of AGI for various income ranges: 68.5% for AGIs below $25k, 77.3% for AGIs $25k-50k, 79.8% for AGIs $50k-75k, 80.9% for AGIs $75k-100k, 67.0% for AGIs $100k-200k)
Taxable interest for individuals: $486 (reported on 30.0% of returns)
This zip code:
$486
Indiana:
$1,311
(% of AGI for various income ranges: 0.7% for AGIs below $25k, 0.5% for AGIs $25k-50k, 0.1% for AGIs $50k-75k, 0.4% for AGIs $100k-200k)
Ordinary dividends: $925 (reported on 11.4% of returns)
Here:
$925
State:
$4,690
Net capital gain/loss in AGI: +$2,650 (reported on 8.6% of returns)
Here:
+$2,650
State:
+$10,406
Profit/loss from business: +$7,950 (reported on 11.4% of returns)
Here:
+$7,950
State:
+$11,105
(% of AGI for various income ranges: 6.8% for AGIs below $25k, 1.8% for AGIs $50k-75k, 5.6% for AGIs $75k-100k)
Taxable individual retirement arrangement distribution: $10,300 (reported on 8.6% of returns)
47163:
$10,300
Indiana:
$13,841
Total itemized deductions: $18,147 (22% of AGI, reported on 24.3% of returns)
Here:
$18,147
State:
$20,913
Here:
22.3% of AGI
State:
18.2% of AGI
(% of AGI for various income ranges: 13.0% for AGIs $25k-50k, 8.2% for AGIs $50k-75k, 11.3% for AGIs $75k-100k, 12.2% for AGIs $100k-200k)
Charity contributions: $2,721 (reported on 20.0% of returns)
Here:
$2,721
State:
$4,697
(% of AGI for various income ranges: 1.1% for AGIs $25k-50k, 1.0% for AGIs $50k-75k, 1.2% for AGIs $75k-100k, 2.0% for AGIs $100k-200k)
Taxes paid: $5,953 (reported on 24.3% of returns)
47163:
$5,953
State:
$7,456
(% of AGI for various income ranges: 2.8% for AGIs $25k-50k, 2.3% for AGIs $50k-75k, 4.1% for AGIs $75k-100k, 5.1% for AGIs $100k-200k)
Earned income credit: $2,100 (reported on 17.1% of returns)
Here:
$2,100
State:
$2,265
(% of AGI for various income ranges: 5.3% for AGIs below $25k, 0.9% for AGIs $25k-50k)
Percentage of individuals using paid preparers for their 2012 taxes: 60.0%
Here:
60%
State:
53%
(% for various income ranges: 55.2% for AGIs below $25k, 58.8% for AGIs $25k-50k, 72.7% for AGIs $50k-75k, 50.0% for AGIs $75k-100k, 71.4% for AGIs $100k-200k)
Averages for the 2004 tax year for zip code 47163, filed in 2005:
Average Adjusted Gross Income (AGI) in 2004: $39,763 (Individual Income Tax Returns)
Here:
$39,763
State:
$44,790
Salary/wage: $38,453 (reported on 86.8% of returns)
Here:
$38,453
State:
$39,615
(% of AGI for various income ranges: 86.9% for AGIs below $10k, 68.9% for AGIs $10k-25k, 86.3% for AGIs $25k-50k, 85.9% for AGIs $50k-75k, 89.6% for AGIs $75k-100k, 81.6% for AGIs over 100k)
Taxable interest for individuals: $749 (reported on 42.1% of returns)
This zip code:
$749
Indiana:
$1,535
(% of AGI for various income ranges: 4.5% for AGIs below $10k, 2.5% for AGIs $10k-25k, 0.5% for AGIs $25k-50k, 0.4% for AGIs $50k-75k, 0.2% for AGIs $75k-100k, 0.9% for AGIs over 100k)
Taxable dividends: $644 (reported on 13.3% of returns)
Here:
$644
State:
$2,998
(% of AGI for various income ranges: 0.2% for AGIs below $10k, 0.3% for AGIs $10k-25k, 0.0% for AGIs $25k-50k, 0.2% for AGIs $50k-75k, 0.6% for AGIs over 100k)
Net capital gain/loss: +$1,519 (reported on 8.0% of returns)
Here:
+$1,519
State:
+$8,619
(% of AGI for various income ranges: -2.3% for AGIs below $10k, -0.4% for AGIs $10k-25k, -0.0% for AGIs $50k-75k, 2.1% for AGIs over 100k)
Profit/loss from business: +$4,862 (reported on 16.7% of returns)
Here:
+$4,862
State:
+$10,071
(% of AGI for various income ranges: 15.8% for AGIs below $10k, 8.4% for AGIs $10k-25k, 0.8% for AGIs $25k-50k, 2.3% for AGIs $50k-75k)
Total itemized deductions: $14,362 (22% of AGI, reported on 33.4% of returns)
Here:
$14,362
State:
$17,065
Here:
21.8% of AGI
State:
19.5% of AGI
(% of AGI for various income ranges: 7.3% for AGIs $10k-25k, 10.7% for AGIs $25k-50k, 13.7% for AGIs $50k-75k, 13.7% for AGIs $75k-100k, 13.5% for AGIs over 100k)
Charity contributions deductions: $2,034 (3% of AGI, reported on 26.6% of returns)
Here:
$2,034
State:
$3,550
Here:
3.0% of AGI
State:
3.8% of AGI
(% of AGI for various income ranges: 1.1% for AGIs $10k-25k, 0.9% for AGIs $25k-50k, 1.5% for AGIs $50k-75k, 2.0% for AGIs $75k-100k, 1.5% for AGIs over 100k)
Total tax: $4,443 (reported on 77.5% of returns)
47163:
$4,443
State:
$6,914
(% of AGI for various income ranges: 3.6% for AGIs below $10k, 4.4% for AGIs $10k-25k, 6.1% for AGIs $25k-50k, 8.4% for AGIs $50k-75k, 10.3% for AGIs $75k-100k, 13.9% for AGIs over 100k)
Earned income credit: $1,600 (reported on 15.3% of returns)
Here:
$1,600
State:
$1,685
Percentage of individuals using paid preparers for their 2004 taxes: 64.9%
Here:
65%
State:
59%
(% for various income ranges: 57.4% for AGIs below $10k, 65.2% for AGIs $10k-25k, 70.4% for AGIs $25k-50k, 65.4% for AGIs $50k-75k, 62.2% for AGIs $75k-100k, 64.1% for AGIs over 100k)
Household received Food Stamps/SNAP in the past 12 months: 20 Household did not receive Food Stamps/SNAP in the past 12 months: 372
Women who had a birth in the past 12 months: 13 (14 now married, 0 unmarried) Women who did not have a birth in the past 12 months: 68 (52 now married, 15 unmarried)
Housing units in zip code 47163 with a mortgage: 264 (21 second mortgage, 22 both second mortgage and home equity loan) Median monthly owner costs for units with a mortgage: $1,183 Median monthly owner costs for units without a mortgage: $385
Residents with income below the poverty level in 2022:
This zip code:
17.6%
Whole state:
12.6%
Residents with income below 50% of the poverty level in 2022:
This zip code:
14.5%
Whole state:
6.3%
Median number of rooms in houses and condos:
Here:
6.0
State:
6.6
Notable locations in this zip code not listed on our city pages
Size of family households: 206 2-persons, 26 3-persons, 14 4-persons, 18 5-persons
Size of nonfamily households: 104 1-person, 22 2-persons
80 married couples with children.
6 single-parent households (6 women).
100.6% of residents of 47163 zip code speak English at home.
Foreign born population: 0 (0.0%)
:
0.0%
Whole state:
6.1%
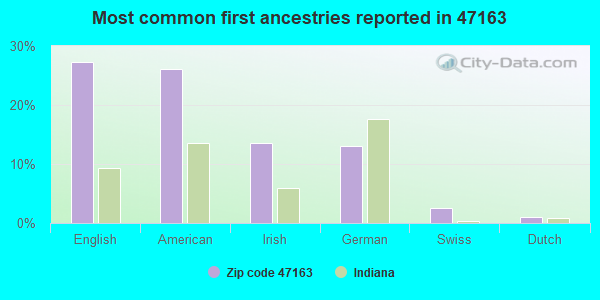
27%English
26%American
14%Irish
13%German
3%Swiss
1%Dutch
Housing units lacking complete kitchen facilities: 6.8%
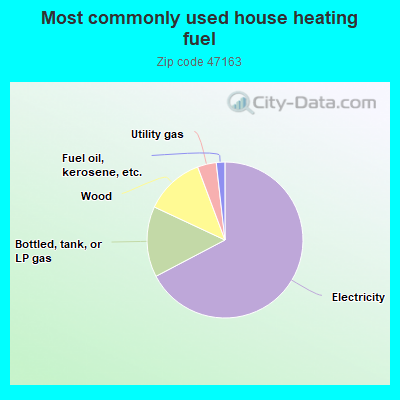
67.5%Electricity
14.7%Bottled, tank, or LP gas
12.4%Wood
3.9%Utility gas
1.8%Fuel oil, kerosene, etc.
Population in 1990: 1,738.
Place of birth for U.S.-born residents:
This state: 502
Midwest: 34
South: 266
63% of the 47163 zip code residents lived in the same house 5 years ago. Out of people who lived in different houses, 76% lived in this county. Out of people who lived in different counties, 50% lived in Indiana.
97% of the 47163 zip code residents lived in the same house 1 year ago. Out of people who lived in different houses, 108% moved from this county.
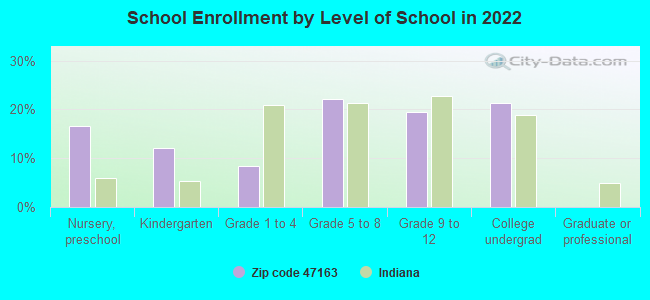
Private vs. public school enrollment:
Students in private schools in grades 1 to 8 (elementary and middle school):
Here:
0.0%
Indiana:
14.9%
Students in private schools in grades 9 to 12 (high school):
Here:
0.0%
Indiana:
11.4%
Students in private undergraduate colleges: 6
Here:
29.0%
Indiana:
22.3%
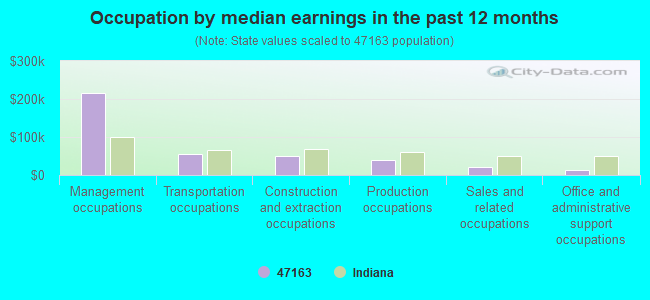
Occupation by median earnings in the past 12 months ($)
215,321Management occupations
56,355Transportation occupations
48,788Construction and extraction occupations
40,789Production occupations
20,180Sales and related occupations
13,816Office and administrative support occupations
Top industries in this zip code by the number of employees in 2005:
Construction: Water and Sewer Line and Related Structures Construction (5-9 employees: 1 establishment, 1-4 employees: 1 establishment)
Professional, Scientific, and Technical Services: Engineering Services (1-4: 1)
Finance and Insurance: Claims Adjusting (1-4: 1)
Health Care and Social Assistance: Offices of Physicians, Mental Health Specialists (1-4: 1)
Other Services (except Public Administration): Automotive Transmission Repair (1-4: 1)
Home Mortgage Disclosure Act Aggregated Statistics For Year 2009 (Based on 2 partial tracts)
A) FHA, FSA/RHS & VA Home Purchase Loans
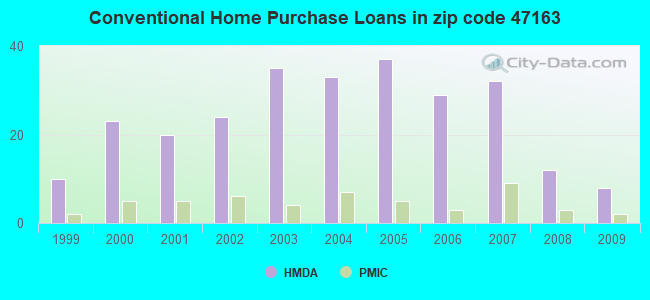
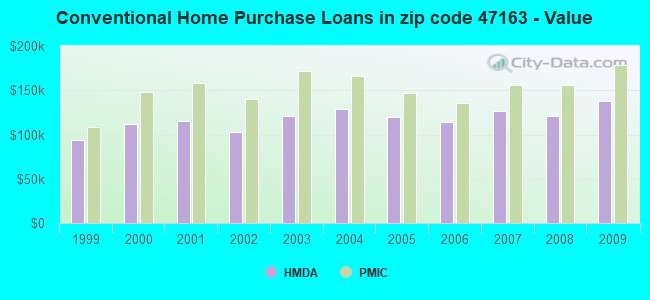
B) Conventional Home Purchase Loans
C) Refinancings
D) Home Improvement Loans
F) Non-occupant Loans on < 5 Family Dwellings (A B C & D)
G) Loans On Manufactured Home Dwelling (A B C & D)
Number
Average Value
Number
Average Value
Number
Average Value
Number
Average Value
Number
Average Value
Number
Average Value
LOANS ORIGINATED
18
$151,189
8
$137,329
55
$151,210
4
$47,712
5
$85,038
0
$0
APPLICATIONS APPROVED, NOT ACCEPTED
1
$168,580
0
$0
6
$160,150
0
$0
0
$0
0
$0
APPLICATIONS DENIED
4
$144,800
1
$116,310
15
$150,254
2
$83,645
0
$0
1
$75,610
APPLICATIONS WITHDRAWN
2
$138,910
1
$315,520
10
$178,257
0
$0
0
$0
0
$0
FILES CLOSED FOR INCOMPLETENESS
0
$0
0
$0
3
$156,510
0
$0
0
$0
0
$0
Aggregated Statistics For Year 2008 (Based on 2 partial tracts)
A) FHA, FSA/RHS & VA Home Purchase Loans
B) Conventional Home Purchase Loans
C) Refinancings
D) Home Improvement Loans
F) Non-occupant Loans on < 5 Family Dwellings (A B C & D)
G) Loans On Manufactured Home Dwelling (A B C & D)
Number
Average Value
Number
Average Value
Number
Average Value
Number
Average Value
Number
Average Value
Number
Average Value
LOANS ORIGINATED
7
$134,854
12
$120,809
32
$130,789
5
$38,256
9
$56,572
2
$54,085
APPLICATIONS APPROVED, NOT ACCEPTED
0
$0
2
$53,550
4
$160,865
0
$0
0
$0
1
$24,630
APPLICATIONS DENIED
2
$192,030
3
$121,167
22
$141,985
2
$73,470
1
$70,900
1
$116,100
APPLICATIONS WITHDRAWN
0
$0
1
$117,600
10
$162,257
0
$0
1
$63,620
1
$74,970
FILES CLOSED FOR INCOMPLETENESS
0
$0
1
$99,170
3
$90,393
0
$0
0
$0
0
$0
Aggregated Statistics For Year 2007 (Based on 2 partial tracts)
A) FHA, FSA/RHS & VA Home Purchase Loans
B) Conventional Home Purchase Loans
C) Refinancings
D) Home Improvement Loans
F) Non-occupant Loans on < 5 Family Dwellings (A B C & D)
G) Loans On Manufactured Home Dwelling (A B C & D)
Number
Average Value
Number
Average Value
Number
Average Value
Number
Average Value
Number
Average Value
Number
Average Value
LOANS ORIGINATED
4
$144,585
32
$126,987
39
$124,708
8
$42,090
9
$100,269
1
$45,840
APPLICATIONS APPROVED, NOT ACCEPTED
0
$0
4
$71,008
7
$158,753
1
$64,470
0
$0
2
$27,845
APPLICATIONS DENIED
1
$160,220
3
$90,537
22
$142,287
5
$54,450
1
$88,680
1
$74,760
APPLICATIONS WITHDRAWN
0
$0
1
$130,020
11
$148,148
1
$82,250
1
$111,170
0
$0
FILES CLOSED FOR INCOMPLETENESS
0
$0
2
$129,270
4
$169,485
0
$0
0
$0
0
$0
Aggregated Statistics For Year 2006 (Based on 2 partial tracts)
A) FHA, FSA/RHS & VA Home Purchase Loans
B) Conventional Home Purchase Loans
C) Refinancings
D) Home Improvement Loans
F) Non-occupant Loans on < 5 Family Dwellings (A B C & D)
G) Loans On Manufactured Home Dwelling (A B C & D)
Number
Average Value
Number
Average Value
Number
Average Value
Number
Average Value
Number
Average Value
Number
Average Value
LOANS ORIGINATED
4
$155,562
29
$113,858
41
$104,691
8
$31,809
10
$68,822
3
$68,473
APPLICATIONS APPROVED, NOT ACCEPTED
1
$88,680
3
$91,820
5
$107,486
1
$148,870
0
$0
1
$37,700
APPLICATIONS DENIED
0
$0
3
$98,603
22
$124,898
5
$55,306
1
$44,770
2
$70,795
APPLICATIONS WITHDRAWN
1
$69,400
2
$167,935
13
$155,905
1
$53,340
1
$56,330
1
$80,110
FILES CLOSED FOR INCOMPLETENESS
0
$0
3
$92,533
6
$130,840
0
$0
1
$86,970
0
$0
Aggregated Statistics For Year 2005 (Based on 2 partial tracts)
A) FHA, FSA/RHS & VA Home Purchase Loans
B) Conventional Home Purchase Loans
C) Refinancings
D) Home Improvement Loans
F) Non-occupant Loans on < 5 Family Dwellings (A B C & D)
G) Loans On Manufactured Home Dwelling (A B C & D)
Number
Average Value
Number
Average Value
Number
Average Value
Number
Average Value
Number
Average Value
Number
Average Value
LOANS ORIGINATED
3
$123,093
37
$120,247
39
$125,477
9
$32,653
5
$79,212
3
$48,980
APPLICATIONS APPROVED, NOT ACCEPTED
0
$0
6
$114,455
6
$134,053
2
$19,920
0
$0
1
$24,420
APPLICATIONS DENIED
1
$161,290
8
$94,141
30
$131,612
6
$66,938
1
$123,380
2
$38,665
APPLICATIONS WITHDRAWN
1
$71,110
5
$127,792
15
$137,373
3
$140,443
1
$123,810
0
$0
FILES CLOSED FOR INCOMPLETENESS
0
$0
1
$133,230
4
$155,242
0
$0
0
$0
0
$0
Aggregated Statistics For Year 2004 (Based on 2 partial tracts)
A) FHA, FSA/RHS & VA Home Purchase Loans
B) Conventional Home Purchase Loans
C) Refinancings
D) Home Improvement Loans
F) Non-occupant Loans on < 5 Family Dwellings (A B C & D)
G) Loans On Manufactured Home Dwelling (A B C & D)
Number
Average Value
Number
Average Value
Number
Average Value
Number
Average Value
Number
Average Value
Number
Average Value
LOANS ORIGINATED
4
$135,588
33
$128,371
43
$133,656
7
$32,681
9
$116,406
2
$70,045
APPLICATIONS APPROVED, NOT ACCEPTED
0
$0
4
$134,250
9
$93,368
1
$86,540
1
$35,990
1
$56,120
APPLICATIONS DENIED
0
$0
6
$72,828
23
$117,624
5
$32,472
3
$51,480
2
$83,215
APPLICATIONS WITHDRAWN
0
$0
3
$76,470
13
$128,125
0
$0
1
$46,910
1
$71,330
FILES CLOSED FOR INCOMPLETENESS
0
$0
1
$70,470
5
$116,482
0
$0
0
$0
0
$0
Aggregated Statistics For Year 2003 (Based on 2 partial tracts)
A) FHA, FSA/RHS & VA Home Purchase Loans
B) Conventional Home Purchase Loans
C) Refinancings
D) Home Improvement Loans
F) Non-occupant Loans on < 5 Family Dwellings (A B C & D)
Number
Average Value
Number
Average Value
Number
Average Value
Number
Average Value
Number
Average Value
LOANS ORIGINATED
3
$122,737
35
$120,778
99
$117,695
7
$33,231
9
$89,107
APPLICATIONS APPROVED, NOT ACCEPTED
0
$0
4
$125,895
16
$115,266
2
$18,530
0
$0
APPLICATIONS DENIED
0
$0
7
$73,226
25
$90,598
1
$16,920
1
$107,100
APPLICATIONS WITHDRAWN
0
$0
3
$118,453
13
$137,615
1
$20,780
0
$0
FILES CLOSED FOR INCOMPLETENESS
0
$0
1
$116,950
4
$133,982
0
$0
0
$0
Aggregated Statistics For Year 2002 (Based on 2 partial tracts)
A) FHA, FSA/RHS & VA Home Purchase Loans
B) Conventional Home Purchase Loans
C) Refinancings
D) Home Improvement Loans
F) Non-occupant Loans on < 5 Family Dwellings (A B C & D)
Number
Average Value
Number
Average Value
Number
Average Value
Number
Average Value
Number
Average Value
LOANS ORIGINATED
3
$123,950
24
$102,495
87
$105,209
7
$24,051
14
$49,970
APPLICATIONS APPROVED, NOT ACCEPTED
0
$0
2
$60,510
13
$107,034
1
$40,700
0
$0
APPLICATIONS DENIED
0
$0
4
$88,410
14
$105,218
1
$16,280
0
$0
APPLICATIONS WITHDRAWN
0
$0
2
$138,585
10
$109,970
2
$14,780
0
$0
FILES CLOSED FOR INCOMPLETENESS
0
$0
0
$0
4
$110,205
0
$0
0
$0
Aggregated Statistics For Year 2001 (Based on 2 partial tracts)
A) FHA, FSA/RHS & VA Home Purchase Loans
B) Conventional Home Purchase Loans
C) Refinancings
D) Home Improvement Loans
F) Non-occupant Loans on < 5 Family Dwellings (A B C & D)
Number
Average Value
Number
Average Value
Number
Average Value
Number
Average Value
Number
Average Value
LOANS ORIGINATED
4
$87,982
20
$115,132
73
$99,406
8
$21,152
9
$69,996
APPLICATIONS APPROVED, NOT ACCEPTED
0
$0
1
$75,400
11
$70,335
1
$26,350
0
$0
APPLICATIONS DENIED
0
$0
5
$57,148
18
$74,339
3
$16,207
1
$44,130
APPLICATIONS WITHDRAWN
1
$68,540
4
$93,338
9
$116,572
1
$26,130
1
$44,770
FILES CLOSED FOR INCOMPLETENESS
0
$0
1
$91,040
1
$131,520
0
$0
0
$0
Aggregated Statistics For Year 2000 (Based on 2 partial tracts)
A) FHA, FSA/RHS & VA Home Purchase Loans
B) Conventional Home Purchase Loans
C) Refinancings
D) Home Improvement Loans
F) Non-occupant Loans on < 5 Family Dwellings (A B C & D)
Number
Average Value
Number
Average Value
Number
Average Value
Number
Average Value
Number
Average Value
LOANS ORIGINATED
3
$50,267
23
$111,813
30
$87,629
9
$20,230
6
$69,258
APPLICATIONS APPROVED, NOT ACCEPTED
0
$0
2
$84,930
8
$79,281
2
$26,025
0
$0
APPLICATIONS DENIED
1
$119,100
5
$64,774
12
$86,144
3
$19,707
1
$20,560
APPLICATIONS WITHDRAWN
0
$0
3
$108,027
5
$65,460
1
$6,430
0
$0
FILES CLOSED FOR INCOMPLETENESS
0
$0
0
$0
1
$103,030
0
$0
0
$0
Aggregated Statistics For Year 1999 (Based on 1 partial tract)
A) FHA, FSA/RHS & VA Home Purchase Loans
B) Conventional Home Purchase Loans
C) Refinancings
D) Home Improvement Loans
F) Non-occupant Loans on < 5 Family Dwellings (A B C & D)

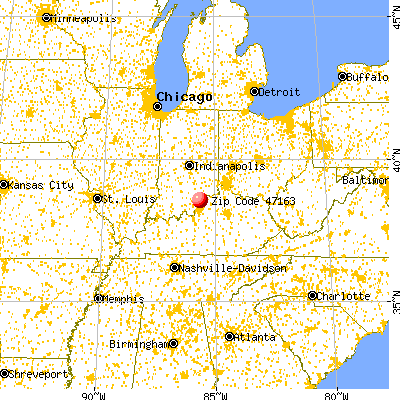


 Nearest zip codes: 47141, 47111, 47126, 47143, 47177, 47147.