Estimated zip code population in 2022: 1,745 Zip code population in 2010: 1,668 Zip code population in 2000: 1,414
Houses and condos: 691 Renter-occupied apartments: 97
% of renters here:
14%
State:
29%
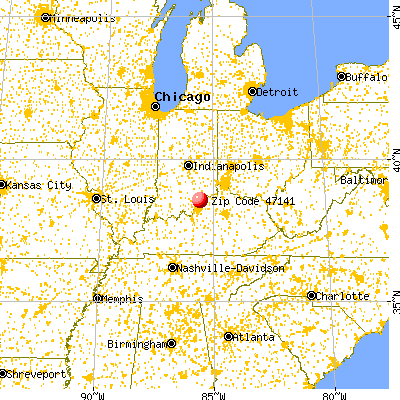
March 2022 cost of living index in zip code 47141: 85.4 (less than average, U.S. average is 100)
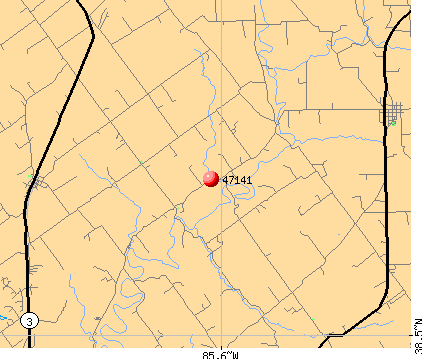
Land area: 34.1 sq. mi. Water area: 0.2 sq. mi.
Population density: 51 people per square mile
(very low).
OSM Map
General Map
Google Map
MSN Map
OSM Map
General Map
Google Map
MSN Map
OSM Map
General Map
Google Map
MSN Map
OSM Map
General Map
Google Map
MSN Map
Please wait while loading the map...
Real estate property taxes paid for housing units in 2022:
This zip code:
0.6% ($1,077)
Indiana:
0.7% ($1,467)
Median real estate property taxes paid for housing units with mortgages in 2022: $1,237 (0.6%) Median real estate property taxes paid for housing units with no mortgage in 2022: $848 (0.7%)
Business Search- 14 Million verified businesses
Males: 941
(53.9%)
Females: 804
(46.1%)
For population 25 years and over in 47141:
High school or higher: 91.5%
Bachelor's degree or higher: 17.9%
Graduate or professional degree: 5.8%
Unemployed: 2.8%
Mean travel time to work (commute): 37.9 minutes
For population 15 years and over in 47141:
Never married: 22.9%
Now married: 47.3%
Separated: 0.0%
Widowed: 8.0%
Divorced: 21.7%
Zip code 47141 compared to state average:
Black race population percentage significantly below state average.
Median age significantly above state average.
Renting percentage below state average.
Length of stay since moving in significantly above state average.
Percentage of population with a bachelor's degree or higher below state average.
Estimated median house/condo value in 2022: $179,146
47141:
$179,146
Indiana:
$208,700
Median resident age:
This zip code:
46.5 years
Indiana median age:
38.2 years
Average household size:
This zip code:
2.6 people
Indiana:
2.4 people
Averages for the 2020 tax year for zip code 47141, filed in 2021:
Average Adjusted Gross Income (AGI) in 2020: $59,041 (Individual Income Tax Returns)
Here:
$59,041
State:
$64,978
Salary/wage: $54,997 (reported on 80.3% of returns)
Here:
$54,997
State:
$55,245
(% of AGI for various income ranges: 1012.9% for AGIs below $25k, 3628.6% for AGIs $25k-50k, 6592.5% for AGIs $50k-75k, 9775.7% for AGIs $75k-100k, 18286.2% for AGIs $100k-200k)
Taxable interest for individuals: $378 (reported on 23.7% of returns)
This zip code:
$378
Indiana:
$1,351
(% of AGI for various income ranges: 11.2% for AGIs below $25k, 11.4% for AGIs $25k-50k, 11.4% for AGIs $75k-100k, 31.2% for AGIs $100k-200k)
Ordinary dividends: $1,825 (reported on 10.5% of returns)
Here:
$1,825
State:
$5,827
(% of AGI for various income ranges: 25.9% for AGIs below $25k, 17.5% for AGIs $50k-75k, 110.0% for AGIs $100k-200k)
Net capital gain/loss in AGI: +$5,675 (reported on 10.5% of returns)
Here:
+$5,675
State:
+$17,730
(% of AGI for various income ranges: 0.6% for AGIs below $25k, 47.1% for AGIs $25k-50k, 483.8% for AGIs $100k-200k)
Profit/loss from business: +$17,664 (reported on 18.4% of returns)
Here:
+$17,664
State:
+$12,144
(% of AGI for various income ranges: 150.6% for AGIs below $25k, 460.0% for AGIs $25k-50k, 1075.0% for AGIs $50k-75k, 891.2% for AGIs $100k-200k)
Taxable individual retirement arrangement distribution: $17,040 (reported on 6.6% of returns)
47141:
$17,040
Indiana:
$18,302
(% of AGI for various income ranges: 162.9% for AGIs below $25k, 821.4% for AGIs $75k-100k)
Total itemized deductions: $31,850 (reported on 2.6% of returns)
Here:
$31,850
State:
$35,601
(% of AGI for various income ranges: 796.2% for AGIs $50k-75k)
Taxes paid: $9,000 (reported on 2.6% of returns)
47141:
$9,000
State:
$7,542
(% of AGI for various income ranges: 257.1% for AGIs $75k-100k)
Earned income credit: $1,991 (reported on 14.5% of returns)
Here:
$1,991
State:
$2,298
(% of AGI for various income ranges: 73.5% for AGIs below $25k, 67.1% for AGIs $25k-50k)
Percentage of individuals using paid preparers for their 2020 taxes: 94.7%
Here:
95%
State:
94%
(% for various income ranges: 95.8% for AGIs below $25k, 94.4% for AGIs $25k-50k, 90.9% for AGIs $50k-75k, 90.0% for AGIs $75k-100k, 100.0% for AGIs $100k-200k)
Averages for the 2012 tax year for zip code 47141, filed in 2013:
Average Adjusted Gross Income (AGI) in 2012: $46,187 (Individual Income Tax Returns)
Here:
$46,187
State:
$52,932
Salary/wage: $42,549 (reported on 83.1% of returns)
Here:
$42,549
State:
$45,173
(% of AGI for various income ranges: 67.6% for AGIs below $25k, 78.4% for AGIs $25k-50k, 81.2% for AGIs $50k-75k, 79.4% for AGIs $75k-100k, 71.4% for AGIs $100k-200k)
Taxable interest for individuals: $450 (reported on 33.8% of returns)
This zip code:
$450
Indiana:
$1,311
(% of AGI for various income ranges: 1.2% for AGIs below $25k, 0.4% for AGIs $25k-50k, 0.3% for AGIs $50k-75k, 0.2% for AGIs $75k-100k, 0.1% for AGIs $100k-200k)
Ordinary dividends: $829 (reported on 9.9% of returns)
Here:
$829
State:
$4,690
Net capital gain/loss in AGI: +$1,250 (reported on 8.5% of returns)
Here:
+$1,250
State:
+$10,406
Profit/loss from business: +$8,588 (reported on 11.3% of returns)
Here:
+$8,588
State:
+$11,105
Taxable individual retirement arrangement distribution: $9,175 (reported on 11.3% of returns)
47141:
$9,175
Indiana:
$13,841
(% of AGI for various income ranges: 2.8% for AGIs below $25k, 3.6% for AGIs $25k-50k, 5.3% for AGIs $50k-75k)
Total itemized deductions: $17,076 (22% of AGI, reported on 29.6% of returns)
Here:
$17,076
State:
$20,913
Here:
21.5% of AGI
State:
18.2% of AGI
(% of AGI for various income ranges: 13.6% for AGIs $25k-50k, 10.9% for AGIs $50k-75k, 11.2% for AGIs $75k-100k, 12.9% for AGIs $100k-200k)
Charity contributions: $2,600 (reported on 22.5% of returns)
Here:
$2,600
State:
$4,697
(% of AGI for various income ranges: 1.3% for AGIs $25k-50k, 1.3% for AGIs $50k-75k, 1.5% for AGIs $75k-100k, 1.5% for AGIs $100k-200k)
Taxes paid: $5,652 (reported on 29.6% of returns)
47141:
$5,652
State:
$7,456
(% of AGI for various income ranges: 2.7% for AGIs $25k-50k, 2.9% for AGIs $50k-75k, 4.1% for AGIs $75k-100k, 5.9% for AGIs $100k-200k)
Earned income credit: $2,125 (reported on 16.9% of returns)
Here:
$2,125
State:
$2,265
(% of AGI for various income ranges: 6.1% for AGIs below $25k, 1.1% for AGIs $25k-50k)
Percentage of individuals using paid preparers for their 2012 taxes: 66.2%
Here:
66%
State:
53%
(% for various income ranges: 61.5% for AGIs below $25k, 70.6% for AGIs $25k-50k, 69.2% for AGIs $50k-75k, 66.7% for AGIs $75k-100k, 66.7% for AGIs $100k-200k)
Averages for the 2004 tax year for zip code 47141, filed in 2005:
Average Adjusted Gross Income (AGI) in 2004: $39,579 (Individual Income Tax Returns)
Here:
$39,579
State:
$44,790
Salary/wage: $37,016 (reported on 87.4% of returns)
Here:
$37,016
State:
$39,615
(% of AGI for various income ranges: 98.8% for AGIs below $10k, 73.8% for AGIs $10k-25k, 84.1% for AGIs $25k-50k, 86.4% for AGIs $50k-75k, 91.1% for AGIs $75k-100k, 61.6% for AGIs over 100k)
Taxable interest for individuals: $890 (reported on 42.0% of returns)
This zip code:
$890
Indiana:
$1,535
(% of AGI for various income ranges: 3.5% for AGIs below $10k, 1.2% for AGIs $10k-25k, 1.6% for AGIs $25k-50k, 0.6% for AGIs $50k-75k, 0.2% for AGIs $75k-100k, 0.7% for AGIs over 100k)
Taxable dividends: $899 (reported on 13.8% of returns)
Here:
$899
State:
$2,998
(% of AGI for various income ranges: 1.0% for AGIs below $10k, 0.1% for AGIs $10k-25k, 0.3% for AGIs $25k-50k, 0.1% for AGIs $50k-75k, 0.1% for AGIs $75k-100k, 1.1% for AGIs over 100k)
Net capital gain/loss: +$5,329 (reported on 11.0% of returns)
Here:
+$5,329
State:
+$8,619
(% of AGI for various income ranges: -0.2% for AGIs $10k-25k, 0.5% for AGIs $25k-50k, 0.7% for AGIs $50k-75k, 7.4% for AGIs over 100k)
Profit/loss from business: +$6,730 (reported on 14.0% of returns)
Here:
+$6,730
State:
+$10,071
(% of AGI for various income ranges: -0.4% for AGIs below $10k, 6.0% for AGIs $10k-25k, 5.1% for AGIs $25k-50k, 1.4% for AGIs $50k-75k)
IRA payment deduction: $2,250 (reported on 2.2% of returns)
47141:
$2,250
Indiana:
$2,840
Total itemized deductions: $14,108 (21% of AGI, reported on 29.7% of returns)
Here:
$14,108
State:
$17,065
Here:
21.1% of AGI
State:
19.5% of AGI
(% of AGI for various income ranges: 6.7% for AGIs $10k-25k, 8.9% for AGIs $25k-50k, 11.4% for AGIs $50k-75k, 12.9% for AGIs $75k-100k, 13.1% for AGIs over 100k)
Charity contributions deductions: $2,404 (4% of AGI, reported on 23.2% of returns)
Here:
$2,404
State:
$3,550
Here:
3.6% of AGI
State:
3.8% of AGI
(% of AGI for various income ranges: 0.7% for AGIs $10k-25k, 1.2% for AGIs $25k-50k, 1.6% for AGIs $50k-75k, 1.8% for AGIs $75k-100k, 1.5% for AGIs over 100k)
Total tax: $4,539 (reported on 77.3% of returns)
47141:
$4,539
State:
$6,914
(% of AGI for various income ranges: 1.9% for AGIs below $10k, 5.1% for AGIs $10k-25k, 6.6% for AGIs $25k-50k, 8.2% for AGIs $50k-75k, 10.2% for AGIs $75k-100k, 16.0% for AGIs over 100k)
Earned income credit: $1,604 (reported on 12.7% of returns)
Here:
$1,604
State:
$1,685
Percentage of individuals using paid preparers for their 2004 taxes: 68.7%
Here:
69%
State:
59%
(% for various income ranges: 53.8% for AGIs below $10k, 68.6% for AGIs $10k-25k, 73.7% for AGIs $25k-50k, 70.6% for AGIs $50k-75k, 66.0% for AGIs $75k-100k, 92.9% for AGIs over 100k)
Household received Food Stamps/SNAP in the past 12 months: 24 Household did not receive Food Stamps/SNAP in the past 12 months: 646
Women who had a birth in the past 12 months: 49 (0 now married, 42 unmarried) Women who did not have a birth in the past 12 months: 341 (200 now married, 142 unmarried)
Housing units in zip code 47141 with a mortgage: 350 (43 second mortgage, 36 both second mortgage and home equity loan) Houses without a mortgage: 31
Median monthly owner costs for units with a mortgage: $1,193 Median monthly owner costs for units without a mortgage: $426
Residents with income below the poverty level in 2022:
This zip code:
3.3%
Whole state:
12.6%
Residents with income below 50% of the poverty level in 2022:
This zip code:
2.3%
Whole state:
6.3%
Median number of rooms in houses and condos:
Here:
5.8
State:
6.6
Median number of rooms in apartments:
Here:
4.9
State:
4.3
Notable locations in this zip code not listed on our city pages
Size of family households: 200 2-persons, 140 3-persons, 50 4-persons, 23 5-persons, 22 6-persons, 9 7-or-more-persons
Size of nonfamily households: 215 1-person, 11 2-persons
162 married couples with children.
125 single-parent households (24 men, 101 women).
92.9% of residents of 47141 zip code speak English at home.
8.1% of residents speak Spanish at home (38% very well, 25% well, 38% not well).
Foreign born population: 80 (4.6%) (11.1% of them are naturalized citizens)
This zip code:
4.6%
Whole state:
6.1%
61%Honduras
18%Costa Rica
31%English
20%American
12%German
12%Irish
5%European
1%Eastern European
1%French
Year of entry for the foreign-born population
02010 or later
502000 to 2009
251990 to 1999
0Before 1990
Housing units lacking complete kitchen facilities: 3.5%
55.9%Electricity
29.5%Bottled, tank, or LP gas
8.9%Wood
4.3%Fuel oil, kerosene, etc.
1.8%Utility gas
Population in 1990: 828. Population change in the 1990s: +586 (+70.8%).
Place of birth for U.S.-born residents:
This state: 1,024
Northeast: 16
Midwest: 62
South: 495
West: 49
68% of the 47141 zip code residents lived in the same house 5 years ago. Out of people who lived in different houses, 64% lived in this county. Out of people who lived in different counties, 50% lived in Indiana.
90% of the 47141 zip code residents lived in the same house 1 year ago. Out of people who lived in different houses, 64% moved from this county. Out of people who lived in different houses, 8% moved from different county within same state. Out of people who lived in different houses, 26% moved from different state.
Private vs. public school enrollment:
Students in private schools in grades 1 to 8 (elementary and middle school): 24
Here:
11.0%
Indiana:
14.9%
Students in private schools in grades 9 to 12 (high school): 9
Here:
14.3%
Indiana:
11.4%
Students in private undergraduate colleges: 13
Here:
18.4%
Indiana:
22.3%
Occupation by median earnings in the past 12 months ($)
126,394Sales and related occupations
119,816Management occupations
65,787Health diagnosing and treating practitioners and other technical occupations
58,280Office and administrative support occupations
55,526Installation, maintenance, and repair occupations
50,570Production occupations
Top industries in this zip code by the number of employees in 2005:
Administrative and Support and Waste Management and Remediation Services: Landscaping Services (1-4 employees: 3 establishments)
Construction: Electrical Contractors (1-4: 2)
Other Services (except Public Administration): Religious Organizations (1-4: 1)
Construction: All Other Specialty Trade Contractors (1-4: 1)
Utilities: Water Supply and Irrigation Systems (1-4: 1)
Construction: Painting and Wall Covering Contractors (1-4: 1)
People in group quarters in 2000:
17 people in nursing homes
Fatal accident statistics in 2011:
Fatal accident count: 1
Vehicles involved in fatal accidents: 1
Fatal accidents caused by drunken drivers: 1
Fatalities: 1
Persons involved in fatal accidents: 1
Pedestrians involved in fatal accidents: 0
Fatal accident statistics in 2010:
Fatal accident count: 1
Vehicles involved in fatal accidents: 2
Fatal accidents caused by drunken drivers: 0
Fatalities: 1
Persons involved in fatal accidents: 2
Pedestrians involved in fatal accidents: 0
Home Mortgage Disclosure Act Aggregated Statistics For Year 2009 (Based on 2 partial tracts)
A) FHA, FSA/RHS & VA Home Purchase Loans
B) Conventional Home Purchase Loans
C) Refinancings
D) Home Improvement Loans
F) Non-occupant Loans on < 5 Family Dwellings (A B C & D)
G) Loans On Manufactured Home Dwelling (A B C & D)
Number
Average Value
Number
Average Value
Number
Average Value
Number
Average Value
Number
Average Value
Number
Average Value
LOANS ORIGINATED
6
$110,433
3
$115,873
71
$108,021
7
$51,184
7
$66,693
11
$53,065
APPLICATIONS APPROVED, NOT ACCEPTED
0
$0
2
$142,960
6
$136,040
0
$0
0
$0
1
$37,960
APPLICATIONS DENIED
2
$134,655
7
$83,217
27
$123,386
4
$12,458
2
$63,770
4
$69,998
APPLICATIONS WITHDRAWN
1
$55,170
1
$39,740
12
$128,922
0
$0
0
$0
2
$79,190
FILES CLOSED FOR INCOMPLETENESS
0
$0
1
$25,510
4
$120,865
0
$0
1
$33,810
0
$0
Aggregated Statistics For Year 2008 (Based on 2 partial tracts)
A) FHA, FSA/RHS & VA Home Purchase Loans
B) Conventional Home Purchase Loans
C) Refinancings
D) Home Improvement Loans
F) Non-occupant Loans on < 5 Family Dwellings (A B C & D)
G) Loans On Manufactured Home Dwelling (A B C & D)
Number
Average Value
Number
Average Value
Number
Average Value
Number
Average Value
Number
Average Value
Number
Average Value
LOANS ORIGINATED
8
$120,271
14
$112,666
43
$108,928
7
$19,830
6
$122,892
11
$57,540
APPLICATIONS APPROVED, NOT ACCEPTED
1
$55,760
2
$103,215
5
$117,810
1
$53,390
1
$52,790
1
$83,050
APPLICATIONS DENIED
4
$90,760
3
$130,900
37
$132,524
9
$51,344
1
$8,900
7
$78,133
APPLICATIONS WITHDRAWN
1
$155,420
1
$18,390
8
$95,950
0
$0
1
$18,390
2
$93,430
FILES CLOSED FOR INCOMPLETENESS
0
$0
0
$0
4
$86,608
0
$0
0
$0
1
$97,280
Aggregated Statistics For Year 2007 (Based on 2 partial tracts)
A) FHA, FSA/RHS & VA Home Purchase Loans
B) Conventional Home Purchase Loans
C) Refinancings
D) Home Improvement Loans
F) Non-occupant Loans on < 5 Family Dwellings (A B C & D)
G) Loans On Manufactured Home Dwelling (A B C & D)
Number
Average Value
Number
Average Value
Number
Average Value
Number
Average Value
Number
Average Value
Number
Average Value
LOANS ORIGINATED
4
$84,085
23
$106,363
62
$114,698
11
$38,073
6
$80,873
14
$82,964
APPLICATIONS APPROVED, NOT ACCEPTED
1
$78,900
5
$61,692
9
$146,257
1
$93,730
1
$71,180
5
$60,032
APPLICATIONS DENIED
3
$87,990
11
$91,515
41
$113,128
10
$55,998
2
$51,905
10
$65,667
APPLICATIONS WITHDRAWN
1
$54,570
2
$101,435
14
$138,724
1
$179,740
1
$91,950
1
$54,570
FILES CLOSED FOR INCOMPLETENESS
0
$0
2
$116,265
8
$141,479
1
$156,600
1
$109,150
0
$0
Aggregated Statistics For Year 2006 (Based on 2 partial tracts)
A) FHA, FSA/RHS & VA Home Purchase Loans
B) Conventional Home Purchase Loans
C) Refinancings
D) Home Improvement Loans
F) Non-occupant Loans on < 5 Family Dwellings (A B C & D)
G) Loans On Manufactured Home Dwelling (A B C & D)
Number
Average Value
Number
Average Value
Number
Average Value
Number
Average Value
Number
Average Value
Number
Average Value
LOANS ORIGINATED
6
$126,450
27
$125,846
63
$85,251
11
$42,926
8
$172,176
20
$64,510
APPLICATIONS APPROVED, NOT ACCEPTED
1
$49,240
5
$100,132
8
$104,478
2
$35,890
1
$84,230
4
$85,718
APPLICATIONS DENIED
2
$122,495
15
$76,285
46
$101,489
5
$32,152
1
$99,660
15
$89,375
APPLICATIONS WITHDRAWN
1
$63,470
1
$76,520
15
$142,526
0
$0
1
$40,340
2
$85,715
FILES CLOSED FOR INCOMPLETENESS
0
$0
1
$65,850
11
$133,524
0
$0
0
$0
0
$0
Aggregated Statistics For Year 2005 (Based on 2 partial tracts)
A) FHA, FSA/RHS & VA Home Purchase Loans
B) Conventional Home Purchase Loans
C) Refinancings
D) Home Improvement Loans
F) Non-occupant Loans on < 5 Family Dwellings (A B C & D)
G) Loans On Manufactured Home Dwelling (A B C & D)
Number
Average Value
Number
Average Value
Number
Average Value
Number
Average Value
Number
Average Value
Number
Average Value
LOANS ORIGINATED
9
$109,610
35
$97,709
71
$93,742
17
$56,319
7
$87,116
25
$74,102
APPLICATIONS APPROVED, NOT ACCEPTED
2
$131,690
4
$68,662
14
$120,504
2
$92,835
1
$155,420
4
$74,002
APPLICATIONS DENIED
5
$122,556
11
$104,565
73
$97,496
9
$52,136
2
$50,125
18
$89,903
APPLICATIONS WITHDRAWN
1
$150,080
5
$105,116
34
$104,334
4
$113,745
2
$91,055
6
$99,855
FILES CLOSED FOR INCOMPLETENESS
1
$96,690
2
$129,910
18
$128,724
1
$18,390
1
$94,320
2
$142,960
Aggregated Statistics For Year 2004 (Based on 2 partial tracts)
A) FHA, FSA/RHS & VA Home Purchase Loans
B) Conventional Home Purchase Loans
C) Refinancings
D) Home Improvement Loans
F) Non-occupant Loans on < 5 Family Dwellings (A B C & D)
G) Loans On Manufactured Home Dwelling (A B C & D)
Number
Average Value
Number
Average Value
Number
Average Value
Number
Average Value
Number
Average Value
Number
Average Value
LOANS ORIGINATED
9
$106,512
36
$100,037
92
$93,339
12
$43,600
13
$89,482
21
$62,145
APPLICATIONS APPROVED, NOT ACCEPTED
1
$72,370
5
$104,404
20
$98,827
2
$83,940
0
$0
7
$75,844
APPLICATIONS DENIED
2
$90,465
17
$91,458
62
$123,070
7
$69,743
2
$102,325
13
$82,272
APPLICATIONS WITHDRAWN
2
$107,665
4
$80,082
28
$103,683
0
$0
1
$56,950
4
$69,405
FILES CLOSED FOR INCOMPLETENESS
0
$0
2
$81,565
11
$125,920
0
$0
0
$0
2
$94,615
Aggregated Statistics For Year 2003 (Based on 2 partial tracts)
A) FHA, FSA/RHS & VA Home Purchase Loans
B) Conventional Home Purchase Loans
C) Refinancings
D) Home Improvement Loans
F) Non-occupant Loans on < 5 Family Dwellings (A B C & D)
Number
Average Value
Number
Average Value
Number
Average Value
Number
Average Value
Number
Average Value
LOANS ORIGINATED
5
$114,014
29
$90,882
170
$95,592
12
$38,508
7
$55,167
APPLICATIONS APPROVED, NOT ACCEPTED
0
$0
5
$67,506
20
$86,844
2
$72,370
0
$0
APPLICATIONS DENIED
1
$138,220
11
$67,032
62
$94,194
4
$45,232
1
$56,350
APPLICATIONS WITHDRAWN
2
$64,360
5
$67,862
34
$92,958
1
$4,750
2
$72,665
FILES CLOSED FOR INCOMPLETENESS
0
$0
1
$52,790
6
$100,943
0
$0
0
$0
Aggregated Statistics For Year 2002 (Based on 2 partial tracts)
A) FHA, FSA/RHS & VA Home Purchase Loans
B) Conventional Home Purchase Loans
C) Refinancings
D) Home Improvement Loans
F) Non-occupant Loans on < 5 Family Dwellings (A B C & D)
Number
Average Value
Number
Average Value
Number
Average Value
Number
Average Value
Number
Average Value
LOANS ORIGINATED
4
$101,882
34
$78,599
126
$92,516
12
$17,005
14
$66,015
APPLICATIONS APPROVED, NOT ACCEPTED
1
$52,790
4
$72,222
30
$83,542
2
$39,450
1
$88,980
APPLICATIONS DENIED
2
$79,190
12
$59,468
47
$76,081
4
$26,545
1
$1,190
APPLICATIONS WITHDRAWN
0
$0
4
$64,808
18
$104,041
1
$11,270
1
$40,340
FILES CLOSED FOR INCOMPLETENESS
0
$0
4
$63,770
10
$114,606
1
$9,490
1
$47,460
Aggregated Statistics For Year 2001 (Based on 2 partial tracts)
A) FHA, FSA/RHS & VA Home Purchase Loans
B) Conventional Home Purchase Loans
C) Refinancings
D) Home Improvement Loans
F) Non-occupant Loans on < 5 Family Dwellings (A B C & D)
Number
Average Value
Number
Average Value
Number
Average Value
Number
Average Value
Number
Average Value
LOANS ORIGINATED
8
$88,090
23
$76,884
99
$79,093
23
$20,530
10
$28,533
APPLICATIONS APPROVED, NOT ACCEPTED
0
$0
7
$49,490
14
$76,396
1
$14,240
0
$0
APPLICATIONS DENIED
2
$68,810
14
$76,819
42
$82,765
4
$17,500
1
$1,190
APPLICATIONS WITHDRAWN
2
$107,370
2
$39,450
20
$87,824
1
$58,730
1
$84,830
FILES CLOSED FOR INCOMPLETENESS
1
$54,570
1
$36,190
6
$93,627
0
$0
1
$36,190
Aggregated Statistics For Year 2000 (Based on 2 partial tracts)
A) FHA, FSA/RHS & VA Home Purchase Loans
B) Conventional Home Purchase Loans
C) Refinancings
D) Home Improvement Loans
F) Non-occupant Loans on < 5 Family Dwellings (A B C & D)
Number
Average Value
Number
Average Value
Number
Average Value
Number
Average Value
Number
Average Value
LOANS ORIGINATED
5
$78,658
37
$80,146
72
$71,514
21
$14,124
8
$54,871
APPLICATIONS APPROVED, NOT ACCEPTED
1
$77,120
7
$61,354
17
$44,978
5
$25,744
2
$29,660
APPLICATIONS DENIED
2
$87,495
32
$66,105
31
$63,281
11
$30,900
3
$33,417
APPLICATIONS WITHDRAWN
1
$45,080
3
$64,857
23
$65,458
0
$0
1
$31,440
FILES CLOSED FOR INCOMPLETENESS
0
$0
1
$62,880
1
$11,270
0
$0
0
$0
Aggregated Statistics For Year 1999 (Based on 1 partial tract)
A) FHA, FSA/RHS & VA Home Purchase Loans
B) Conventional Home Purchase Loans
C) Refinancings
D) Home Improvement Loans
F) Non-occupant Loans on < 5 Family Dwellings (A B C & D)


 Nearest zip codes: 47163, 47147, 47111, 47138, 40026, 47162.