Estimated zip code population in 2022: 5,520 Zip code population in 2010: 5,755 Zip code population in 2000: 5,397
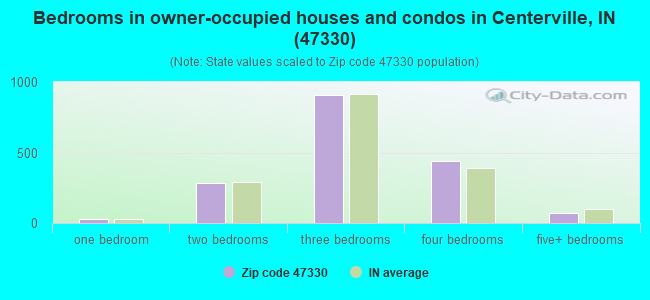
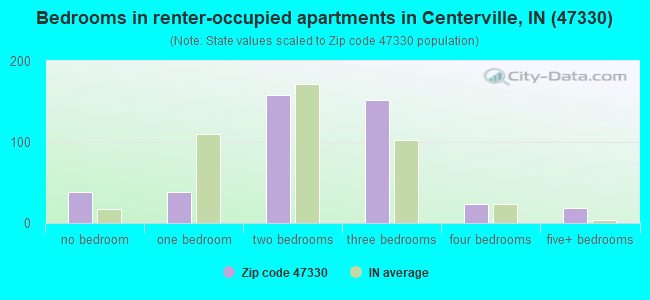
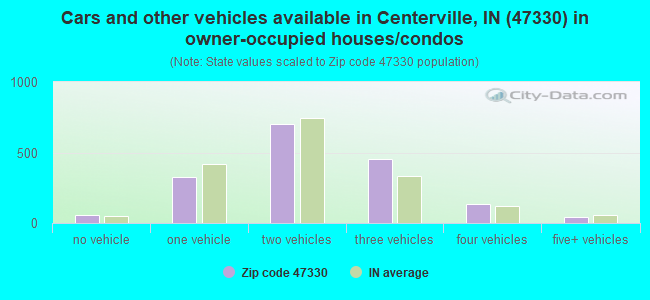
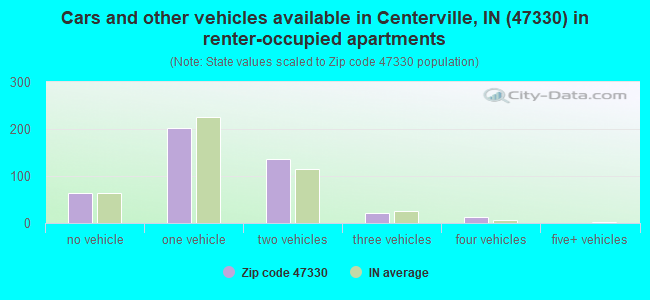
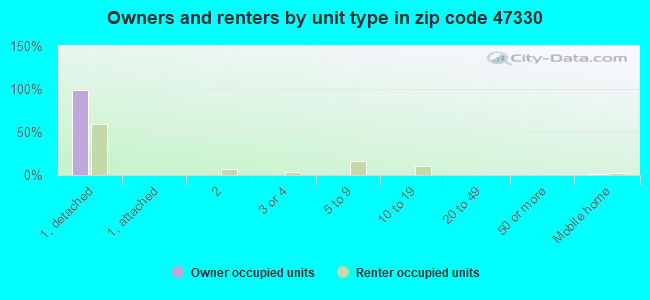
Houses and condos: 2,253 Renter-occupied apartments: 436
% of renters here:
20%
State:
29%
March 2022 cost of living index in zip code 47330: 85.8 (less than average, U.S. average is 100)
Land area: 59.4 sq. mi. Water area: 0.3 sq. mi.
Population density: 93 people per square mile
(very low).
OSM Map
General Map
Google Map
MSN Map
OSM Map
General Map
Google Map
MSN Map
OSM Map
General Map
Google Map
MSN Map
OSM Map
General Map
Google Map
MSN Map
Please wait while loading the map...
Real estate property taxes paid for housing units in 2022:
This zip code:
0.7% ($1,245)
Indiana:
0.7% ($1,467)
Median real estate property taxes paid for housing units with mortgages in 2022: $1,251 (0.7%) Median real estate property taxes paid for housing units with no mortgage in 2022: $1,280 (0.8%)
Estimated median house/condo value in 2022: $168,801
47330:
$168,801
Indiana:
$208,700
Median resident age:
This zip code:
40.8 years
Indiana median age:
38.2 years
Average household size:
This zip code:
2.5 people
Indiana:
2.4 people
Averages for the 2020 tax year for zip code 47330, filed in 2021:
Average Adjusted Gross Income (AGI) in 2020: $61,826 (Individual Income Tax Returns)
Here:
$61,826
State:
$64,978
Salary/wage: $52,320 (reported on 83.4% of returns)
Here:
$52,320
State:
$55,245
(% of AGI for various income ranges: 1158.9% for AGIs below $25k, 3428.0% for AGIs $25k-50k, 6534.7% for AGIs $50k-75k, 9710.5% for AGIs $75k-100k, 16280.5% for AGIs $100k-200k, 68895.0% for AGIs over 200k)
Taxable interest for individuals: $954 (reported on 30.0% of returns)
This zip code:
$954
Indiana:
$1,351
(% of AGI for various income ranges: 15.9% for AGIs below $25k, 14.1% for AGIs $25k-50k, 40.7% for AGIs $50k-75k, 28.6% for AGIs $75k-100k, 100.0% for AGIs $100k-200k, 925.0% for AGIs over 200k)
Ordinary dividends: $5,797 (reported on 14.6% of returns)
Here:
$5,797
State:
$5,827
(% of AGI for various income ranges: 18.6% for AGIs below $25k, 25.0% for AGIs $25k-50k, 56.7% for AGIs $50k-75k, 54.3% for AGIs $75k-100k, 225.3% for AGIs $100k-200k, 5945.0% for AGIs over 200k)
Net capital gain/loss in AGI: +$15,154 (reported on 13.8% of returns)
Here:
+$15,154
State:
+$17,730
(% of AGI for various income ranges: 7.5% for AGIs below $25k, 27.0% for AGIs $25k-50k, 70.7% for AGIs $50k-75k, 110.0% for AGIs $75k-100k, 447.9% for AGIs $100k-200k, 19085.0% for AGIs over 200k)
Profit/loss from business: +$14,615 (reported on 13.4% of returns)
Here:
+$14,615
State:
+$12,144
(% of AGI for various income ranges: 97.3% for AGIs below $25k, 97.1% for AGIs $25k-50k, 101.3% for AGIs $50k-75k, 257.6% for AGIs $75k-100k, 638.9% for AGIs $100k-200k, 9105.0% for AGIs over 200k)
Taxable individual retirement arrangement distribution: $17,648 (reported on 9.9% of returns)
47330:
$17,648
Indiana:
$18,302
(% of AGI for various income ranges: 70.2% for AGIs below $25k, 107.0% for AGIs $25k-50k, 209.7% for AGIs $50k-75k, 221.4% for AGIs $75k-100k, 748.9% for AGIs $100k-200k, 4515.0% for AGIs over 200k)
Total itemized deductions: $41,200 (reported on 3.2% of returns)
Here:
$41,200
State:
$35,601
(% of AGI for various income ranges: 113.9% for AGIs $25k-50k, 474.7% for AGIs $100k-200k, 8780.0% for AGIs over 200k)
Charity contributions: $21,329 (reported on 2.8% of returns)
Here:
$21,329
State:
$15,596
(% of AGI for various income ranges: 182.1% for AGIs $100k-200k, 5735.0% for AGIs over 200k)
Taxes paid: $8,113 (reported on 3.2% of returns)
47330:
$8,113
State:
$7,542
(% of AGI for various income ranges: 21.2% for AGIs $25k-50k, 122.1% for AGIs $100k-200k, 1490.0% for AGIs over 200k)
Earned income credit: $2,164 (reported on 16.6% of returns)
Here:
$2,164
State:
$2,298
(% of AGI for various income ranges: 95.0% for AGIs below $25k, 67.3% for AGIs $25k-50k)
Percentage of individuals using paid preparers for their 2020 taxes: 95.3%
Here:
95%
State:
94%
(% for various income ranges: 94.9% for AGIs below $25k, 95.5% for AGIs $25k-50k, 95.0% for AGIs $50k-75k, 96.6% for AGIs $75k-100k, 93.5% for AGIs $100k-200k, 100.0% for AGIs over 200k)
Averages for the 2012 tax year for zip code 47330, filed in 2013:
Average Adjusted Gross Income (AGI) in 2012: $48,237 (Individual Income Tax Returns)
Here:
$48,237
State:
$52,932
Salary/wage: $42,660 (reported on 81.7% of returns)
Here:
$42,660
State:
$45,173
(% of AGI for various income ranges: 68.6% for AGIs below $25k, 80.3% for AGIs $25k-50k, 82.2% for AGIs $50k-75k, 82.1% for AGIs $75k-100k, 76.5% for AGIs $100k-200k, 39.4% for AGIs over 200k)
Taxable interest for individuals: $826 (reported on 37.4% of returns)
This zip code:
$826
Indiana:
$1,311
(% of AGI for various income ranges: 1.5% for AGIs below $25k, 0.8% for AGIs $25k-50k, 0.3% for AGIs $50k-75k, 0.2% for AGIs $75k-100k, 0.9% for AGIs $100k-200k, 0.4% for AGIs over 200k)
Ordinary dividends: $3,800 (reported on 15.9% of returns)
Here:
$3,800
State:
$4,690
(% of AGI for various income ranges: 1.2% for AGIs below $25k, 0.8% for AGIs $25k-50k, 0.9% for AGIs $50k-75k, 0.3% for AGIs $75k-100k, 0.8% for AGIs $100k-200k, 3.6% for AGIs over 200k)
Net capital gain/loss in AGI: +$14,311 (reported on 11.0% of returns)
Here:
+$14,311
State:
+$10,406
(% of AGI for various income ranges: 0.2% for AGIs below $25k, 0.2% for AGIs $25k-50k, 0.6% for AGIs $75k-100k, 1.4% for AGIs $100k-200k, 17.2% for AGIs over 200k)
Profit/loss from business: +$11,438 (reported on 13.8% of returns)
Here:
+$11,438
State:
+$11,105
(% of AGI for various income ranges: 5.8% for AGIs below $25k, 2.9% for AGIs $25k-50k, 1.8% for AGIs $50k-75k, 2.5% for AGIs $75k-100k, 7.2% for AGIs $100k-200k)
Taxable individual retirement arrangement distribution: $11,503 (reported on 11.8% of returns)
47330:
$11,503
Indiana:
$13,841
(% of AGI for various income ranges: 4.8% for AGIs below $25k, 2.6% for AGIs $25k-50k, 3.0% for AGIs $50k-75k, 2.6% for AGIs $75k-100k, 4.3% for AGIs $100k-200k)
Total itemized deductions: $20,841 (20% of AGI, reported on 22.8% of returns)
Here:
$20,841
State:
$20,913
Here:
20.4% of AGI
State:
18.2% of AGI
(% of AGI for various income ranges: 7.3% for AGIs below $25k, 7.1% for AGIs $25k-50k, 7.7% for AGIs $50k-75k, 9.0% for AGIs $75k-100k, 14.2% for AGIs $100k-200k, 12.6% for AGIs over 200k)
Charity contributions: $5,676 (reported on 17.1% of returns)
Here:
$5,676
State:
$4,697
(% of AGI for various income ranges: 0.4% for AGIs below $25k, 0.9% for AGIs $25k-50k, 1.1% for AGIs $50k-75k, 1.4% for AGIs $75k-100k, 2.7% for AGIs $100k-200k, 5.1% for AGIs over 200k)
Taxes paid: $6,871 (reported on 22.8% of returns)
47330:
$6,871
State:
$7,456
(% of AGI for various income ranges: 1.0% for AGIs below $25k, 1.7% for AGIs $25k-50k, 2.0% for AGIs $50k-75k, 3.0% for AGIs $75k-100k, 5.5% for AGIs $100k-200k, 5.4% for AGIs over 200k)
Earned income credit: $2,224 (reported on 19.9% of returns)
Here:
$2,224
State:
$2,265
(% of AGI for various income ranges: 6.8% for AGIs below $25k, 1.2% for AGIs $25k-50k)
Percentage of individuals using paid preparers for their 2012 taxes: 51.6%
Here:
52%
State:
53%
(% for various income ranges: 50.0% for AGIs below $25k, 50.8% for AGIs $25k-50k, 56.4% for AGIs $50k-75k, 47.6% for AGIs $75k-100k, 52.6% for AGIs $100k-200k, 75.0% for AGIs over 200k)
Averages for the 2004 tax year for zip code 47330, filed in 2005:
Average Adjusted Gross Income (AGI) in 2004: $40,148 (Individual Income Tax Returns)
Here:
$40,148
State:
$44,790
Salary/wage: $37,179 (reported on 84.6% of returns)
Here:
$37,179
State:
$39,615
(% of AGI for various income ranges: 108.1% for AGIs below $10k, 71.8% for AGIs $10k-25k, 83.3% for AGIs $25k-50k, 85.7% for AGIs $50k-75k, 85.9% for AGIs $75k-100k, 59.6% for AGIs over 100k)
Taxable interest for individuals: $1,190 (reported on 47.1% of returns)
This zip code:
$1,190
Indiana:
$1,535
(% of AGI for various income ranges: 6.4% for AGIs below $10k, 2.9% for AGIs $10k-25k, 1.6% for AGIs $25k-50k, 0.7% for AGIs $50k-75k, 0.8% for AGIs $75k-100k, 1.4% for AGIs over 100k)
Taxable dividends: $1,401 (reported on 21.1% of returns)
Here:
$1,401
State:
$2,998
(% of AGI for various income ranges: 2.8% for AGIs below $10k, 1.7% for AGIs $10k-25k, 0.9% for AGIs $25k-50k, 0.4% for AGIs $50k-75k, 0.3% for AGIs $75k-100k, 0.6% for AGIs over 100k)
Net capital gain/loss: +$4,598 (reported on 15.6% of returns)
Here:
+$4,598
State:
+$8,619
(% of AGI for various income ranges: 2.0% for AGIs below $10k, 0.8% for AGIs $10k-25k, 0.9% for AGIs $25k-50k, 1.2% for AGIs $50k-75k, 1.3% for AGIs $75k-100k, 4.2% for AGIs over 100k)
Profit/loss from business: +$9,609 (reported on 14.9% of returns)
Here:
+$9,609
State:
+$10,071
(% of AGI for various income ranges: 5.1% for AGIs below $10k, 4.4% for AGIs $10k-25k, 2.2% for AGIs $25k-50k, 3.7% for AGIs $50k-75k, 1.9% for AGIs $75k-100k, 5.5% for AGIs over 100k)
IRA payment deduction: $2,533 (reported on 1.8% of returns)
47330:
$2,533
Indiana:
$2,840
Total itemized deductions: $15,947 (20% of AGI, reported on 27.4% of returns)
Here:
$15,947
State:
$17,065
Here:
20.4% of AGI
State:
19.5% of AGI
(% of AGI for various income ranges: 6.4% for AGIs below $10k, 7.0% for AGIs $10k-25k, 8.9% for AGIs $25k-50k, 10.6% for AGIs $50k-75k, 14.4% for AGIs $75k-100k, 12.6% for AGIs over 100k)
Charity contributions deductions: $3,450 (4% of AGI, reported on 20.7% of returns)
Here:
$3,450
State:
$3,550
Here:
4.0% of AGI
State:
3.8% of AGI
(% of AGI for various income ranges: 0.8% for AGIs $10k-25k, 0.9% for AGIs $25k-50k, 1.4% for AGIs $50k-75k, 2.2% for AGIs $75k-100k, 3.4% for AGIs over 100k)
Total tax: $5,586 (reported on 72.5% of returns)
47330:
$5,586
State:
$6,914
(% of AGI for various income ranges: 2.8% for AGIs below $10k, 3.9% for AGIs $10k-25k, 6.0% for AGIs $25k-50k, 7.9% for AGIs $50k-75k, 10.3% for AGIs $75k-100k, 19.8% for AGIs over 100k)
Earned income credit: $1,552 (reported on 15.9% of returns)
Here:
$1,552
State:
$1,685
Percentage of individuals using paid preparers for their 2004 taxes: 58.1%
Here:
58%
State:
59%
(% for various income ranges: 49.5% for AGIs below $10k, 59.2% for AGIs $10k-25k, 61.1% for AGIs $25k-50k, 60.1% for AGIs $50k-75k, 59.9% for AGIs $75k-100k, 66.7% for AGIs over 100k)
Likely homosexual households (counted as self-reported same-sex unmarried-partner households)
Lesbian couples: 0.0% of all households
Gay men: 0.1% of all households
Household received Food Stamps/SNAP in the past 12 months: 186 Household did not receive Food Stamps/SNAP in the past 12 months: 1,970
Women who had a birth in the past 12 months: 81 (45 now married, 33 unmarried) Women who did not have a birth in the past 12 months: 1,182 (559 now married, 624 unmarried)
Housing units in zip code 47330 with a mortgage: 1,231 (146 second mortgage, 9 home equity loan, 105 both second mortgage and home equity loan) Houses without a mortgage: 57
Median monthly owner costs for units with a mortgage: $1,117 Median monthly owner costs for units without a mortgage: $517
Residents with income below the poverty level in 2022:
This zip code:
11.1%
Whole state:
12.6%
Residents with income below 50% of the poverty level in 2022:
This zip code:
6.0%
Whole state:
6.3%
Median number of rooms in houses and condos:
Here:
6.6
State:
6.6
Median number of rooms in apartments:
Here:
5.1
State:
4.3
Notable locations in this zip code not listed on our city pages
Notable locations in zip code 47330: Centerville Fire and Rescue (A), Abington Township Fire Department (B), Abington Township Volunteer Fire Department (C). Display/hide their locations on the map
Cemeteries: West Grove Cemetery (1), Crown Hill Cemetery (2), Locust Grove Cemetery (3), United Brethren Cemetery (4). Display/hide their locations on the map
Streams, rivers, and creeks: Warm Run (A), Point Run (B), Pinhook Drain (C), Winter Run (D), Snow Run Brook (E), Sleet Brook (F), Free Run (G), Far Run (H), Crown Creek (I). Display/hide their locations on the map
In group quarters: 127 (-1 institutionalized population)
Size of family households: 766 2-persons, 262 3-persons, 300 4-persons, 207 5-persons, 13 6-persons, 26 7-or-more-persons
Size of nonfamily households: 508 1-person, 70 2-persons
858 married couples with children.
346 single-parent households (83 men, 263 women).
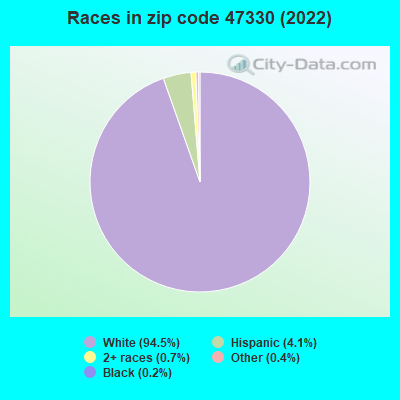
94.5% of residents of 47330 zip code speak English at home.
4.1% of residents speak Spanish at home (84% very well, 12% well, 4% not well).
0.9% of residents speak other Indo-European language at home (49% very well, 51% well).
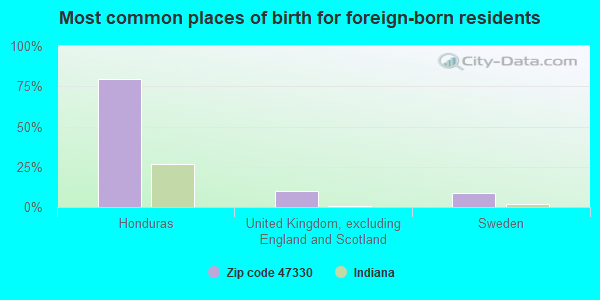
Foreign born population: 69 (1.3%) (55.2% of them are naturalized citizens)
This zip code:
1.3%
Whole state:
6.1%
80%Honduras
10%United Kingdom, excluding England and Scotland
9%Sweden
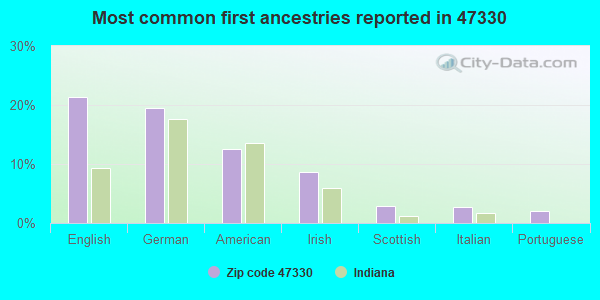
21%English
19%German
13%American
9%Irish
3%Scottish
3%Italian
2%Portuguese
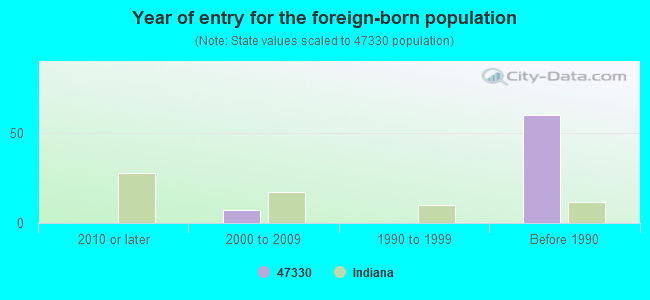
Year of entry for the foreign-born population
02010 or later
72000 to 2009
01990 to 1999
60Before 1990
Facilities with environmental interests located in this zip code:
CENTERVILLE REST AREA I 70 (I 70 & SR 1 9 MI E in CENTERVILLE, IN)
STATE MASTER (Indiana facility tracking) - IN-NPDES-IN0031321, National Pollutant Discharge Elimination System Permit National Pollutant Discharge Elimination System NON-MAJOR (Tracking pollutant discharge elimination systems) - permit Business SIC classification: REGULATION AND ADMINISTRATION OF TRANSPORTATION PROGRAMS Organizations: CLYDE MASON CERT 5570 (CONTACT/OPERATOR)
, INDOT (CONTACT/OWNER)
CHEMREX INC (519 W WATER ST in CENTERVILLE, IN)
STATE MASTER (Indiana facility tracking) - ACES-OP-17700062, AIR PROGRAM, CRTK-1212, EPCRA, LUST-199006555, LEAKING STORAGE TANK, UST-6579, UNDERGROUND STORAGE TANK PROGRAM CRITERIA AND HAZARDOUS AIR POLLUTANT INVENTORY (Inventory of air pollution sources) HAZARDOUS WASTE BIENNIAL REPORTER (Resource Conservation and Recovery Act (tracking hazardous waste)) (Resource Conservation and Recovery Act (tracking hazardous waste)) TRI REPORTER (Tracking of toxic chemicals releasing facilities) Business SIC classification: PAINTS, VARNISHES, LACQUERS, ENAMELS, AND ALLIED PRODUCTS Business NAICS classification: PAINT AND COATING MANUFACTURING. Alternative names: DEGUSSA CONSTRUCTION CHEMICALS, THORO SYS. PRODS. INC.
CENTERVILLE MUNICIPAL WWTP (816 N MCMINN RD in CENTERVILLE, IN)
STATE MASTER (Indiana facility tracking) - CRTK-1376, EPCRA, CRTK-3364, National Pollutant Discharge Elimination System NON-MAJOR (Tracking pollutant discharge elimination systems) - permit Business SIC classification: SEWERAGE SYSTEMS Organizations: JAY WERKING CERT OPER (CONTACT/OPERATOR)
, CENTERVILLE MUNICIPAL STP (CONTACT/OWNER)
Alternative names: CENTERVILLE MUNICIPAL STP, TOWN OF CENTERVILLE STP
CENTERVILLE ABINGTON SCHOOL BUS GARAGE (115 W SOUTH ST in CENTERVILLE, IN)
STATE MASTER (Indiana facility tracking) - CRTK-10019, EPCRA, LUST-199407534, LEAKING STORAGE TANK, UST-3426, UNDERGROUND STORAGE TANK PROGRAM COMPLIANCE ACTIVITY (Tracking inspections of insecticide, fungicide, and rodenticide, and toxic substances) Alternative names: CENTERVILLE ABINGTON COMM SCH CORP
CENTERVILLE ELEMENTARY SCHOOL (200-300 W SOUTH ST in CENTERVILLE, IN)
(National Center for Education Statistics) - STATE ID-8983 Organizations: CENTERVILLE-ABINGTON COM SCHS (SCHOOL DISTRICT)
CENTERVILLE JR HIGH SCHOOL (509 WILLOW GROVE RD in CENTERVILLE, IN)
(National Center for Education Statistics) - STATE ID-8982 Organizations: CENTERVILLE-ABINGTON COM SCHS (SCHOOL DISTRICT)
ROSE HAMILTON ELEMENTARY SCH (1281 ROUND BARN RD S in CENTERVILLE, IN)
(National Center for Education Statistics) - STATE ID-8984 Organizations: CENTERVILLE-ABINGTON COM SCHS (SCHOOL DISTRICT)
POWER TRAIN (5221 US RT 40 E in CENTERVILLE, IN)
STATE MASTER (Indiana facility tracking) (Resource Conservation and Recovery Act (tracking hazardous waste))
REICHARTS AUTO BODY (204 E SCHOOL ST in CENTERVILLE, IN)
STATE MASTER (Indiana facility tracking) (Resource Conservation and Recovery Act (tracking hazardous waste)) Organizations: REICHART CHARLES A (CONTACT/OWNER)
Housing units lacking complete plumbing facilities: 0.5% Housing units lacking complete kitchen facilities: 2.6%
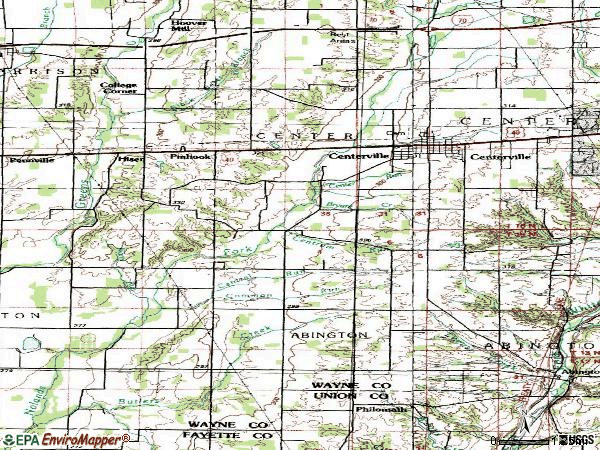
36.5%Utility gas
26.4%Electricity
24.3%Bottled, tank, or LP gas
6.1%Wood
3.9%Fuel oil, kerosene, etc.
2.1%Other fuel
0.6%No fuel used
Population in 1990: 5,475.
Place of birth for U.S.-born residents:
This state: 4,270
Northeast: 159
Midwest: 592
South: 335
West: 54
66% of the 47330 zip code residents lived in the same house 5 years ago. Out of people who lived in different houses, 71% lived in this county. Out of people who lived in different counties, 50% lived in Indiana.
83% of the 47330 zip code residents lived in the same house 1 year ago. Out of people who lived in different houses, 57% moved from this county. Out of people who lived in different houses, 6% moved from different county within same state. Out of people who lived in different houses, 31% moved from different state. Out of people who lived in different houses, 3% moved from abroad.
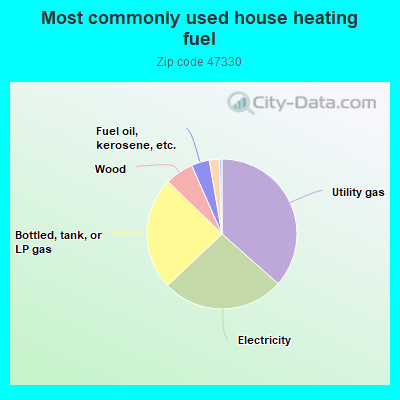
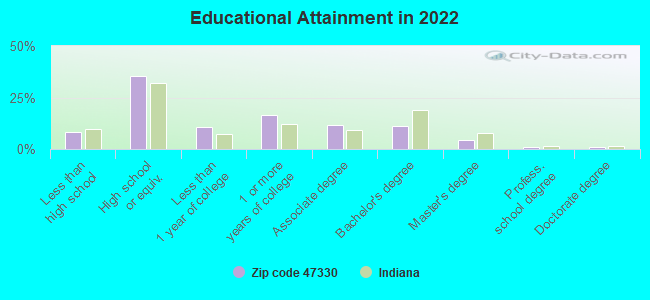
Private vs. public school enrollment:
Students in private schools in grades 1 to 8 (elementary and middle school): 36
Here:
6.0%
Indiana:
14.9%
Students in private schools in grades 9 to 12 (high school): 92
Here:
19.7%
Indiana:
11.4%
Students in private undergraduate colleges: 9
Here:
5.3%
Indiana:
22.3%
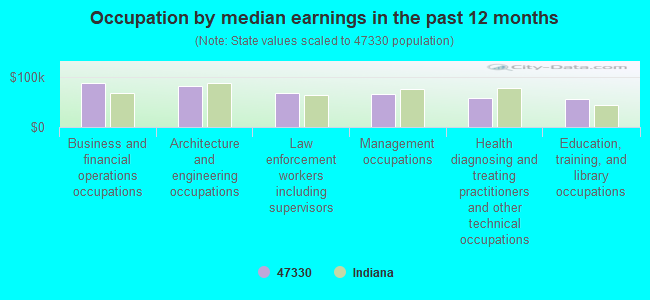
Occupation by median earnings in the past 12 months ($)
88,288Business and financial operations occupations
82,148Architecture and engineering occupations
68,924Law enforcement workers including supervisors
65,695Management occupations
59,085Health diagnosing and treating practitioners and other technical occupations
55,224Education, training, and library occupations
Companies with federal contracts located in this zip code:
GOLDEN ENGINEERING, INC (6364 MEANS ROAD in CENTERVILLE, IN; small business) : $6,870,647 in 95 contractsfrom 1999 to 2006
Contracts for Hazard-Detecting Instruments and Apparatus, Miscellaneous Items, Physical Properties Testing and Inspection, X-Ray Equipment and Supplies: Medical, Dental, Veterinary, and moreby Navy, Department of State, Federal Bureau of Investigation, Department of Defense, and others Signed by year:2000: $901,490; 2001: $2,203,783; 2002: $1,317,032; 2003: $523,750; 2004: $358,543; 2005: $491,640; 2006: $1,037,409.
Biggest contracts:
$1,087,800 with Navy for Hazard-Detecting Instruments and Apparatus. Signed on 2001-03-21. Completion date: 2001-09-21.
$810,300, same as above.Signed on 2000-06-01. Completion date: 2000-12-29.
$600,000, same as above.Signed on 2001-11-20. Completion date: 2002-11-30.
$449,620 with Department of State for Miscellaneous Items. Taking place in VA. Signed on 2006-05-15. Completion date: 2006-09-30.
CTRE COM ACTION SOCIALE DE FER (No data from D and B in FERRENSAC, In; small business) : $36,000 in 3 contractsin 2002
$32,000 with Agency for International Development (disused code: now 7200) for Personal Services Contracts. Taking place in DC. Signed on 2002-07-15. Completion date: 2004-07-15.
$4,000, same as above.Signed on 2002-07-15. Completion date: 2004-07-15.
$0, same as above.Signed on 2002-07-15. Completion date: 2004-07-15.
Top industries in this zip code by the number of employees in 2005:
Health Care and Social Assistance: Nursing Care Facilities (100-249 employees: 1 establishment)
Accommodation and Food Services: Hotels (except Casino Hotels) and Motels (50-99: 1, 1-4: 2)
Other Services (except Public Administration): General Automotive Repair (50-99: 1, 1-4: 1)
Accommodation and Food Services: Cafeterias (10-19: 1, 5-9: 3)
Construction: New Single-Family Housing Construction (except Operative Builders) (10-19: 1, 5-9: 1, 1-4: 1)
People in group quarters in 2010:
27 people in emergency and transitional shelters (with sleeping facilities) for people experiencing homelessness
People in group quarters in 2000:
105 people in nursing homes
Fatal accident statistics in 2014:
Fatal accident count: 2
Vehicles involved in fatal accidents: 3
Fatal accidents caused by drunken drivers: 1
Fatalities: 2
Persons involved in fatal accidents: 2
Pedestrians involved in fatal accidents: 1
Fatal accident statistics in 2013:
Fatal accident count: 2
Vehicles involved in fatal accidents: 2
Fatal accidents caused by drunken drivers: 0
Fatalities: 3
Persons involved in fatal accidents: 5
Pedestrians involved in fatal accidents: 0
2002 - 2018 National Fire Incident Reporting System (NFIRS) incidents
According to the data from the years 2002 - 2018 the average number of fire incidents per year is 37. The highest number of fire incidents - 70 took place in 2004, and the least - 1 in 2014. The data has a dropping trend.
When looking into fire subcategories, the most incidents belonged to: Structure Fires (46.7%), and Outside Fires (31.2%).
Fire incident types reported to NFIRS in Zip Code 47330

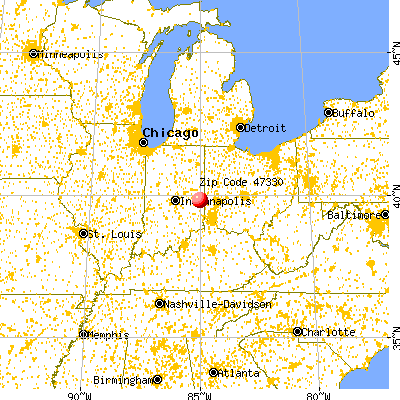


 Nearest zip codes: 47325, 47345, 47357, 47374, 47327, 47339.


 According to the data from the years 2002 - 2018 the average number of fire incidents per year is 37. The highest number of fire incidents - 70 took place in 2004, and the least - 1 in 2014. The data has a dropping trend.
 When looking into fire subcategories, the most incidents belonged to: Structure Fires (46.7%), and Outside Fires (31.2%).