Estimated zip code population in 2022: 1,447 Zip code population in 2010: 1,448 Zip code population in 2000: 1,301
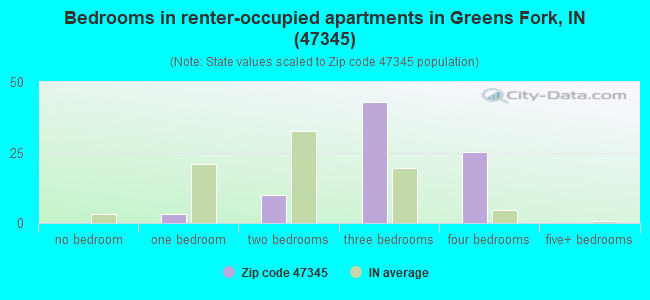
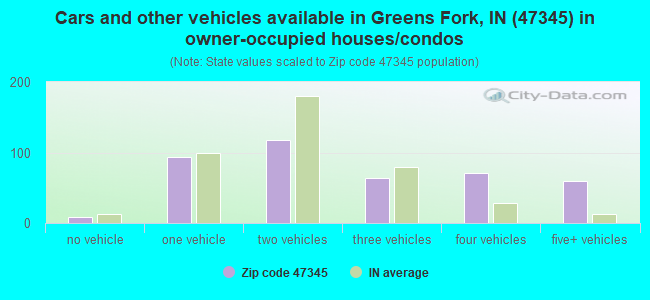
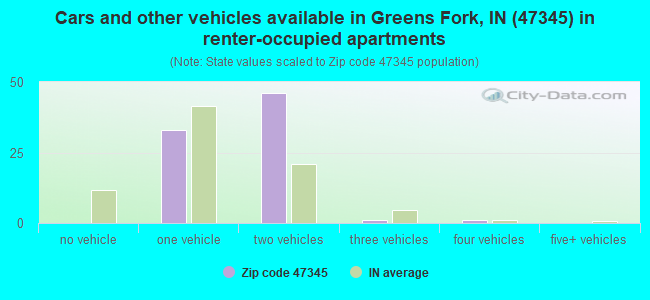
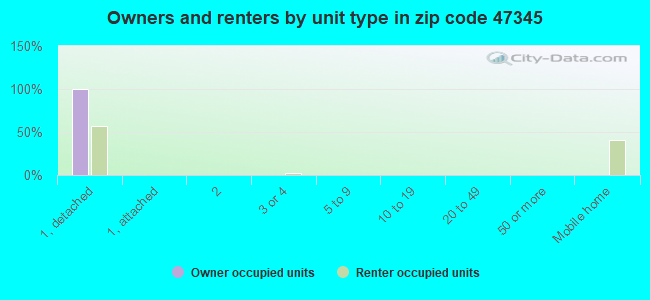
Houses and condos: 545 Renter-occupied apartments: 81
% of renters here:
16%
State:
29%
March 2022 cost of living index in zip code 47345: 84.9 (less than average, U.S. average is 100)
Land area: 29.7 sq. mi. Water area: 0.1 sq. mi.
Population density: 49 people per square mile
(very low).
OSM Map
General Map
Google Map
MSN Map
OSM Map
General Map
Google Map
MSN Map
OSM Map
General Map
Google Map
MSN Map
OSM Map
General Map
Google Map
MSN Map
Please wait while loading the map...
Real estate property taxes paid for housing units in 2022:
This zip code:
1.0% ($1,477)
Indiana:
0.7% ($1,467)
Median real estate property taxes paid for housing units with mortgages in 2022: $1,479 (0.9%) Median real estate property taxes paid for housing units with no mortgage in 2022: $1,551 (1.7%)
Business Search- 14 Million verified businesses
Males: 752
(52.0%)
Females: 694
(48.0%)
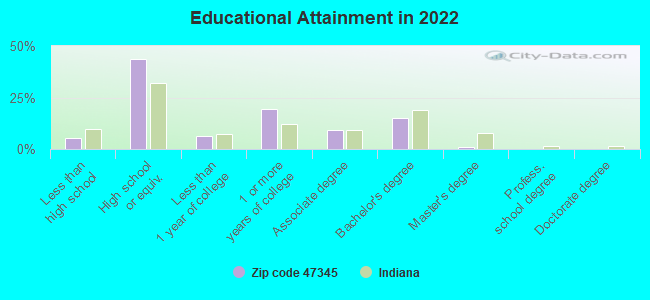
For population 25 years and over in 47345:
High school or higher: 92.5%
Bachelor's degree or higher: 15.7%
Graduate or professional degree: 1.0%
Unemployed: 1.6%
Mean travel time to work (commute): 24.1 minutes
For population 15 years and over in 47345:
Never married: 35.2%
Now married: 55.2%
Separated: 0.4%
Widowed: 2.9%
Divorced: 6.3%
Zip code 47345 compared to state average:
Unemployed percentage below state average.
Black race population percentage significantly below state average.
Hispanic race population percentage significantly below state average.
Foreign-born population percentage significantly below state average.
Renting percentage below state average.
Length of stay since moving in significantly above state average.
House age above state average.
Percentage of population with a bachelor's degree or higher below state average.
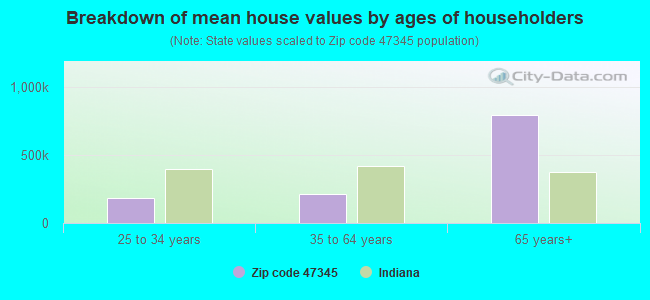
Estimated median house/condo value in 2022: $144,703
47345:
$144,703
Indiana:
$208,700
According to our research of Indiana and other state lists, there was 1 registered sex offender living in 47345 zip code as of May 28, 2024. The ratio of all residents to sex offenders in zip code 47345 is 1,383 to 1. The ratio of registered sex offenders to all residents in this zip code is much lower than the state average.
Median resident age:
This zip code:
38.4 years
Indiana median age:
38.2 years
Average household size:
This zip code:
2.9 people
Indiana:
2.4 people
Averages for the 2020 tax year for zip code 47345, filed in 2021:
Average Adjusted Gross Income (AGI) in 2020: $56,516 (Individual Income Tax Returns)
Here:
$56,516
State:
$64,978
Salary/wage: $49,031 (reported on 78.7% of returns)
Here:
$49,031
State:
$55,245
(% of AGI for various income ranges: 1130.0% for AGIs below $25k, 3764.5% for AGIs $25k-50k, 6853.3% for AGIs $50k-75k, 10816.7% for AGIs $75k-100k, 17425.0% for AGIs $100k-200k)
Taxable interest for individuals: $720 (reported on 32.8% of returns)
This zip code:
$720
Indiana:
$1,351
(% of AGI for various income ranges: 19.3% for AGIs below $25k, 20.9% for AGIs $25k-50k, 10.0% for AGIs $50k-75k, 90.0% for AGIs $75k-100k, 101.7% for AGIs $100k-200k)
Ordinary dividends: $2,567 (reported on 14.8% of returns)
Here:
$2,567
State:
$5,827
(% of AGI for various income ranges: 17.9% for AGIs below $25k, 35.5% for AGIs $25k-50k, 58.3% for AGIs $50k-75k, 220.0% for AGIs $100k-200k)
Net capital gain/loss in AGI: +$6,590 (reported on 16.4% of returns)
Here:
+$6,590
State:
+$17,730
(% of AGI for various income ranges: 81.8% for AGIs $25k-50k, 321.7% for AGIs $50k-75k, 626.7% for AGIs $100k-200k)
Profit/loss from business: +$8,025 (reported on 13.1% of returns)
Here:
+$8,025
State:
+$12,144
(% of AGI for various income ranges: 47.1% for AGIs below $25k, 404.5% for AGIs $25k-50k, 436.7% for AGIs $75k-100k)
Taxable individual retirement arrangement distribution: $8,500 (reported on 9.8% of returns)
47345:
$8,500
Indiana:
$18,302
(% of AGI for various income ranges: 192.9% for AGIs below $25k, 400.0% for AGIs $50k-75k)
Earned income credit: $2,478 (reported on 14.8% of returns)
Here:
$2,478
State:
$2,298
(% of AGI for various income ranges: 95.7% for AGIs below $25k, 80.9% for AGIs $25k-50k)
Percentage of individuals using paid preparers for their 2020 taxes: 93.4%
Here:
93%
State:
94%
(% for various income ranges: 95.0% for AGIs below $25k, 93.8% for AGIs $25k-50k, 100.0% for AGIs $50k-75k, 83.3% for AGIs $75k-100k, 90.0% for AGIs $100k-200k)
Averages for the 2012 tax year for zip code 47345, filed in 2013:
Average Adjusted Gross Income (AGI) in 2012: $48,341 (Individual Income Tax Returns)
Here:
$48,341
State:
$52,932
Salary/wage: $40,327 (reported on 82.8% of returns)
Here:
$40,327
State:
$45,173
(% of AGI for various income ranges: 66.6% for AGIs below $25k, 70.0% for AGIs $25k-50k, 80.9% for AGIs $50k-75k, 76.3% for AGIs $75k-100k, 58.9% for AGIs $100k-200k)
Taxable interest for individuals: $577 (reported on 37.9% of returns)
This zip code:
$577
Indiana:
$1,311
(% of AGI for various income ranges: 0.7% for AGIs below $25k, 0.9% for AGIs $25k-50k, 0.3% for AGIs $75k-100k, 0.3% for AGIs $100k-200k)
Ordinary dividends: $1,040 (reported on 17.2% of returns)
Here:
$1,040
State:
$4,690
(% of AGI for various income ranges: 1.1% for AGIs $25k-50k, 0.3% for AGIs $50k-75k, 0.2% for AGIs $100k-200k)
Net capital gain/loss in AGI: +$4,600 (reported on 15.5% of returns)
Here:
+$4,600
State:
+$10,406
(% of AGI for various income ranges: 1.6% for AGIs $25k-50k, 3.5% for AGIs $100k-200k)
Profit/loss from business: +$5,175 (reported on 13.8% of returns)
Here:
+$5,175
State:
+$11,105
(% of AGI for various income ranges: 5.3% for AGIs below $25k, 2.7% for AGIs $25k-50k, 2.0% for AGIs $50k-75k)
Taxable individual retirement arrangement distribution: $7,317 (reported on 10.3% of returns)
47345:
$7,317
Indiana:
$13,841
Total itemized deductions: $16,382 (17% of AGI, reported on 19.0% of returns)
Here:
$16,382
State:
$20,913
Here:
17.0% of AGI
State:
18.2% of AGI
(% of AGI for various income ranges: 6.5% for AGIs $25k-50k, 5.3% for AGIs $50k-75k, 7.8% for AGIs $75k-100k, 8.3% for AGIs $100k-200k)
Charity contributions: $2,686 (reported on 12.1% of returns)
Here:
$2,686
State:
$4,697
Taxes paid: $6,445 (reported on 19.0% of returns)
47345:
$6,445
State:
$7,456
(% of AGI for various income ranges: 1.5% for AGIs $25k-50k, 1.8% for AGIs $50k-75k, 2.9% for AGIs $75k-100k, 4.2% for AGIs $100k-200k)
Earned income credit: $2,170 (reported on 17.2% of returns)
Here:
$2,170
State:
$2,265
(% of AGI for various income ranges: 5.2% for AGIs below $25k, 1.2% for AGIs $25k-50k)
Percentage of individuals using paid preparers for their 2012 taxes: 56.9%
Here:
57%
State:
53%
(% for various income ranges: 39.1% for AGIs below $25k, 68.8% for AGIs $25k-50k, 75.0% for AGIs $50k-75k, 60.0% for AGIs $75k-100k, 66.7% for AGIs $100k-200k)
Averages for the 2004 tax year for zip code 47345, filed in 2005:
Average Adjusted Gross Income (AGI) in 2004: $35,299 (Individual Income Tax Returns)
Here:
$35,299
State:
$44,790
Salary/wage: $35,390 (reported on 81.5% of returns)
Here:
$35,390
State:
$39,615
(% of AGI for various income ranges: 166.0% for AGIs below $10k, 66.8% for AGIs $10k-25k, 79.5% for AGIs $25k-50k, 84.2% for AGIs $50k-75k, 81.8% for AGIs $75k-100k, 79.4% for AGIs over 100k)
Taxable interest for individuals: $1,100 (reported on 48.3% of returns)
This zip code:
$1,100
Indiana:
$1,535
(% of AGI for various income ranges: 4.7% for AGIs below $10k, 3.7% for AGIs $10k-25k, 2.4% for AGIs $25k-50k, 0.8% for AGIs $50k-75k, 0.8% for AGIs $75k-100k, 0.2% for AGIs over 100k)
Taxable dividends: $761 (reported on 24.1% of returns)
Here:
$761
State:
$2,998
(% of AGI for various income ranges: 3.1% for AGIs below $10k, 1.3% for AGIs $10k-25k, 0.7% for AGIs $25k-50k, 0.3% for AGIs $50k-75k, 0.2% for AGIs $75k-100k, 0.1% for AGIs over 100k)
Net capital gain/loss: +$2,123 (reported on 16.5% of returns)
Here:
+$2,123
State:
+$8,619
(% of AGI for various income ranges: -0.7% for AGIs below $10k, 0.4% for AGIs $10k-25k, 1.3% for AGIs $25k-50k, 1.1% for AGIs $50k-75k, 1.8% for AGIs $75k-100k)
Profit/loss from business: +$5,524 (reported on 16.0% of returns)
Here:
+$5,524
State:
+$10,071
(% of AGI for various income ranges: 6.9% for AGIs below $10k, 7.6% for AGIs $10k-25k, 1.9% for AGIs $25k-50k, 1.5% for AGIs $50k-75k, 3.7% for AGIs $75k-100k)
Profit/loss from farming: +$4,357 (reported on 6.5% of returns)
Here:
+$4,357
State:
-$2,212
Total itemized deductions: $15,237 (23% of AGI, reported on 23.7% of returns)
Here:
$15,237
State:
$17,065
Here:
22.7% of AGI
State:
19.5% of AGI
(% of AGI for various income ranges: 7.1% for AGIs $10k-25k, 8.5% for AGIs $25k-50k, 11.4% for AGIs $50k-75k, 12.0% for AGIs $75k-100k, 12.3% for AGIs over 100k)
Charity contributions deductions: $2,743 (4% of AGI, reported on 17.6% of returns)
Here:
$2,743
State:
$3,550
Here:
3.9% of AGI
State:
3.8% of AGI
(% of AGI for various income ranges: 1.7% for AGIs $25k-50k, 1.1% for AGIs $50k-75k, 1.6% for AGIs $75k-100k, 2.1% for AGIs over 100k)
Total tax: $4,307 (reported on 69.9% of returns)
47345:
$4,307
State:
$6,914
(% of AGI for various income ranges: 3.1% for AGIs below $10k, 3.8% for AGIs $10k-25k, 6.2% for AGIs $25k-50k, 8.8% for AGIs $50k-75k, 9.8% for AGIs $75k-100k, 14.8% for AGIs over 100k)
Earned income credit: $1,644 (reported on 13.6% of returns)
Here:
$1,644
State:
$1,685
Percentage of individuals using paid preparers for their 2004 taxes: 64.0%
Here:
64%
State:
59%
(% for various income ranges: 56.9% for AGIs below $10k, 69.0% for AGIs $10k-25k, 64.5% for AGIs $25k-50k, 62.1% for AGIs $50k-75k, 79.1% for AGIs $75k-100k, 61.5% for AGIs over 100k)
Likely homosexual households (counted as self-reported same-sex unmarried-partner households)
Lesbian couples: 0.7% of all households
Gay men: 0.0% of all households
Household received Food Stamps/SNAP in the past 12 months: 46 Household did not receive Food Stamps/SNAP in the past 12 months: 450
Women who had a birth in the past 12 months: 5 (1 now married, 3 unmarried) Women who did not have a birth in the past 12 months: 330 (138 now married, 191 unmarried)
Housing units in zip code 47345 with a mortgage: 302 (45 second mortgage, 1 home equity loan, 26 both second mortgage and home equity loan) Houses without a mortgage: 62
Median monthly owner costs for units with a mortgage: $1,089 Median monthly owner costs for units without a mortgage: $491
Residents with income below the poverty level in 2022:
This zip code:
5.1%
Whole state:
12.6%
Residents with income below 50% of the poverty level in 2022:
This zip code:
4.6%
Whole state:
6.3%
Median number of rooms in houses and condos:
Here:
7.4
State:
6.6
Median number of rooms in apartments:
Here:
4.7
State:
4.3
Notable locations in this zip code not listed on our city pages
Streams, rivers, and creeks: Williamsburg Creek (A), Pale Run (B), Our Run (C), Oser Creek (D), Rich Creek (E), Collor Creek (F), College Corner Branch (G). Display/hide their locations on the map
Size of family households: 195 2-persons, 56 3-persons, 99 4-persons, 13 5-persons, 5 6-persons, 34 7-or-more-persons
Size of nonfamily households: 56 1-person, 31 2-persons, 1 4-persons
266 married couples with children.
68 single-parent households (5 men, 63 women).
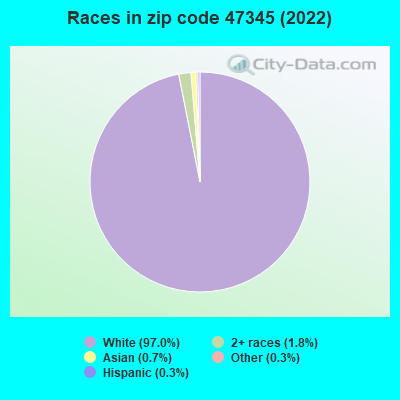
98.4% of residents of 47345 zip code speak English at home.
0.1% of residents speak Spanish at home (100% very well).
Foreign born population: 14 (1.0%) (100.0% of them are naturalized citizens)
This zip code:
1.0%
Whole state:
6.1%
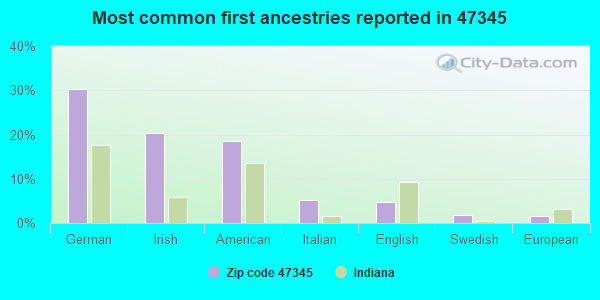
14%France
30%German
20%Irish
18%American
5%Italian
5%English
2%Swedish
2%European
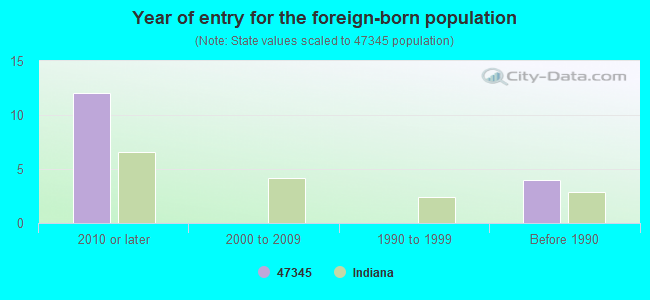
Year of entry for the foreign-born population
122010 or later
02000 to 2009
01990 to 1999
4Before 1990
Facilities with environmental interests located in this zip code:
CHARLES GARAGE (11 E PEARL ST in GREENS FORK, IN)
(Integrated Compliance Information System) - ICIS-05-1997-0702, FORMAL ENFORCEMENT ACTION STATE MASTER (Indiana facility tracking) - CRTK-6520, EPCRA, UST-19887, UNDERGROUND STORAGE TANK PROGRAM Alternative names: PAULS MARATHON SERVICE, PAULS MARATHON SERVICE AND GARAGE
GREENS FORK MUNICIPAL WWTP (12 SOUTH WATER STREET in GREENS FORK, IN)
STATE MASTER (Indiana facility tracking) National Pollutant Discharge Elimination System NON-MAJOR (Tracking pollutant discharge elimination systems) - permit Business SIC classification: SEWERAGE SYSTEMS Organizations: CERTIFIED OPERATOR (CONTACT/OPERATOR)
, GREENS FORK TOWN COUNCIL (CONTACT/OWNER)
Housing units lacking complete plumbing facilities: 3.7% Housing units lacking complete kitchen facilities: 7.5%
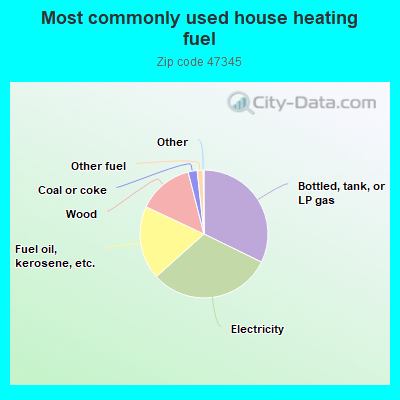
32.4%Bottled, tank, or LP gas
31.3%Electricity
18.7%Fuel oil, kerosene, etc.
14.1%Wood
2.3%Coal or coke
1.5%Other fuel
Population in 1990: 1,054. Population change in the 1990s: +247 (+23.4%).
Place of birth for U.S.-born residents:
This state: 1,173
Northeast: 58
Midwest: 122
South: 41
West: 28
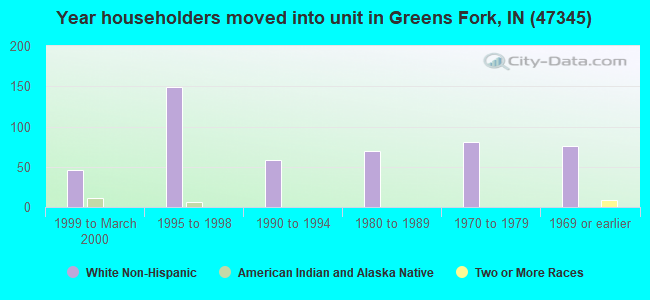
57% of the 47345 zip code residents lived in the same house 5 years ago. Out of people who lived in different houses, 62% lived in this county. Out of people who lived in different counties, 50% lived in Indiana.
90% of the 47345 zip code residents lived in the same house 1 year ago. Out of people who lived in different houses, 62% moved from this county. Out of people who lived in different houses, 22% moved from different county within same state. Out of people who lived in different houses, 15% moved from abroad.
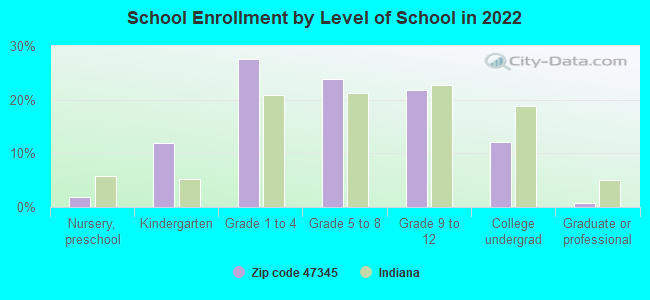
Private vs. public school enrollment:
Students in private schools in grades 1 to 8 (elementary and middle school): 14
Here:
7.5%
Indiana:
14.9%
Students in private schools in grades 9 to 12 (high school): 13
Here:
15.7%
Indiana:
11.4%
Students in private undergraduate colleges: 4
Here:
10.6%
Indiana:
22.3%
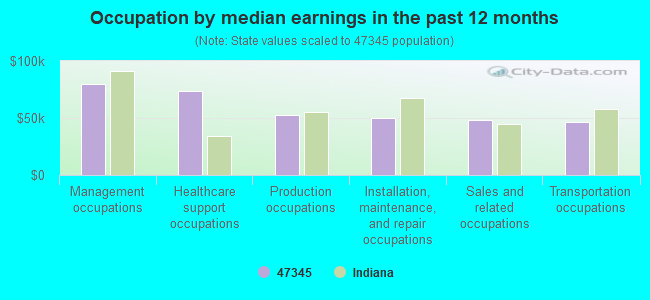
Occupation by median earnings in the past 12 months ($)
80,077Management occupations
73,344Healthcare support occupations
52,932Production occupations
49,943Installation, maintenance, and repair occupations
48,542Sales and related occupations
46,652Transportation occupations
Top industries in this zip code by the number of employees in 2005:
Construction: New Single-Family Housing Construction (except Operative Builders) (5-9 employees: 1 establishment)
Health Care and Social Assistance: Services for the Elderly and Persons with Disabilities (1-4: 1)
Other Services (except Public Administration): Cemeteries and Crematories (1-4: 1)
Construction: Site Preparation Contractors (1-4: 1)
Construction: Residential Remodelers (1-4: 1)
Other Services (except Public Administration): Religious Organizations (1-4: 1)
Fatal accident statistics in 2014:
Fatal accident count: 1
Vehicles involved in fatal accidents: 3
Fatal accidents caused by drunken drivers: 0
Fatalities: 2
Persons involved in fatal accidents: 4
Pedestrians involved in fatal accidents: 0
Fatal accident statistics in 2012:
Fatal accident count: 1
Vehicles involved in fatal accidents: 1
Fatal accidents caused by drunken drivers: 0
Fatalities: 1
Persons involved in fatal accidents: 1
Pedestrians involved in fatal accidents: 0
2002 - 2018 National Fire Incident Reporting System (NFIRS) incidents
Based on the data from the years 2002 - 2018 the average number of fire incidents per year is 11. The highest number of reported fires - 24 took place in 2009, and the least - 0 in 2014. The data has a decreasing trend.
When looking into fire subcategories, the most reports belonged to: Structure Fires (51.9%), and Outside Fires (39.8%).
Fire incident types reported to NFIRS in Zip Code 47345


+$4,357
-$2,212
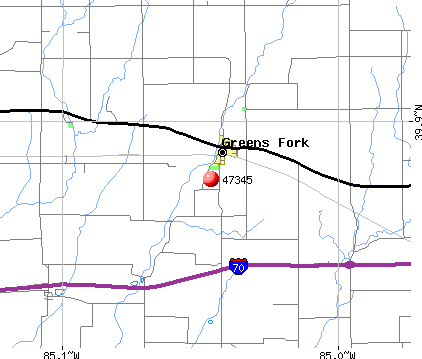 Nearest zip codes: 47339, 47393, 47330, 47346, 47327, 47335.
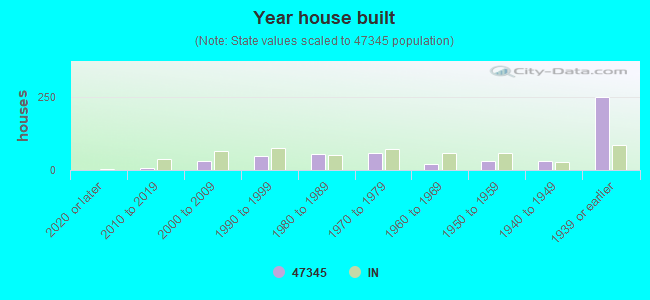


 Based on the data from the years 2002 - 2018 the average number of fire incidents per year is 11. The highest number of reported fires - 24 took place in 2009, and the least - 0 in 2014. The data has a decreasing trend.
 When looking into fire subcategories, the most reports belonged to: Structure Fires (51.9%), and Outside Fires (39.8%).