Estimated zip code population in 2022: 2,332 Zip code population in 2010: 2,693 Zip code population in 2000: 2,953
Houses and condos: 1,062 Renter-occupied apartments: 225
% of renters here:
23%
State:
29%
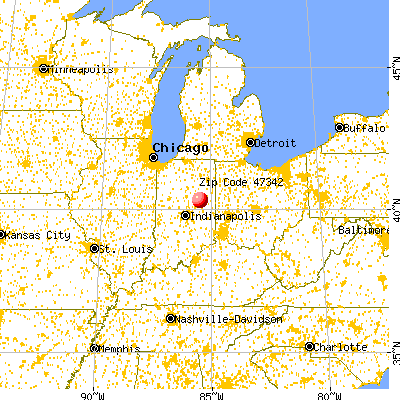
March 2022 cost of living index in zip code 47342: 84.8 (less than average, U.S. average is 100)
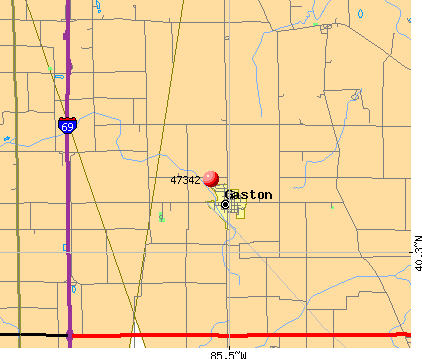
Land area: 50.0 sq. mi. Water area: 0.1 sq. mi.
Population density: 47 people per square mile
(very low).
OSM Map
General Map
Google Map
MSN Map
OSM Map
General Map
Google Map
MSN Map
OSM Map
General Map
Google Map
MSN Map
OSM Map
General Map
Google Map
MSN Map
Please wait while loading the map...
Real estate property taxes paid for housing units in 2022:
This zip code:
0.6% ($746)
Indiana:
0.7% ($1,467)
Median real estate property taxes paid for housing units with mortgages in 2022: $914 (0.5%) Median real estate property taxes paid for housing units with no mortgage in 2022: $620 (0.7%)
Business Search- 14 Million verified businesses
Males: 1,238
(53.1%)
Females: 1,094
(46.9%)
For population 25 years and over in 47342:
High school or higher: 84.0%
Bachelor's degree or higher: 13.1%
Graduate or professional degree: 6.0%
Unemployed: 3.0%
Mean travel time to work (commute): 28.0 minutes
For population 15 years and over in 47342:
Never married: 19.2%
Now married: 65.7%
Separated: 0.6%
Widowed: 5.3%
Divorced: 9.2%
Zip code 47342 compared to state average:
Median house value below state average.
Black race population percentage significantly below state average.
Hispanic race population percentage significantly below state average.
Foreign-born population percentage significantly below state average.
Length of stay since moving in significantly above state average.
Percentage of population with a bachelor's degree or higher below state average.
Estimated median house/condo value in 2022: $125,038
47342:
$125,038
Indiana:
$208,700
According to our research of Indiana and other state lists, there was 1 registered sex offender living in 47342 zip code as of May 28, 2024. The ratio of all residents to sex offenders in zip code 47342 is 2,762 to 1. The ratio of registered sex offenders to all residents in this zip code is much lower than the state average.
Median resident age:
This zip code:
40.3 years
Indiana median age:
38.2 years
Average household size:
This zip code:
2.4 people
Indiana:
2.4 people
Averages for the 2020 tax year for zip code 47342, filed in 2021:
Average Adjusted Gross Income (AGI) in 2020: $58,321 (Individual Income Tax Returns)
Here:
$58,321
State:
$64,978
Salary/wage: $49,214 (reported on 79.4% of returns)
Here:
$49,214
State:
$55,245
(% of AGI for various income ranges: 1036.2% for AGIs below $25k, 3665.7% for AGIs $25k-50k, 6456.2% for AGIs $50k-75k, 8702.2% for AGIs $75k-100k, 14410.9% for AGIs $100k-200k)
Taxable interest for individuals: $1,174 (reported on 27.0% of returns)
This zip code:
$1,174
Indiana:
$1,351
(% of AGI for various income ranges: 15.0% for AGIs below $25k, 34.3% for AGIs $25k-50k, 48.5% for AGIs $50k-75k, 73.3% for AGIs $75k-100k, 109.1% for AGIs $100k-200k)
Ordinary dividends: $2,939 (reported on 14.3% of returns)
Here:
$2,939
State:
$5,827
(% of AGI for various income ranges: 5.0% for AGIs below $25k, 30.9% for AGIs $25k-50k, 36.2% for AGIs $50k-75k, 65.6% for AGIs $75k-100k, 305.5% for AGIs $100k-200k)
Net capital gain/loss in AGI: +$6,393 (reported on 11.9% of returns)
Here:
+$6,393
State:
+$17,730
(% of AGI for various income ranges: 14.1% for AGIs below $25k, 45.7% for AGIs $25k-50k, 226.9% for AGIs $50k-75k, 467.3% for AGIs $100k-200k)
Profit/loss from business: +$9,954 (reported on 10.3% of returns)
Here:
+$9,954
State:
+$12,144
(% of AGI for various income ranges: 80.6% for AGIs below $25k, 72.6% for AGIs $25k-50k, 283.1% for AGIs $50k-75k, 455.5% for AGIs $100k-200k)
Taxable individual retirement arrangement distribution: $11,964 (reported on 8.7% of returns)
47342:
$11,964
Indiana:
$18,302
(% of AGI for various income ranges: 40.6% for AGIs below $25k, 90.9% for AGIs $25k-50k, 379.2% for AGIs $50k-75k, 440.0% for AGIs $100k-200k)
Total itemized deductions: $30,900 (reported on 3.2% of returns)
Here:
$30,900
State:
$35,601
(% of AGI for various income ranges: 1123.6% for AGIs $100k-200k)
Charity contributions: $12,300 (reported on 2.4% of returns)
Here:
$12,300
State:
$15,596
(% of AGI for various income ranges: 410.0% for AGIs $75k-100k)
Taxes paid: $6,375 (reported on 3.2% of returns)
47342:
$6,375
State:
$7,542
(% of AGI for various income ranges: 231.8% for AGIs $100k-200k)
Earned income credit: $2,200 (reported on 14.3% of returns)
Here:
$2,200
State:
$2,298
(% of AGI for various income ranges: 68.8% for AGIs below $25k, 76.5% for AGIs $25k-50k)
Percentage of individuals using paid preparers for their 2020 taxes: 91.3%
Here:
91%
State:
94%
(% for various income ranges: 90.7% for AGIs below $25k, 96.7% for AGIs $25k-50k, 90.5% for AGIs $50k-75k, 91.7% for AGIs $75k-100k, 88.2% for AGIs $100k-200k, 66.7% for AGIs over 200k)
Averages for the 2012 tax year for zip code 47342, filed in 2013:
Average Adjusted Gross Income (AGI) in 2012: $46,733 (Individual Income Tax Returns)
Here:
$46,733
State:
$52,932
Salary/wage: $37,103 (reported on 84.6% of returns)
Here:
$37,103
State:
$45,173
(% of AGI for various income ranges: 67.0% for AGIs below $25k, 72.5% for AGIs $25k-50k, 72.8% for AGIs $50k-75k, 68.2% for AGIs $75k-100k, 60.5% for AGIs $100k-200k)
Taxable interest for individuals: $1,271 (reported on 30.9% of returns)
This zip code:
$1,271
Indiana:
$1,311
(% of AGI for various income ranges: 1.2% for AGIs below $25k, 1.0% for AGIs $25k-50k, 0.5% for AGIs $50k-75k, 0.7% for AGIs $75k-100k, 0.9% for AGIs $100k-200k)
Ordinary dividends: $1,910 (reported on 16.3% of returns)
Here:
$1,910
State:
$4,690
(% of AGI for various income ranges: 0.6% for AGIs below $25k, 0.6% for AGIs $25k-50k, 0.7% for AGIs $50k-75k, 0.4% for AGIs $75k-100k, 0.9% for AGIs $100k-200k)
Net capital gain/loss in AGI: +$75 (reported on 9.8% of returns)
Here:
+$75
State:
+$10,406
(% of AGI for various income ranges: 0.2% for AGIs $100k-200k)
Profit/loss from business: +$7,600 (reported on 13.0% of returns)
Here:
+$7,600
State:
+$11,105
(% of AGI for various income ranges: 5.4% for AGIs below $25k, 2.1% for AGIs $25k-50k, 4.3% for AGIs $50k-75k, 0.8% for AGIs $100k-200k)
Taxable individual retirement arrangement distribution: $10,277 (reported on 10.6% of returns)
47342:
$10,277
Indiana:
$13,841
(% of AGI for various income ranges: 2.5% for AGIs below $25k, 2.7% for AGIs $25k-50k, 5.2% for AGIs $50k-75k, 1.6% for AGIs $100k-200k)
Total itemized deductions: $20,010 (19% of AGI, reported on 16.3% of returns)
Here:
$20,010
State:
$20,913
Here:
18.9% of AGI
State:
18.2% of AGI
(% of AGI for various income ranges: 5.6% for AGIs below $25k, 4.5% for AGIs $25k-50k, 4.9% for AGIs $50k-75k, 6.9% for AGIs $75k-100k, 9.9% for AGIs $100k-200k)
Charity contributions: $4,180 (reported on 12.2% of returns)
Here:
$4,180
State:
$4,697
(% of AGI for various income ranges: 0.7% for AGIs $25k-50k, 1.0% for AGIs $50k-75k, 1.0% for AGIs $75k-100k, 1.8% for AGIs $100k-200k)
Taxes paid: $6,605 (reported on 16.3% of returns)
47342:
$6,605
State:
$7,456
(% of AGI for various income ranges: 0.8% for AGIs below $25k, 1.0% for AGIs $25k-50k, 1.2% for AGIs $50k-75k, 2.1% for AGIs $75k-100k, 4.3% for AGIs $100k-200k)
Earned income credit: $2,109 (reported on 18.7% of returns)
Here:
$2,109
State:
$2,265
(% of AGI for various income ranges: 5.4% for AGIs below $25k, 1.2% for AGIs $25k-50k)
Percentage of individuals using paid preparers for their 2012 taxes: 55.3%
Here:
55%
State:
53%
(% for various income ranges: 48.1% for AGIs below $25k, 57.1% for AGIs $25k-50k, 61.1% for AGIs $50k-75k, 63.6% for AGIs $75k-100k, 66.7% for AGIs $100k-200k)
Averages for the 2004 tax year for zip code 47342, filed in 2005:
Average Adjusted Gross Income (AGI) in 2004: $41,117 (Individual Income Tax Returns)
Here:
$41,117
State:
$44,790
Salary/wage: $36,256 (reported on 84.5% of returns)
Here:
$36,256
State:
$39,615
(% of AGI for various income ranges: 103.9% for AGIs below $10k, 63.7% for AGIs $10k-25k, 77.8% for AGIs $25k-50k, 81.4% for AGIs $50k-75k, 82.6% for AGIs $75k-100k, 61.0% for AGIs over 100k)
Taxable interest for individuals: $1,284 (reported on 47.4% of returns)
This zip code:
$1,284
Indiana:
$1,535
(% of AGI for various income ranges: 6.4% for AGIs below $10k, 3.2% for AGIs $10k-25k, 1.3% for AGIs $25k-50k, 1.4% for AGIs $50k-75k, 1.1% for AGIs $75k-100k, 1.0% for AGIs over 100k)
Taxable dividends: $1,195 (reported on 20.6% of returns)
Here:
$1,195
State:
$2,998
(% of AGI for various income ranges: 4.0% for AGIs below $10k, 0.7% for AGIs $10k-25k, 0.6% for AGIs $25k-50k, 0.3% for AGIs $50k-75k, 0.3% for AGIs $75k-100k, 0.9% for AGIs over 100k)
Net capital gain/loss: +$5,277 (reported on 14.5% of returns)
Here:
+$5,277
State:
+$8,619
(% of AGI for various income ranges: -0.9% for AGIs below $10k, 1.4% for AGIs $10k-25k, 0.6% for AGIs $25k-50k, 0.0% for AGIs $50k-75k, 0.5% for AGIs $75k-100k, 6.1% for AGIs over 100k)
Profit/loss from business: +$5,260 (reported on 14.8% of returns)
Here:
+$5,260
State:
+$10,071
(% of AGI for various income ranges: 2.1% for AGIs below $10k, 6.5% for AGIs $10k-25k, 3.3% for AGIs $25k-50k, 3.5% for AGIs $50k-75k, 1.4% for AGIs $75k-100k, -2.5% for AGIs over 100k)
IRA payment deduction: $3,032 (reported on 2.4% of returns)
47342:
$3,032
Indiana:
$2,840
Total itemized deductions: $15,533 (21% of AGI, reported on 23.2% of returns)
Here:
$15,533
State:
$17,065
Here:
21.3% of AGI
State:
19.5% of AGI
(% of AGI for various income ranges: 9.9% for AGIs $10k-25k, 6.3% for AGIs $25k-50k, 7.5% for AGIs $50k-75k, 12.8% for AGIs $75k-100k, 9.5% for AGIs over 100k)
Charity contributions deductions: $3,115 (4% of AGI, reported on 18.2% of returns)
Here:
$3,115
State:
$3,550
Here:
3.9% of AGI
State:
3.8% of AGI
(% of AGI for various income ranges: 0.8% for AGIs $10k-25k, 0.9% for AGIs $25k-50k, 1.0% for AGIs $50k-75k, 2.0% for AGIs $75k-100k, 2.1% for AGIs over 100k)
Total tax: $5,711 (reported on 74.7% of returns)
47342:
$5,711
State:
$6,914
(% of AGI for various income ranges: 2.7% for AGIs below $10k, 4.1% for AGIs $10k-25k, 6.7% for AGIs $25k-50k, 9.5% for AGIs $50k-75k, 10.3% for AGIs $75k-100k, 18.0% for AGIs over 100k)
Earned income credit: $1,566 (reported on 15.3% of returns)
Here:
$1,566
State:
$1,685
Percentage of individuals using paid preparers for their 2004 taxes: 65.8%
Here:
66%
State:
59%
(% for various income ranges: 57.0% for AGIs below $10k, 70.8% for AGIs $10k-25k, 64.8% for AGIs $25k-50k, 65.8% for AGIs $50k-75k, 67.9% for AGIs $75k-100k, 77.1% for AGIs over 100k)
Likely homosexual households (counted as self-reported same-sex unmarried-partner households)
Lesbian couples: 0.0% of all households
Gay men: 0.6% of all households
Household received Food Stamps/SNAP in the past 12 months: 46 Household did not receive Food Stamps/SNAP in the past 12 months: 916
Women who had a birth in the past 12 months: 12 (5 now married, 6 unmarried) Women who did not have a birth in the past 12 months: 487 (352 now married, 137 unmarried)
Housing units in zip code 47342 with a mortgage: 401 (38 second mortgage, 39 both second mortgage and home equity loan) Houses without a mortgage: 21
Median monthly owner costs for units with a mortgage: $1,103 Median monthly owner costs for units without a mortgage: $426
Residents with income below the poverty level in 2022:
This zip code:
8.0%
Whole state:
12.6%
Residents with income below 50% of the poverty level in 2022:
This zip code:
3.0%
Whole state:
6.3%
Median number of rooms in houses and condos:
Here:
6.3
State:
6.6
Median number of rooms in apartments:
Here:
4.8
State:
4.3
Notable locations in this zip code not listed on our city pages
400 married couples with children.
83 single-parent households (55 men, 28 women).
97.4% of residents of 47342 zip code speak English at home.
0.7% of residents speak Spanish at home (56% very well, 12% well, 31% not well).
0.6% of residents speak other Indo-European language at home (77% well, 23% not well).
0.4% of residents speak other language at home (100% very well).
Foreign born population: 6 (0.3%) (34.4% of them are naturalized citizens)
This zip code:
0.3%
Whole state:
6.1%
67%Honduras
17%Malaysia
19%American
16%European
14%English
10%Irish
10%German
2%Scottish
1%Greek
Year of entry for the foreign-born population
02010 or later
42000 to 2009
11990 to 1999
13Before 1990
Facilities with environmental interests located in this zip code:
PIPE CREEK NORTH BOUND REST AREA (I-69; 50 MILE MARKER ON I 69; 5 MI N OF SR 28 in GASTON, IN)
STATE MASTER (Indiana facility tracking) - IN-NPDES-IN0031356, National Pollutant Discharge Elimination System Permit National Pollutant Discharge Elimination System NON-MAJOR (Tracking pollutant discharge elimination systems) - permit Business SIC classification: REGULATION AND ADMINISTRATION OF TRANSPORTATION PROGRAMS Organizations: CLYDE MASON CERT 5570 (CONTACT/OPERATOR)
, INDOT (CONTACT/OWNER)
Alternative names: IN. DEPT. OF TRANSPORTATION, PIPE CREEK REST AREA I-69
AMERITECH (202 N SYCAMORE ST in GASTON, IN)
STATE MASTER (Indiana facility tracking) - UST-1452, UNDERGROUND STORAGE TANK PROGRAM, CRTK-6493, EPCRA (Resource Conservation and Recovery Act (tracking hazardous waste)) Organizations: INDIANA BELL TELEPHONE CO INC (CONTACT/OWNER)
Alternative names: IND BELL TEL CO GASTON 358 OFF
PETRO WAREHOUSE (109 BROAD ST in GASTON, IN)
STATE MASTER (Indiana facility tracking) - CRTK-912, EPCRA COMPLIANCE ACTIVITY (Tracking inspections of insecticide, fungicide, and rodenticide, and toxic substances) Alternative names: CROPMATE FERTILIZER CO
REASON'S FAMILY PANTRY (16910 W. 600 N. in GASTON, IN)
(Integrated Compliance Information System) - ICIS-05-1997-0675, FORMAL ENFORCEMENT ACTION STATE MASTER (Indiana facility tracking)
AMOCO FERTILIZER PLT (W OF GASTON NEAR TRACKS in GASTON, IN)
STATE MASTER (Indiana facility tracking) (Resource Conservation and Recovery Act (tracking hazardous waste))
CHRISTIAN HAVEN HOMES 37 (287 N SR 49 in GASTON, IN)
STATE MASTER (Indiana facility tracking) COMPLIANCE ACTIVITY (Tracking inspections of insecticide, fungicide, and rodenticide, and toxic substances)
Housing units lacking complete plumbing facilities: 4.4% Housing units lacking complete kitchen facilities: 5.3%
30.2%Bottled, tank, or LP gas
28.2%Utility gas
26.6%Electricity
9.2%Fuel oil, kerosene, etc.
5.1%Wood
1.0%Other fuel
Population in 1990: 4,594.
Place of birth for U.S.-born residents:
This state: 1,933
Northeast: 33
Midwest: 174
South: 117
West: 35
64% of the 47342 zip code residents lived in the same house 5 years ago. Out of people who lived in different houses, 64% lived in this county. Out of people who lived in different counties, 50% lived in Indiana.
86% of the 47342 zip code residents lived in the same house 1 year ago. Out of people who lived in different houses, 52% moved from this county. Out of people who lived in different houses, 40% moved from different county within same state. Out of people who lived in different houses, 4% moved from different state.
Private vs. public school enrollment:
Students in private schools in grades 1 to 8 (elementary and middle school): 19
Here:
7.9%
Indiana:
14.9%
Students in private schools in grades 9 to 12 (high school): 3
Here:
4.9%
Indiana:
11.4%
Students in private undergraduate colleges:
Here:
0.0%
Indiana:
22.3%
Occupation by median earnings in the past 12 months ($)
118,492Transportation occupations
65,156Management occupations
64,001Health diagnosing and treating practitioners and other technical occupations
60,746Fire fighting and prevention, and other protective service workers including supervisors
47,727Construction and extraction occupations
46,240Business and financial operations occupations
Top industries in this zip code by the number of employees in 2005:
Health Care and Social Assistance: Nursing Care Facilities (50-99 employees: 1 establishment)
Construction: Power and Communication Line and Related Structures Construction (20-49: 1)
Wholesale Trade: Petroleum Bulk Stations and Terminals (20-49: 1)
Accommodation and Food Services: Full-Service Restaurants (20-49: 1)
Construction: Roofing Contractors (10-19: 1)
Construction: Industrial Building Construction (10-19: 1)
Construction: Site Preparation Contractors (1-4: 4)
People in group quarters in 2000:
72 people in other nonhousehold living situations
Fatal accident statistics in 2014:
Fatal accident count: 1
Vehicles involved in fatal accidents: 1
Fatal accidents caused by drunken drivers: 0
Fatalities: 1
Persons involved in fatal accidents: 2
Pedestrians involved in fatal accidents: 0
Fatal accident statistics in 2013:
Fatal accident count: 1
Vehicles involved in fatal accidents: 1
Fatal accidents caused by drunken drivers: 1
Fatalities: 1
Persons involved in fatal accidents: 1
Pedestrians involved in fatal accidents: 0
Home Mortgage Disclosure Act Aggregated Statistics For Year 2009 (Based on 2 partial tracts)
A) FHA, FSA/RHS & VA Home Purchase Loans
B) Conventional Home Purchase Loans
C) Refinancings
D) Home Improvement Loans
F) Non-occupant Loans on < 5 Family Dwellings (A B C & D)
G) Loans On Manufactured Home Dwelling (A B C & D)
Number
Average Value
Number
Average Value
Number
Average Value
Number
Average Value
Number
Average Value
Number
Average Value
LOANS ORIGINATED
21
$115,729
24
$151,869
129
$133,739
12
$26,340
5
$81,384
2
$70,310
APPLICATIONS APPROVED, NOT ACCEPTED
0
$0
2
$60,355
9
$179,884
1
$24,890
0
$0
1
$87,110
APPLICATIONS DENIED
1
$114,480
2
$204,705
49
$134,243
4
$6,845
1
$56,000
1
$22,400
APPLICATIONS WITHDRAWN
0
$0
1
$176,700
37
$169,171
2
$16,800
0
$0
0
$0
FILES CLOSED FOR INCOMPLETENESS
2
$207,815
0
$0
5
$162,020
0
$0
0
$0
0
$0
Aggregated Statistics For Year 2008 (Based on 2 partial tracts)
A) FHA, FSA/RHS & VA Home Purchase Loans
B) Conventional Home Purchase Loans
C) Refinancings
D) Home Improvement Loans
F) Non-occupant Loans on < 5 Family Dwellings (A B C & D)
G) Loans On Manufactured Home Dwelling (A B C & D)
Number
Average Value
Number
Average Value
Number
Average Value
Number
Average Value
Number
Average Value
Number
Average Value
LOANS ORIGINATED
19
$89,007
31
$121,309
82
$107,914
21
$52,442
6
$49,568
6
$57,035
APPLICATIONS APPROVED, NOT ACCEPTED
0
$0
2
$61,600
11
$140,504
0
$0
1
$32,350
1
$68,440
APPLICATIONS DENIED
6
$123,195
9
$82,546
47
$116,682
6
$24,058
4
$19,910
2
$151,195
APPLICATIONS WITHDRAWN
0
$0
4
$128,485
19
$139,176
1
$37,330
0
$0
0
$0
FILES CLOSED FOR INCOMPLETENESS
0
$0
0
$0
7
$97,241
1
$103,290
0
$0
0
$0
Aggregated Statistics For Year 2007 (Based on 2 partial tracts)
A) FHA, FSA/RHS & VA Home Purchase Loans
B) Conventional Home Purchase Loans
C) Refinancings
D) Home Improvement Loans
F) Non-occupant Loans on < 5 Family Dwellings (A B C & D)
G) Loans On Manufactured Home Dwelling (A B C & D)
Number
Average Value
Number
Average Value
Number
Average Value
Number
Average Value
Number
Average Value
Number
Average Value
LOANS ORIGINATED
10
$83,126
55
$111,295
96
$103,959
22
$43,780
9
$84,481
2
$111,995
APPLICATIONS APPROVED, NOT ACCEPTED
0
$0
4
$108,885
24
$79,642
5
$20,408
1
$120,710
1
$26,130
APPLICATIONS DENIED
0
$0
6
$82,753
54
$140,064
12
$40,858
4
$212,792
5
$55,500
APPLICATIONS WITHDRAWN
1
$317,320
4
$100,485
31
$90,440
2
$77,155
1
$59,730
1
$138,130
FILES CLOSED FOR INCOMPLETENESS
0
$0
1
$62,220
6
$94,782
0
$0
0
$0
0
$0
Aggregated Statistics For Year 2006 (Based on 2 partial tracts)
A) FHA, FSA/RHS & VA Home Purchase Loans
B) Conventional Home Purchase Loans
C) Refinancings
D) Home Improvement Loans
E) Loans on Dwellings For 5+ Families
F) Non-occupant Loans on < 5 Family Dwellings (A B C & D)
G) Loans On Manufactured Home Dwelling (A B C & D)
Number
Average Value
Number
Average Value
Number
Average Value
Number
Average Value
Number
Average Value
Number
Average Value
Number
Average Value
LOANS ORIGINATED
11
$84,733
67
$99,961
98
$89,203
29
$41,108
1
$107,020
4
$58,798
5
$71,678
APPLICATIONS APPROVED, NOT ACCEPTED
2
$99,550
11
$93,330
26
$107,832
2
$31,110
0
$0
5
$128,670
0
$0
APPLICATIONS DENIED
1
$92,090
19
$65,495
61
$118,871
14
$40,265
0
$0
2
$116,350
9
$49,361
APPLICATIONS WITHDRAWN
36
$130,351
22
$108,376
37
$140,617
1
$57,240
0
$0
4
$87,420
1
$83,370
FILES CLOSED FOR INCOMPLETENESS
0
$0
4
$58,488
12
$113,552
4
$97,998
0
$0
0
$0
0
$0
Aggregated Statistics For Year 2005 (Based on 2 partial tracts)
A) FHA, FSA/RHS & VA Home Purchase Loans
B) Conventional Home Purchase Loans
C) Refinancings
D) Home Improvement Loans
F) Non-occupant Loans on < 5 Family Dwellings (A B C & D)
G) Loans On Manufactured Home Dwelling (A B C & D)
Number
Average Value
Number
Average Value
Number
Average Value
Number
Average Value
Number
Average Value
Number
Average Value
LOANS ORIGINATED
4
$53,510
73
$110,615
114
$115,052
31
$37,131
12
$88,768
7
$74,309
APPLICATIONS APPROVED, NOT ACCEPTED
0
$0
4
$113,240
24
$94,419
4
$67,508
5
$65,954
1
$83,370
APPLICATIONS DENIED
4
$73,108
14
$84,264
92
$108,479
14
$13,599
2
$89,595
2
$50,400
APPLICATIONS WITHDRAWN
1
$63,460
5
$181,434
39
$149,615
2
$64,085
5
$80,388
0
$0
FILES CLOSED FOR INCOMPLETENESS
1
$69,690
1
$99,550
16
$103,985
1
$123,200
0
$0
0
$0
Aggregated Statistics For Year 2004 (Based on 2 partial tracts)
A) FHA, FSA/RHS & VA Home Purchase Loans
B) Conventional Home Purchase Loans
C) Refinancings
D) Home Improvement Loans
F) Non-occupant Loans on < 5 Family Dwellings (A B C & D)
G) Loans On Manufactured Home Dwelling (A B C & D)
Number
Average Value
Number
Average Value
Number
Average Value
Number
Average Value
Number
Average Value
Number
Average Value
LOANS ORIGINATED
5
$84,122
102
$137,482
161
$110,821
29
$58,787
24
$135,951
6
$290,567
APPLICATIONS APPROVED, NOT ACCEPTED
0
$0
11
$90,049
34
$91,024
6
$46,872
0
$0
1
$116,970
APPLICATIONS DENIED
6
$100,175
9
$92,639
75
$151,999
15
$28,041
7
$70,753
2
$135,015
APPLICATIONS WITHDRAWN
0
$0
5
$128,670
45
$91,035
0
$0
1
$67,200
0
$0
FILES CLOSED FOR INCOMPLETENESS
0
$0
7
$95,819
11
$130,096
2
$108,265
2
$120,705
0
$0
Aggregated Statistics For Year 2003 (Based on 2 partial tracts)
A) FHA, FSA/RHS & VA Home Purchase Loans
B) Conventional Home Purchase Loans
C) Refinancings
D) Home Improvement Loans
F) Non-occupant Loans on < 5 Family Dwellings (A B C & D)
Detailed PMIC statistics for the following Tracts:0025.00
2003 - 2018 National Fire Incident Reporting System (NFIRS) incidents
Based on the data from the years 2003 - 2018 the average number of fire incidents per year is 44. The highest number of reported fires - 98 took place in 2007, and the least - 6 in 2012. The data has a decreasing trend.
When looking into fire subcategories, the most reports belonged to: Outside Fires (52.9%), and Structure Fires (23.1%).
Fire incident types reported to NFIRS in Zip Code 47342


 Nearest zip codes: 46957, 46930, 47304, 46989, 47396, 47303.


 Based on the data from the years 2003 - 2018 the average number of fire incidents per year is 44. The highest number of reported fires - 98 took place in 2007, and the least - 6 in 2012. The data has a decreasing trend.
 When looking into fire subcategories, the most reports belonged to: Outside Fires (52.9%), and Structure Fires (23.1%).