Estimated zip code population in 2022: 5,661 Zip code population in 2010: 5,195 Zip code population in 2000: 5,104
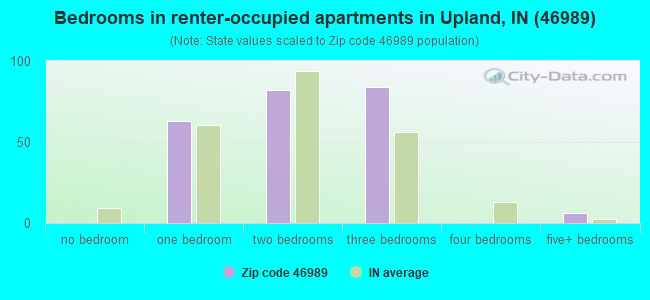
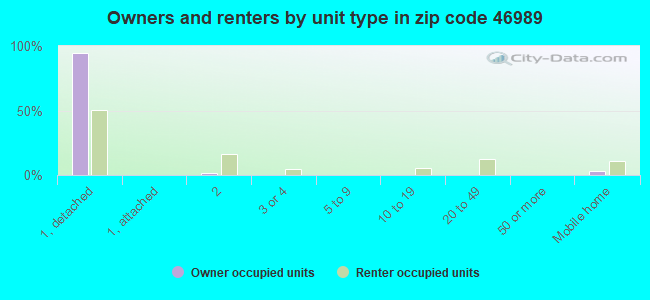
Houses and condos: 1,591 Renter-occupied apartments: 237
% of renters here:
17%
State:
29%
March 2022 cost of living index in zip code 46989: 75.7 (low, U.S. average is 100)
Land area: 33.6 sq. mi. Water area: 0.2 sq. mi.
Population density: 169 people per square mile
(very low).
OSM Map
General Map
Google Map
MSN Map
OSM Map
General Map
Google Map
MSN Map
OSM Map
General Map
Google Map
MSN Map
OSM Map
General Map
Google Map
MSN Map
Please wait while loading the map...
Real estate property taxes paid for housing units in 2022:
This zip code:
0.6% ($1,158)
Indiana:
0.7% ($1,467)
Median real estate property taxes paid for housing units with mortgages in 2022: $1,231 (0.6%) Median real estate property taxes paid for housing units with no mortgage in 2022: $1,042 (0.7%)
Business Search- 14 Million verified businesses
Males: 2,730
(48.2%)
Females: 2,930
(51.8%)
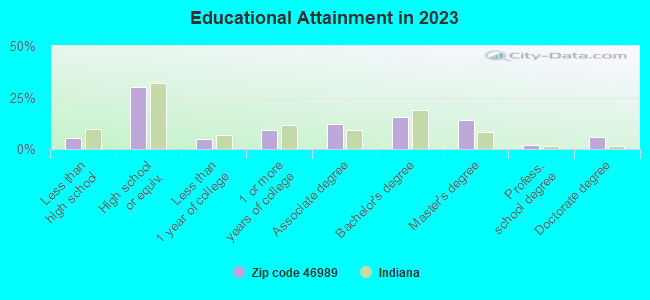
For population 25 years and over in 46989:
High school or higher: 95.0%
Bachelor's degree or higher: 34.9%
Graduate or professional degree: 19.1%
Unemployed: 1.6%
Mean travel time to work (commute): 20.1 minutes
For population 15 years and over in 46989:
Never married: 47.4%
Now married: 42.3%
Separated: 0.2%
Widowed: 5.0%
Divorced: 5.0%
Zip code 46989 compared to state average:
Unemployed percentage below state average.
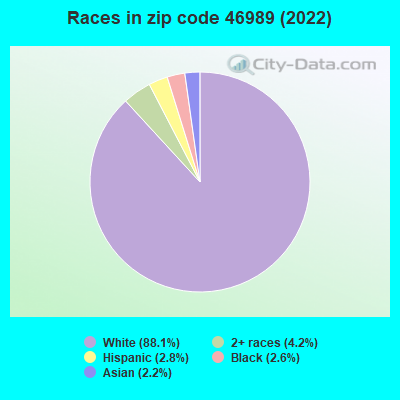
Black race population percentage significantly below state average.
Hispanic race population percentage below state average.
Median age significantly below state average.
Renting percentage below state average.
Length of stay since moving in significantly above state average.
Number of college students significantly above state average.
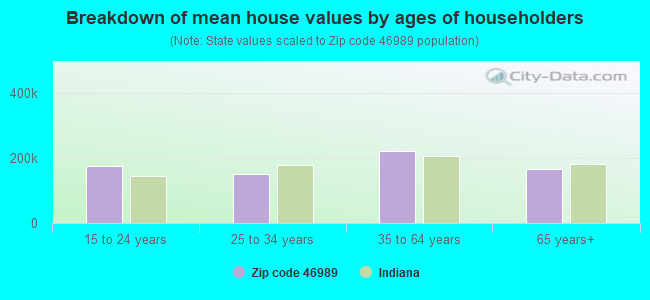
Estimated median house/condo value in 2022: $195,514
46989:
$195,514
Indiana:
$208,700
Median resident age:
This zip code:
23.3 years
Indiana median age:
38.2 years
Average household size:
This zip code:
3.0 people
Indiana:
2.4 people
Averages for the 2020 tax year for zip code 46989, filed in 2021:
Average Adjusted Gross Income (AGI) in 2020: $57,272 (Individual Income Tax Returns)
Here:
$57,272
State:
$64,978
Salary/wage: $52,203 (reported on 80.7% of returns)
Here:
$52,203
State:
$55,245
(% of AGI for various income ranges: 1024.3% for AGIs below $25k, 3536.1% for AGIs $25k-50k, 6081.6% for AGIs $50k-75k, 9819.2% for AGIs $75k-100k, 14858.8% for AGIs $100k-200k)
Taxable interest for individuals: $771 (reported on 38.5% of returns)
This zip code:
$771
Indiana:
$1,351
(% of AGI for various income ranges: 22.6% for AGIs below $25k, 14.5% for AGIs $25k-50k, 42.1% for AGIs $50k-75k, 50.8% for AGIs $75k-100k, 125.3% for AGIs $100k-200k)
Ordinary dividends: $2,887 (reported on 19.3% of returns)
Here:
$2,887
State:
$5,827
(% of AGI for various income ranges: 20.0% for AGIs below $25k, 25.5% for AGIs $25k-50k, 75.3% for AGIs $50k-75k, 132.5% for AGIs $75k-100k, 261.2% for AGIs $100k-200k)
Net capital gain/loss in AGI: +$7,921 (reported on 17.4% of returns)
Here:
+$7,921
State:
+$17,730
(% of AGI for various income ranges: 10.3% for AGIs below $25k, 10.0% for AGIs $25k-50k, 85.3% for AGIs $50k-75k, 208.3% for AGIs $75k-100k, 1022.9% for AGIs $100k-200k)
Profit/loss from business: +$8,335 (reported on 14.3% of returns)
Here:
+$8,335
State:
+$12,144
(% of AGI for various income ranges: 69.1% for AGIs below $25k, 55.5% for AGIs $25k-50k, 103.7% for AGIs $50k-75k, 331.7% for AGIs $75k-100k, 534.1% for AGIs $100k-200k)
Taxable individual retirement arrangement distribution: $13,868 (reported on 11.8% of returns)
46989:
$13,868
Indiana:
$18,302
(% of AGI for various income ranges: 101.4% for AGIs below $25k, 119.4% for AGIs $25k-50k, 158.9% for AGIs $50k-75k, 421.7% for AGIs $75k-100k, 648.2% for AGIs $100k-200k)
Total itemized deductions: $35,512 (reported on 5.0% of returns)
Here:
$35,512
State:
$35,601
(% of AGI for various income ranges: 450.0% for AGIs $50k-75k, 1168.2% for AGIs $100k-200k)
Charity contributions: $21,429 (reported on 4.3% of returns)
Here:
$21,429
State:
$15,596
(% of AGI for various income ranges: 211.1% for AGIs $50k-75k, 646.5% for AGIs $100k-200k)
Taxes paid: $7,288 (reported on 5.0% of returns)
46989:
$7,288
State:
$7,542
(% of AGI for various income ranges: 76.8% for AGIs $50k-75k, 257.1% for AGIs $100k-200k)
Earned income credit: $2,022 (reported on 11.2% of returns)
Here:
$2,022
State:
$2,298
(% of AGI for various income ranges: 54.0% for AGIs below $25k, 56.5% for AGIs $25k-50k)
Percentage of individuals using paid preparers for their 2020 taxes: 93.8%
Here:
94%
State:
94%
(% for various income ranges: 92.5% for AGIs below $25k, 94.6% for AGIs $25k-50k, 92.0% for AGIs $50k-75k, 94.4% for AGIs $75k-100k, 96.2% for AGIs $100k-200k, 100.0% for AGIs over 200k)
Averages for the 2012 tax year for zip code 46989, filed in 2013:
Average Adjusted Gross Income (AGI) in 2012: $45,867 (Individual Income Tax Returns)
Here:
$45,867
State:
$52,932
Salary/wage: $41,098 (reported on 85.6% of returns)
Here:
$41,098
State:
$45,173
(% of AGI for various income ranges: 72.3% for AGIs below $25k, 77.6% for AGIs $25k-50k, 76.4% for AGIs $50k-75k, 76.5% for AGIs $75k-100k, 78.0% for AGIs $100k-200k)
Taxable interest for individuals: $688 (reported on 39.5% of returns)
This zip code:
$688
Indiana:
$1,311
(% of AGI for various income ranges: 1.0% for AGIs below $25k, 0.7% for AGIs $25k-50k, 0.8% for AGIs $50k-75k, 0.4% for AGIs $75k-100k, 0.4% for AGIs $100k-200k)
Ordinary dividends: $1,878 (reported on 19.2% of returns)
Here:
$1,878
State:
$4,690
(% of AGI for various income ranges: 0.7% for AGIs below $25k, 0.9% for AGIs $25k-50k, 0.6% for AGIs $50k-75k, 0.7% for AGIs $75k-100k, 0.9% for AGIs $100k-200k)
Net capital gain/loss in AGI: +$2,421 (reported on 14.4% of returns)
Here:
+$2,421
State:
+$10,406
(% of AGI for various income ranges: 1.0% for AGIs $25k-50k, 0.9% for AGIs $50k-75k, 0.6% for AGIs $75k-100k, 1.0% for AGIs $100k-200k)
Profit/loss from business: +$7,008 (reported on 14.4% of returns)
Here:
+$7,008
State:
+$11,105
(% of AGI for various income ranges: 4.4% for AGIs below $25k, 2.2% for AGIs $25k-50k, 2.2% for AGIs $50k-75k, 2.5% for AGIs $75k-100k, 1.3% for AGIs $100k-200k)
Taxable individual retirement arrangement distribution: $10,600 (reported on 11.4% of returns)
46989:
$10,600
Indiana:
$13,841
(% of AGI for various income ranges: 4.0% for AGIs below $25k, 3.7% for AGIs $25k-50k, 2.3% for AGIs $50k-75k, 3.1% for AGIs $75k-100k, 1.6% for AGIs $100k-200k)
Total itemized deductions: $18,727 (22% of AGI, reported on 28.7% of returns)
Here:
$18,727
State:
$20,913
Here:
22.3% of AGI
State:
18.2% of AGI
(% of AGI for various income ranges: 4.9% for AGIs below $25k, 9.1% for AGIs $25k-50k, 10.0% for AGIs $50k-75k, 13.6% for AGIs $75k-100k, 15.0% for AGIs $100k-200k)
Charity contributions: $7,124 (reported on 22.8% of returns)
Here:
$7,124
State:
$4,697
(% of AGI for various income ranges: 2.7% for AGIs $25k-50k, 3.0% for AGIs $50k-75k, 4.5% for AGIs $75k-100k, 4.8% for AGIs $100k-200k)
Taxes paid: $5,679 (reported on 28.1% of returns)
46989:
$5,679
State:
$7,456
(% of AGI for various income ranges: 0.5% for AGIs below $25k, 1.7% for AGIs $25k-50k, 2.6% for AGIs $50k-75k, 3.8% for AGIs $75k-100k, 5.8% for AGIs $100k-200k)
Earned income credit: $2,013 (reported on 14.4% of returns)
Here:
$2,013
State:
$2,265
(% of AGI for various income ranges: 4.1% for AGIs below $25k, 1.5% for AGIs $25k-50k)
Percentage of individuals using paid preparers for their 2012 taxes: 46.7%
Here:
47%
State:
53%
(% for various income ranges: 42.0% for AGIs below $25k, 45.7% for AGIs $25k-50k, 50.0% for AGIs $50k-75k, 50.0% for AGIs $75k-100k, 58.8% for AGIs $100k-200k)
Averages for the 2004 tax year for zip code 46989, filed in 2005:
Average Adjusted Gross Income (AGI) in 2004: $42,799 (Individual Income Tax Returns)
Here:
$42,799
State:
$44,790
Salary/wage: $36,516 (reported on 88.0% of returns)
Here:
$36,516
State:
$39,615
(% of AGI for various income ranges: 77.0% for AGIs below $10k, 68.9% for AGIs $10k-25k, 81.0% for AGIs $25k-50k, 84.5% for AGIs $50k-75k, 82.9% for AGIs $75k-100k, 56.9% for AGIs over 100k)
Taxable interest for individuals: $704 (reported on 57.0% of returns)
This zip code:
$704
Indiana:
$1,535
(% of AGI for various income ranges: 3.5% for AGIs below $10k, 2.5% for AGIs $10k-25k, 1.0% for AGIs $25k-50k, 0.8% for AGIs $50k-75k, 0.7% for AGIs $75k-100k, 0.6% for AGIs over 100k)
Taxable dividends: $1,830 (reported on 24.3% of returns)
Here:
$1,830
State:
$2,998
(% of AGI for various income ranges: 2.9% for AGIs below $10k, 1.3% for AGIs $10k-25k, 0.5% for AGIs $25k-50k, 0.8% for AGIs $50k-75k, 0.5% for AGIs $75k-100k, 1.9% for AGIs over 100k)
Net capital gain/loss: +$2,767 (reported on 17.7% of returns)
Here:
+$2,767
State:
+$8,619
(% of AGI for various income ranges: -1.2% for AGIs below $10k, 0.1% for AGIs $10k-25k, 0.4% for AGIs $25k-50k, 0.2% for AGIs $50k-75k, 1.3% for AGIs $75k-100k, 3.1% for AGIs over 100k)
Profit/loss from business: +$4,838 (reported on 15.1% of returns)
Here:
+$4,838
State:
+$10,071
(% of AGI for various income ranges: 4.6% for AGIs below $10k, 2.8% for AGIs $10k-25k, 2.7% for AGIs $25k-50k, 1.1% for AGIs $50k-75k, 1.0% for AGIs $75k-100k, 1.4% for AGIs over 100k)
IRA payment deduction: $2,778 (reported on 1.7% of returns)
46989:
$2,778
Indiana:
$2,840
Total itemized deductions: $16,405 (23% of AGI, reported on 29.2% of returns)
Here:
$16,405
State:
$17,065
Here:
22.8% of AGI
State:
19.5% of AGI
(% of AGI for various income ranges: 6.8% for AGIs below $10k, 7.0% for AGIs $10k-25k, 9.0% for AGIs $25k-50k, 11.6% for AGIs $50k-75k, 14.0% for AGIs $75k-100k, 12.1% for AGIs over 100k)
Charity contributions deductions: $6,074 (8% of AGI, reported on 25.4% of returns)
Here:
$6,074
State:
$3,550
Here:
8.0% of AGI
State:
3.8% of AGI
(% of AGI for various income ranges: 1.1% for AGIs $10k-25k, 2.0% for AGIs $25k-50k, 3.7% for AGIs $50k-75k, 4.7% for AGIs $75k-100k, 5.0% for AGIs over 100k)
Total tax: $5,212 (reported on 73.3% of returns)
46989:
$5,212
State:
$6,914
(% of AGI for various income ranges: 2.0% for AGIs below $10k, 3.6% for AGIs $10k-25k, 6.1% for AGIs $25k-50k, 7.6% for AGIs $50k-75k, 10.0% for AGIs $75k-100k, 13.9% for AGIs over 100k)
Earned income credit: $1,545 (reported on 10.5% of returns)
Here:
$1,545
State:
$1,685
Percentage of individuals using paid preparers for their 2004 taxes: 50.1%
Here:
50%
State:
59%
(% for various income ranges: 36.9% for AGIs below $10k, 55.5% for AGIs $10k-25k, 51.4% for AGIs $25k-50k, 55.6% for AGIs $50k-75k, 53.5% for AGIs $75k-100k, 58.8% for AGIs over 100k)
Household received Food Stamps/SNAP in the past 12 months: 27 Household did not receive Food Stamps/SNAP in the past 12 months: 1,395
Women who had a birth in the past 12 months: 38 (41 now married, 0 unmarried) Women who did not have a birth in the past 12 months: 1,460 (489 now married, 968 unmarried)
Housing units in zip code 46989 with a mortgage: 817 (97 second mortgage, 80 both second mortgage and home equity loan) Houses without a mortgage: 8
Median monthly owner costs for units with a mortgage: $1,291 Median monthly owner costs for units without a mortgage: $476
Residents with income below the poverty level in 2022:
This zip code:
6.7%
Whole state:
12.6%
Residents with income below 50% of the poverty level in 2022:
This zip code:
1.0%
Whole state:
6.3%
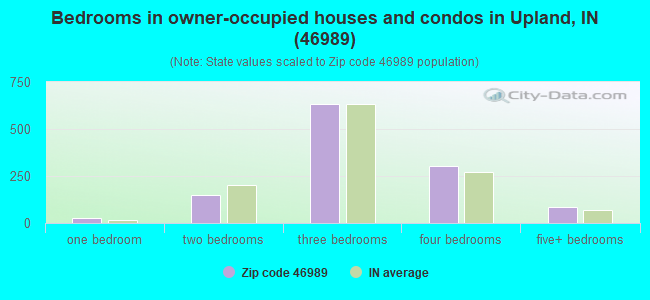
Median number of rooms in houses and condos:
Here:
6.9
State:
6.6
Median number of rooms in apartments:
Here:
4.9
State:
4.3
Notable locations in this zip code not listed on our city pages
Notable locations in zip code 46989: Purdue University Memorial Farm (A), Miller Purdue Agricultural Center (B), Upland Volunteer Fire Department (C). Display/hide their locations on the map
Streams, rivers, and creeks: Pike Creek (A), Upland Drain (B), Cane Run (C), Branch Creek (D), Little Walnut Creek (E). Display/hide their locations on the map
In group quarters: 1,355 (-1 institutionalized population)
Size of family households: 491 2-persons, 202 3-persons, 190 4-persons, 109 5-persons, 20 6-persons, 96 7-or-more-persons
Size of nonfamily households: 255 1-person, 60 2-persons
1,133 married couples with children.
121 single-parent households (9 men, 112 women).
93.5% of residents of 46989 zip code speak English at home.
2.0% of residents speak Spanish at home (72% very well, 28% well).
1.4% of residents speak other Indo-European language at home (100% very well).
1.0% of residents speak Asian or Pacific Island language at home (62% very well, 38% well).
1.4% of residents speak other language at home (16% very well, 84% well).
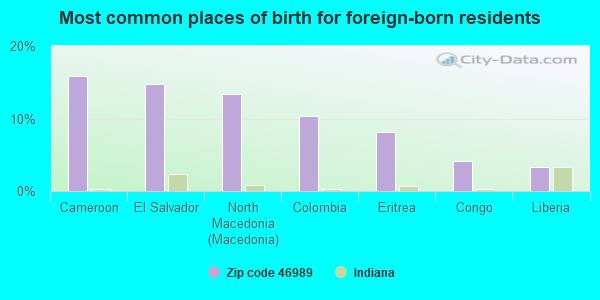
Foreign born population: 270 (4.8%) (42.9% of them are naturalized citizens)
This zip code:
4.8%
Whole state:
6.1%
16%Cameroon
15%El Salvador
13%North Macedonia (Macedonia)
10%Colombia
8%Eritrea
4%Congo
3%Liberia
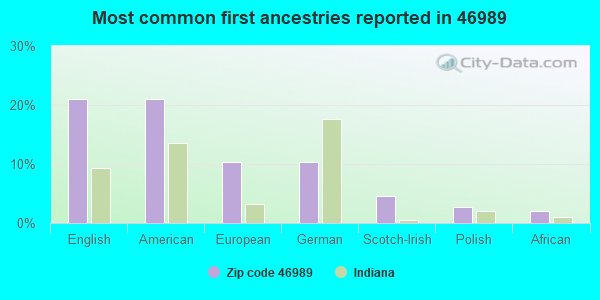
21%English
21%American
10%European
10%German
5%Scotch-Irish
3%Polish
2%African
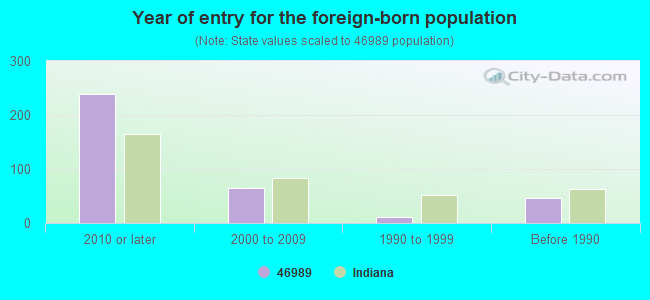
Year of entry for the foreign-born population
2412010 or later
642000 to 2009
01990 to 1999
41Before 1990
Facilities with environmental interests located in this zip code:
PIERCE CO (35 N EIGHTH ST in UPLAND, IN)
STATE MASTER (Indiana facility tracking) - ACES-OP-05300041, AIR PROGRAM, CRTK-5304, EPCRA, LUST-199010605, LEAKING STORAGE TANK, LUST-199010608, LUST-199306511, UST-8719, UNDERGROUND STORAGE TANK PROGRAM Conditionally Exempt Small Quantity Generators, less than 100 kg/month of hazardous waste (Resource Conservation and Recovery Act (tracking hazardous waste)) - notification TRI REPORTER (Tracking of toxic chemicals releasing facilities) Business SIC classification: MOTORS AND GENERATORS; MOTOR VEHICLE PARTS AND ACCESSORIES Organizations: AVIS INDUSTRIAL CORPORATION (CONTACT/OWNER)
DE HART ERNEST (710 W NORTH ST in UPLAND, IN)
STATE MASTER (Indiana facility tracking) (Resource Conservation and Recovery Act (tracking hazardous waste))
PEPL UPLAND M&R (.25 MI S OF SR 22 ON 8TH ST in UPLAND, IN)
STATE MASTER (Indiana facility tracking) Conditionally Exempt Small Quantity Generators, less than 100 kg/month of hazardous waste (Resource Conservation and Recovery Act (tracking hazardous waste)) - notification Organizations: PANHANDLE EASTERN PIPE LINE COMPANY (CONTACT/OWNER)
Housing units lacking complete plumbing facilities: 2.9% Housing units lacking complete kitchen facilities: 2.7%
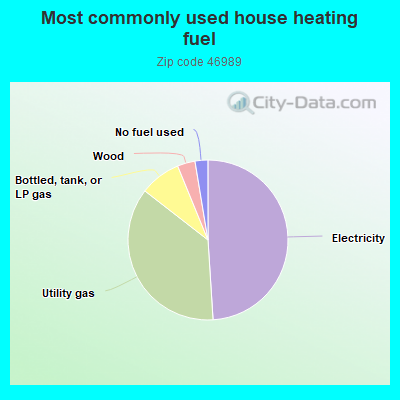
49.1%Electricity
36.6%Utility gas
8.3%Bottled, tank, or LP gas
3.6%Wood
2.6%No fuel used
Population in 1990: 6,027.
Place of birth for U.S.-born residents:
This state: 3,760
Northeast: 190
Midwest: 782
South: 345
West: 263
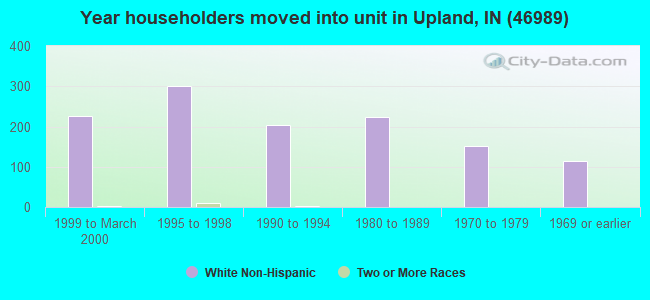
40% of the 46989 zip code residents lived in the same house 5 years ago. Out of people who lived in different houses, 31% lived in this county. Out of people who lived in different counties, 50% lived in Indiana.
89% of the 46989 zip code residents lived in the same house 1 year ago. Out of people who lived in different houses, 47% moved from this county. Out of people who lived in different houses, 20% moved from different county within same state. Out of people who lived in different houses, 25% moved from different state. Out of people who lived in different houses, 8% moved from abroad.
Private vs. public school enrollment:
Students in private schools in grades 1 to 8 (elementary and middle school): 98
Here:
13.9%
Indiana:
14.9%
Students in private schools in grades 9 to 12 (high school): 30
Here:
9.4%
Indiana:
11.4%
Students in private undergraduate colleges: 1,223
Here:
87.2%
Indiana:
22.3%
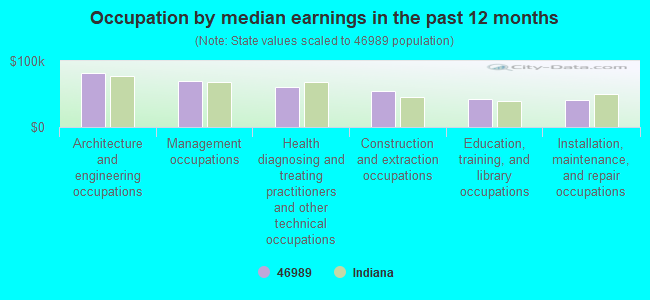
Occupation by median earnings in the past 12 months ($)
82,294Architecture and engineering occupations
69,943Management occupations
59,851Health diagnosing and treating practitioners and other technical occupations
54,563Construction and extraction occupations
41,850Education, training, and library occupations
41,131Installation, maintenance, and repair occupations
Top industries in this zip code by the number of employees in 2005:
Educational Services: Colleges, Universities, and Professional Schools (over 1000 employees: 1 establishment)
Accommodation and Food Services: Food Service Contractors (50-99: 1)
Health Care and Social Assistance: Residential Mental Retardation Facilities (10-19: 4)
Accommodation and Food Services: Limited-Service Restaurants (20-49: 1, 5-9: 1)
Other Services (except Public Administration): Religious Organizations (10-19: 1, 5-9: 2, 1-4: 2)
Management of Companies and Enterprises: Corporate, Subsidiary, and Regional Managing Offices (20-49: 1)
Construction: New Single-Family Housing Construction (except Operative Builders) (5-9: 2, 1-4: 1)
People in group quarters in 2010:
1,513 people in college/university student housing
56 people in nursing facilities/skilled-nursing facilities
7 people in group homes intended for adults
People in group quarters in 2000:
1,665 people in college dormitories (includes college quarters off campus)
45 people in nursing homes
7 people in homes for the mentally retarded
Fatal accident statistics in 2014:
Fatal accident count: 2
Vehicles involved in fatal accidents: 2
Fatal accidents caused by drunken drivers: 1
Fatalities: 2
Persons involved in fatal accidents: 2
Pedestrians involved in fatal accidents: 0
Fatal accident statistics in 2012:
Fatal accident count: 1
Vehicles involved in fatal accidents: 3
Fatal accidents caused by drunken drivers: 0
Fatalities: 2
Persons involved in fatal accidents: 5
Pedestrians involved in fatal accidents: 0
2002 - 2016 National Fire Incident Reporting System (NFIRS) incidents
According to the data from the years 2002 - 2016 the average number of fire incidents per year is 33. The highest number of fire incidents - 68 took place in 2005, and the least - 0 in 2015. The data has a dropping trend.
When looking into fire subcategories, the most reports belonged to: Structure Fires (48.0%), and Outside Fires (32.9%).
Fire incident types reported to NFIRS in Zip Code 46989

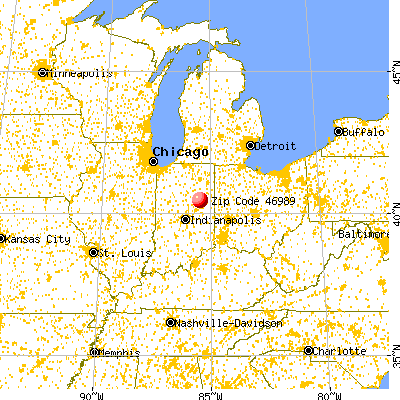


 Nearest zip codes: 46957, 46930, 46933, 47342, 47348, 46938.


 According to the data from the years 2002 - 2016 the average number of fire incidents per year is 33. The highest number of fire incidents - 68 took place in 2005, and the least - 0 in 2015. The data has a dropping trend.
 When looking into fire subcategories, the most reports belonged to: Structure Fires (48.0%), and Outside Fires (32.9%).