Estimated zip code population in 2022: 8,913 Zip code population in 2010: 9,269 Zip code population in 2000: 9,508
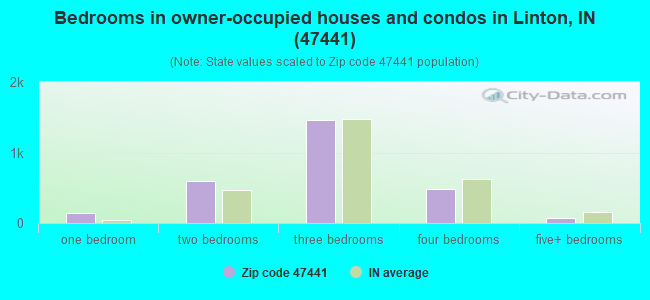
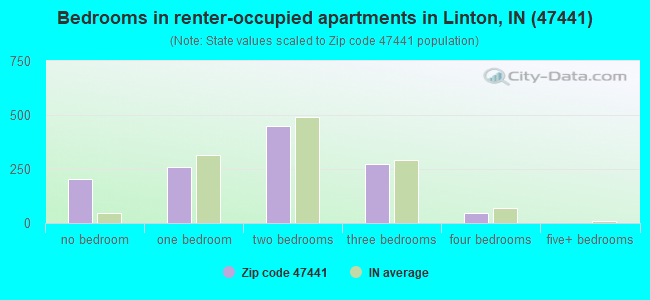
Houses and condos: 4,360 Renter-occupied apartments: 1,238
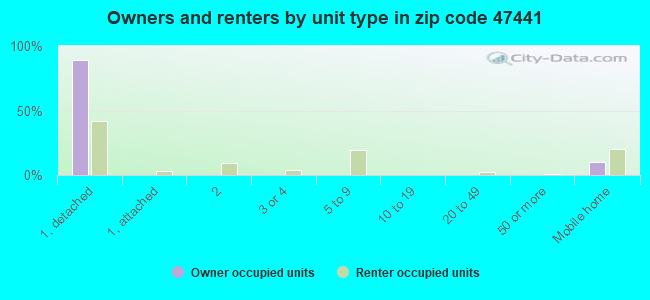
% of renters here:
31%
State:
29%
March 2022 cost of living index in zip code 47441: 83.9 (less than average, U.S. average is 100)
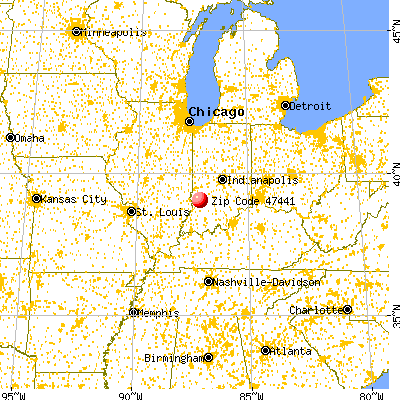
Land area: 67.1 sq. mi. Water area: 0.7 sq. mi.
Population density: 133 people per square mile
(very low).
OSM Map
General Map
Google Map
MSN Map
OSM Map
General Map
Google Map
MSN Map
OSM Map
General Map
Google Map
MSN Map
OSM Map
General Map
Google Map
MSN Map
Please wait while loading the map...
Real estate property taxes paid for housing units in 2022:
This zip code:
0.7% ($831)
Indiana:
0.7% ($1,467)
Median real estate property taxes paid for housing units with mortgages in 2022: $957 (0.7%) Median real estate property taxes paid for housing units with no mortgage in 2022: $712 (0.8%)
Business Search- 14 Million verified businesses
Males: 4,413
(49.5%)
Females: 4,499
(50.5%)
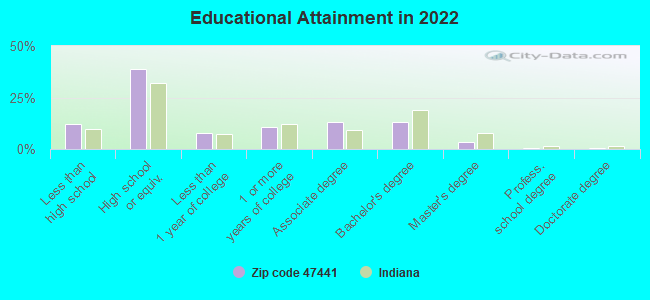
For population 25 years and over in 47441:
High school or higher: 87.2%
Bachelor's degree or higher: 17.4%
Graduate or professional degree: 4.4%
Unemployed: 5.7%
Mean travel time to work (commute): 25.1 minutes
For population 15 years and over in 47441:
Never married: 23.6%
Now married: 47.9%
Separated: 0.7%
Widowed: 9.3%
Divorced: 18.6%
Zip code 47441 compared to state average:
Median house value below state average.
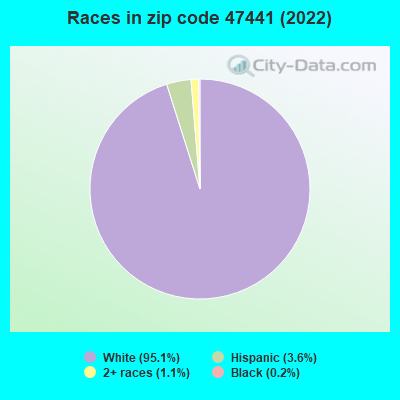
Black race population percentage significantly below state average.
Hispanic race population percentage below state average.
Foreign-born population percentage significantly below state average.
Length of stay since moving in significantly above state average.
Number of college students below state average.
Percentage of population with a bachelor's degree or higher below state average.
Estimated median house/condo value in 2022: $116,399
47441:
$116,399
Indiana:
$208,700
Median resident age:
This zip code:
41.4 years
Indiana median age:
38.2 years
Average household size:
This zip code:
2.2 people
Indiana:
2.4 people
Averages for the 2020 tax year for zip code 47441, filed in 2021:
Average Adjusted Gross Income (AGI) in 2020: $51,858 (Individual Income Tax Returns)
Here:
$51,858
State:
$64,978
Salary/wage: $45,650 (reported on 78.9% of returns)
Here:
$45,650
State:
$55,245
(% of AGI for various income ranges: 987.9% for AGIs below $25k, 3397.2% for AGIs $25k-50k, 6052.2% for AGIs $50k-75k, 8714.3% for AGIs $75k-100k, 15566.3% for AGIs $100k-200k, 34630.0% for AGIs over 200k)
Taxable interest for individuals: $815 (reported on 25.2% of returns)
This zip code:
$815
Indiana:
$1,351
(% of AGI for various income ranges: 17.3% for AGIs below $25k, 16.5% for AGIs $25k-50k, 42.4% for AGIs $50k-75k, 27.7% for AGIs $75k-100k, 74.7% for AGIs $100k-200k, 73.3% for AGIs over 200k)
Ordinary dividends: $3,015 (reported on 13.2% of returns)
Here:
$3,015
State:
$5,827
(% of AGI for various income ranges: 14.2% for AGIs below $25k, 19.4% for AGIs $25k-50k, 37.2% for AGIs $50k-75k, 74.7% for AGIs $75k-100k, 265.0% for AGIs $100k-200k, 490.0% for AGIs over 200k)
Net capital gain/loss in AGI: +$8,762 (reported on 11.5% of returns)
Here:
+$8,762
State:
+$17,730
(% of AGI for various income ranges: 6.1% for AGIs below $25k, 20.0% for AGIs $25k-50k, 56.3% for AGIs $50k-75k, 82.0% for AGIs $75k-100k, 360.3% for AGIs $100k-200k, 7956.7% for AGIs over 200k)
Profit/loss from business: +$9,923 (reported on 11.5% of returns)
Here:
+$9,923
State:
+$12,144
(% of AGI for various income ranges: 61.1% for AGIs below $25k, 80.2% for AGIs $25k-50k, 144.1% for AGIs $50k-75k, 178.0% for AGIs $75k-100k, 358.7% for AGIs $100k-200k, 3783.3% for AGIs over 200k)
Taxable individual retirement arrangement distribution: $14,131 (reported on 10.1% of returns)
47441:
$14,131
Indiana:
$18,302
(% of AGI for various income ranges: 65.3% for AGIs below $25k, 105.4% for AGIs $25k-50k, 198.5% for AGIs $50k-75k, 260.3% for AGIs $75k-100k, 877.7% for AGIs $100k-200k)
Total itemized deductions: $33,956 (reported on 2.2% of returns)
Here:
$33,956
State:
$35,601
(% of AGI for various income ranges: 264.3% for AGIs $50k-75k, 613.3% for AGIs $100k-200k)
Charity contributions: $12,786 (reported on 1.7% of returns)
Here:
$12,786
State:
$15,596
(% of AGI for various income ranges: 22.3% for AGIs $25k-50k, 237.3% for AGIs $100k-200k)
Taxes paid: $6,389 (reported on 2.2% of returns)
47441:
$6,389
State:
$7,542
(% of AGI for various income ranges: 30.7% for AGIs $50k-75k, 144.7% for AGIs $100k-200k)
Earned income credit: $2,330 (reported on 17.5% of returns)
Here:
$2,330
State:
$2,298
(% of AGI for various income ranges: 99.7% for AGIs below $25k, 68.8% for AGIs $25k-50k)
Percentage of individuals using paid preparers for their 2020 taxes: 95.7%
Here:
96%
State:
94%
(% for various income ranges: 95.6% for AGIs below $25k, 96.0% for AGIs $25k-50k, 95.1% for AGIs $50k-75k, 97.5% for AGIs $75k-100k, 95.8% for AGIs $100k-200k, 85.7% for AGIs over 200k)
Averages for the 2012 tax year for zip code 47441, filed in 2013:
Average Adjusted Gross Income (AGI) in 2012: $43,696 (Individual Income Tax Returns)
Here:
$43,696
State:
$52,932
Salary/wage: $39,425 (reported on 80.0% of returns)
Here:
$39,425
State:
$45,173
(% of AGI for various income ranges: 67.1% for AGIs below $25k, 73.8% for AGIs $25k-50k, 79.9% for AGIs $50k-75k, 82.7% for AGIs $75k-100k, 76.0% for AGIs $100k-200k, 29.4% for AGIs over 200k)
Taxable interest for individuals: $1,002 (reported on 30.3% of returns)
This zip code:
$1,002
Indiana:
$1,311
(% of AGI for various income ranges: 1.7% for AGIs below $25k, 0.8% for AGIs $25k-50k, 0.5% for AGIs $50k-75k, 0.4% for AGIs $75k-100k, 0.6% for AGIs $100k-200k, 0.3% for AGIs over 200k)
Ordinary dividends: $3,320 (reported on 15.9% of returns)
Here:
$3,320
State:
$4,690
(% of AGI for various income ranges: 1.1% for AGIs below $25k, 0.8% for AGIs $25k-50k, 0.6% for AGIs $50k-75k, 0.9% for AGIs $75k-100k, 1.1% for AGIs $100k-200k, 4.4% for AGIs over 200k)
Net capital gain/loss in AGI: +$5,206 (reported on 12.0% of returns)
Here:
+$5,206
State:
+$10,406
(% of AGI for various income ranges: 0.2% for AGIs $50k-75k, 0.6% for AGIs $75k-100k, 0.5% for AGIs $100k-200k, 13.4% for AGIs over 200k)
Profit/loss from business: +$10,821 (reported on 12.7% of returns)
Here:
+$10,821
State:
+$11,105
(% of AGI for various income ranges: 4.3% for AGIs below $25k, 1.9% for AGIs $25k-50k, 1.7% for AGIs $50k-75k, 2.2% for AGIs $75k-100k, 7.2% for AGIs $100k-200k)
Taxable individual retirement arrangement distribution: $9,566 (reported on 8.6% of returns)
47441:
$9,566
Indiana:
$13,841
(% of AGI for various income ranges: 2.4% for AGIs below $25k, 2.5% for AGIs $25k-50k, 1.7% for AGIs $50k-75k, 1.4% for AGIs $75k-100k, 2.4% for AGIs $100k-200k)
Total itemized deductions: $18,030 (19% of AGI, reported on 16.9% of returns)
Here:
$18,030
State:
$20,913
Here:
19.2% of AGI
State:
18.2% of AGI
(% of AGI for various income ranges: 4.9% for AGIs below $25k, 5.1% for AGIs $25k-50k, 6.1% for AGIs $50k-75k, 6.7% for AGIs $75k-100k, 9.2% for AGIs $100k-200k, 10.3% for AGIs over 200k)
Charity contributions: $4,138 (reported on 12.7% of returns)
Here:
$4,138
State:
$4,697
(% of AGI for various income ranges: 0.3% for AGIs below $25k, 1.0% for AGIs $25k-50k, 0.9% for AGIs $50k-75k, 1.1% for AGIs $75k-100k, 2.0% for AGIs $100k-200k, 2.0% for AGIs over 200k)
Taxes paid: $5,552 (reported on 16.9% of returns)
47441:
$5,552
State:
$7,456
(% of AGI for various income ranges: 0.5% for AGIs below $25k, 0.9% for AGIs $25k-50k, 1.5% for AGIs $50k-75k, 2.0% for AGIs $75k-100k, 3.6% for AGIs $100k-200k, 4.6% for AGIs over 200k)
Earned income credit: $2,178 (reported on 19.6% of returns)
Here:
$2,178
State:
$2,265
(% of AGI for various income ranges: 6.5% for AGIs below $25k, 1.1% for AGIs $25k-50k)
Percentage of individuals using paid preparers for their 2012 taxes: 68.9%
Here:
69%
State:
53%
(% for various income ranges: 65.1% for AGIs below $25k, 68.1% for AGIs $25k-50k, 73.3% for AGIs $50k-75k, 78.4% for AGIs $75k-100k, 74.2% for AGIs $100k-200k, 75.0% for AGIs over 200k)
Averages for the 2004 tax year for zip code 47441, filed in 2005:
Average Adjusted Gross Income (AGI) in 2004: $33,784 (Individual Income Tax Returns)
Here:
$33,784
State:
$44,790
Salary/wage: $32,262 (reported on 82.8% of returns)
Here:
$32,262
State:
$39,615
(% of AGI for various income ranges: 91.7% for AGIs below $10k, 68.1% for AGIs $10k-25k, 78.5% for AGIs $25k-50k, 85.6% for AGIs $50k-75k, 84.8% for AGIs $75k-100k, 69.6% for AGIs over 100k)
Taxable interest for individuals: $1,416 (reported on 41.2% of returns)
This zip code:
$1,416
Indiana:
$1,535
(% of AGI for various income ranges: 5.9% for AGIs below $10k, 3.6% for AGIs $10k-25k, 1.5% for AGIs $25k-50k, 1.0% for AGIs $50k-75k, 1.2% for AGIs $75k-100k, 1.6% for AGIs over 100k)
Taxable dividends: $1,497 (reported on 19.5% of returns)
Here:
$1,497
State:
$2,998
(% of AGI for various income ranges: 2.2% for AGIs below $10k, 0.7% for AGIs $10k-25k, 0.6% for AGIs $25k-50k, 0.6% for AGIs $50k-75k, 1.0% for AGIs $75k-100k, 1.6% for AGIs over 100k)
Net capital gain/loss: +$2,024 (reported on 15.1% of returns)
Here:
+$2,024
State:
+$8,619
(% of AGI for various income ranges: -3.0% for AGIs below $10k, -0.1% for AGIs $10k-25k, -0.0% for AGIs $25k-50k, 0.8% for AGIs $50k-75k, 0.5% for AGIs $75k-100k, 5.0% for AGIs over 100k)
Profit/loss from business: +$8,496 (reported on 13.6% of returns)
Here:
+$8,496
State:
+$10,071
(% of AGI for various income ranges: 6.9% for AGIs below $10k, 3.7% for AGIs $10k-25k, 2.3% for AGIs $25k-50k, 2.7% for AGIs $50k-75k, 3.5% for AGIs $75k-100k, 5.9% for AGIs over 100k)
IRA payment deduction: $2,974 (reported on 1.9% of returns)
47441:
$2,974
Indiana:
$2,840
(% of AGI for various income ranges: 0.2% for AGIs $10k-25k, 0.2% for AGIs $25k-50k, 0.2% for AGIs $50k-75k, 0.2% for AGIs $75k-100k)
Total itemized deductions: $14,484 (22% of AGI, reported on 19.6% of returns)
Here:
$14,484
State:
$17,065
Here:
21.5% of AGI
State:
19.5% of AGI
(% of AGI for various income ranges: 6.2% for AGIs below $10k, 4.7% for AGIs $10k-25k, 6.9% for AGIs $25k-50k, 8.7% for AGIs $50k-75k, 10.7% for AGIs $75k-100k, 11.9% for AGIs over 100k)
Charity contributions deductions: $3,029 (4% of AGI, reported on 16.8% of returns)
Here:
$3,029
State:
$3,550
Here:
4.3% of AGI
State:
3.8% of AGI
(% of AGI for various income ranges: 0.6% for AGIs below $10k, 0.8% for AGIs $10k-25k, 1.1% for AGIs $25k-50k, 1.4% for AGIs $50k-75k, 2.1% for AGIs $75k-100k, 2.5% for AGIs over 100k)
Total tax: $4,206 (reported on 69.1% of returns)
47441:
$4,206
State:
$6,914
(% of AGI for various income ranges: 2.2% for AGIs below $10k, 3.6% for AGIs $10k-25k, 6.3% for AGIs $25k-50k, 8.4% for AGIs $50k-75k, 11.1% for AGIs $75k-100k, 16.3% for AGIs over 100k)
Earned income credit: $1,567 (reported on 18.6% of returns)
Here:
$1,567
State:
$1,685
Percentage of individuals using paid preparers for their 2004 taxes: 72.6%
Here:
73%
State:
59%
(% for various income ranges: 67.6% for AGIs below $10k, 73.0% for AGIs $10k-25k, 75.3% for AGIs $25k-50k, 75.0% for AGIs $50k-75k, 70.1% for AGIs $75k-100k, 79.9% for AGIs over 100k)
Likely homosexual households (counted as self-reported same-sex unmarried-partner households)
Lesbian couples: 0.0% of all households
Gay men: 0.4% of all households
Household received Food Stamps/SNAP in the past 12 months: 501 Household did not receive Food Stamps/SNAP in the past 12 months: 3,515
Women who had a birth in the past 12 months: 61 (19 now married, 36 unmarried) Women who did not have a birth in the past 12 months: 2,007 (956 now married, 1,052 unmarried)
Housing units in zip code 47441 with a mortgage: 1,473 (216 second mortgage, 159 both second mortgage and home equity loan) Houses without a mortgage: 102
Median monthly owner costs for units with a mortgage: $1,126 Median monthly owner costs for units without a mortgage: $411
Residents with income below the poverty level in 2022:
This zip code:
13.3%
Whole state:
12.6%
Residents with income below 50% of the poverty level in 2022:
This zip code:
7.3%
Whole state:
6.3%
Median number of rooms in houses and condos:
Here:
6.3
State:
6.6
Median number of rooms in apartments:
Here:
4.0
State:
4.3
Notable locations in this zip code not listed on our city pages
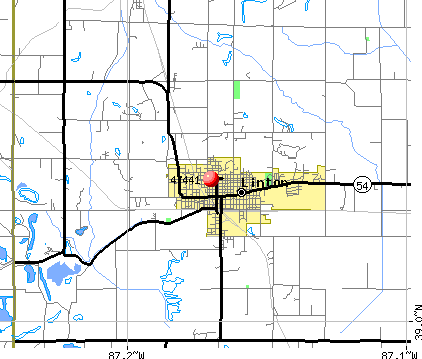
Churches in zip code 47441 include: Harrah Chapel (A), Lebanon Church (B), Morris Chapel (C), Olive Branch Church (D), Pleasant Grove Church (E), Salem Church (F), Ellis Church (G). Display/hide their locations on the map
Cemeteries: Frye Cemetery (1), Fairview Cemetery (2), German Cemetery (3), Terhune Cemetery (4), Island City Cemetery (5), Richards Cemetery (6), Clayton Cemetery (7). Display/hide their locations on the map
In group quarters: 72 (-1 institutionalized population)
Size of family households: 1,554 2-persons, 318 3-persons, 327 4-persons, 251 5-persons, 48 6-persons, 1 7-or-more-persons
Size of nonfamily households: 1,287 1-person, 176 2-persons, 50 3-persons
1,088 married couples with children.
379 single-parent households (169 men, 210 women).
97.8% of residents of 47441 zip code speak English at home.
1.9% of residents speak Spanish at home (2% very well, 14% well, 84% not well).
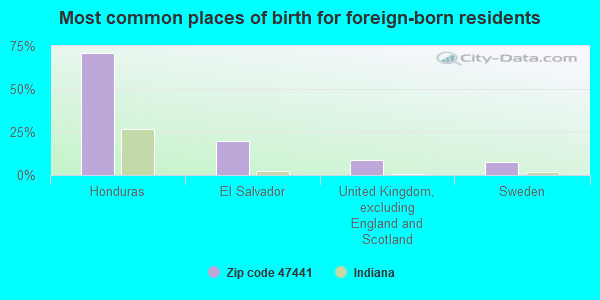
Foreign born population: 199 (2.2%) (23.7% of them are naturalized citizens)
This zip code:
2.2%
Whole state:
6.1%
71%Honduras
20%El Salvador
8%United Kingdom, excluding England and Scotland
7%Sweden
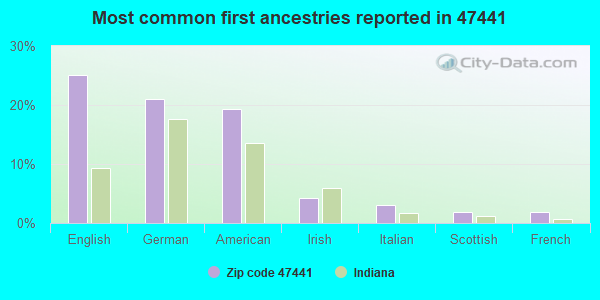
25%English
21%German
19%American
4%Irish
3%Italian
2%Scottish
2%French
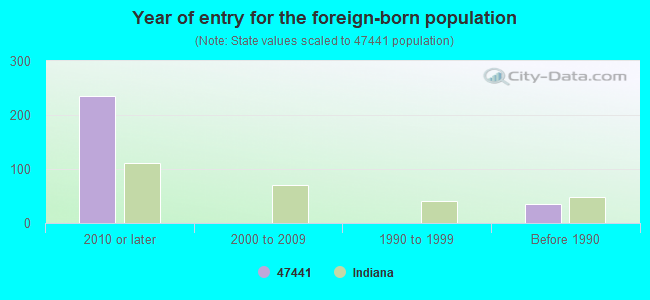
Year of entry for the foreign-born population
2352010 or later
02000 to 2009
01990 to 1999
36Before 1990
Facilities with environmental interests located in this zip code:
COCA COLA BOTTLING CO (SR 54 W in LINTON, IN)
STATE MASTER (Indiana facility tracking) STATE MASTER (Indiana facility tracking) - UST-17778, UNDERGROUND STORAGE TANK PROGRAM, UST-6413, Conditionally Exempt Small Quantity Generators, less than 100 kg/month of hazardous waste (Resource Conservation and Recovery Act (tracking hazardous waste)) - notification
LINTON SUB DISTRICT 66101 (89 D ST SW in LINTON, IN)
STATE MASTER (Indiana facility tracking) - CRTK-20463, EPCRA, LUST-199505512, LEAKING STORAGE TANK, UST-3660, UNDERGROUND STORAGE TANK PROGRAM Conditionally Exempt Small Quantity Generators, less than 100 kg/month of hazardous waste (Resource Conservation and Recovery Act (tracking hazardous waste)) Organizations: INDOT LINTON SUBDIST UNIT 66101 (CONTACT/OPERATOR)
, INDIANA STATE OF INDOT (CONTACT/OWNER)
Alternative names: INDOT LINTON SUBDIST UNIT 66101
LINTON-STOCKTON HIGH SCHOOL (10 NE 'H' ST in LINTON, IN)
(Geographic Names Information System) (National Center for Education Statistics) - STATE ID-2437 Organizations: LINTON-STOCKTON SCHOOL CORP (SCHOOL DISTRICT)
GREENE-SULLIVAN SP ED SCH (77 'A' ST NE in LINTON, IN)
(National Center for Education Statistics) - STATE ID-2462 Organizations: GREENE-SULLIVAN SP ED COOP (SCHOOL DISTRICT)
LINTON-STOCKTON ELEMENTARY (900 4TH ST NE in LINTON, IN)
(National Center for Education Statistics) - STATE ID-2441 Organizations: LINTON-STOCKTON SCHOOL CORP (SCHOOL DISTRICT)
LINTON-STOCKTON JR HIGH SCH (109 NE 'I' ST in LINTON, IN)
(National Center for Education Statistics) - STATE ID-2438 Organizations: LINTON-STOCKTON SCHOOL CORP (SCHOOL DISTRICT)
SECCO INC (ST RD 54 W in LINTON, IN)
STATE MASTER (Indiana facility tracking) (Resource Conservation and Recovery Act (tracking hazardous waste)) Organizations: FULLER LYNDELL (CONTACT/OWNER)
AT AND T (RT 1 in LINTON, IN)
STATE MASTER (Indiana facility tracking) (Resource Conservation and Recovery Act (tracking hazardous waste))
LINTON BP FOOD MART (1435 SR 54 E in LINTON, IN)
National Pollutant Discharge Elimination System NON-MAJOR (Tracking pollutant discharge elimination systems) - permit Business SIC classification: GASOLINE SERVICE STATIONS Organizations: CERTIFIED OPERATOR (CONTACT/OPERATOR)
, BISSEY INVESTMENTS LLC (CONTACT/OWNER)
Alternative names: LINTON SHELL
LINTON MUNICIPAL WWTP (12 ST SE in LINTON, IN)
STATE MASTER (Indiana facility tracking) National Pollutant Discharge Elimination System MAJOR (Tracking pollutant discharge elimination systems) - permit Business SIC classification: SEWERAGE SYSTEMS Organizations: DAVID FISH CERT OPER (CONTACT/OPERATOR)
, LINTON CITY HALL (CONTACT/OWNER)
Alternative names: LINTON MUNICIPAL STP
LINTON - STOCKTON SCHOOL CORPORATION (801 NORTHEAST 1ST ST in LINTON, IN)
STATE MASTER (Indiana facility tracking) COMPLIANCE ACTIVITY (Tracking inspections of insecticide, fungicide, and rodenticide, and toxic substances)
Housing units lacking complete plumbing facilities: 2.8% Housing units lacking complete kitchen facilities: 1.4%
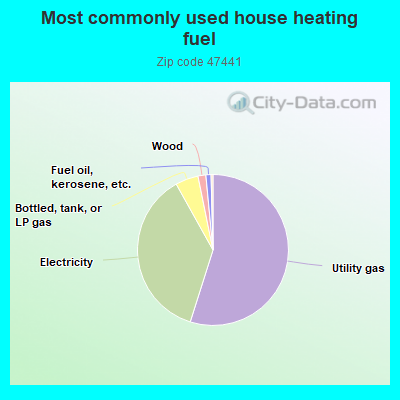
55.0%Utility gas
37.1%Electricity
4.9%Bottled, tank, or LP gas
1.7%Wood
1.1%Fuel oil, kerosene, etc.
Population in 1990: 9,233. Population change in the 1990s: +275 (+3.0%).
Place of birth for U.S.-born residents:
This state: 7,378
Northeast: 119
Midwest: 556
South: 505
West: 50
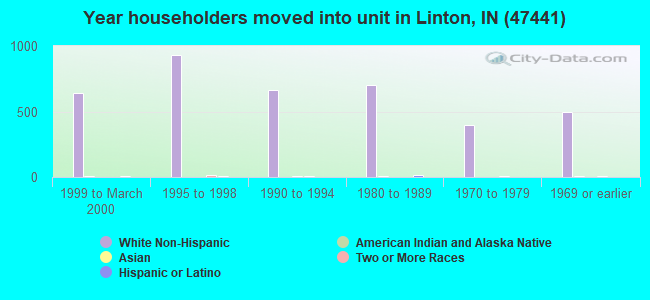
62% of the 47441 zip code residents lived in the same house 5 years ago. Out of people who lived in different houses, 66% lived in this county. Out of people who lived in different counties, 50% lived in Indiana.
87% of the 47441 zip code residents lived in the same house 1 year ago. Out of people who lived in different houses, 52% moved from this county. Out of people who lived in different houses, 28% moved from different county within same state. Out of people who lived in different houses, 5% moved from different state. Out of people who lived in different houses, 15% moved from abroad.
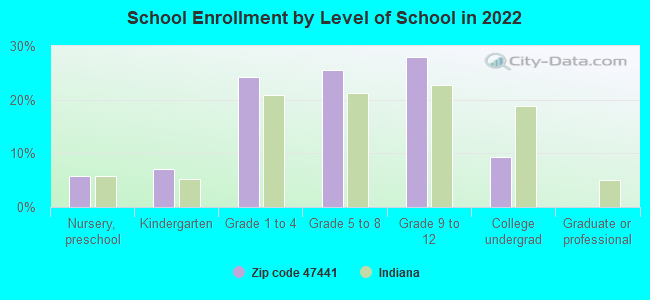
Private vs. public school enrollment:
Students in private schools in grades 1 to 8 (elementary and middle school): 4
Here:
0.6%
Indiana:
14.9%
Students in private schools in grades 9 to 12 (high school): 47
Here:
10.7%
Indiana:
11.4%
Students in private undergraduate colleges: 10
Here:
7.3%
Indiana:
22.3%
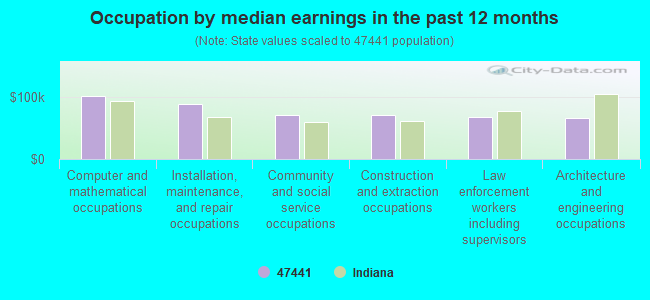
Occupation by median earnings in the past 12 months ($)
100,973Computer and mathematical occupations
88,078Installation, maintenance, and repair occupations
70,922Community and social service occupations
70,375Construction and extraction occupations
67,118Law enforcement workers including supervisors
66,449Architecture and engineering occupations
Companies with federal contracts located in this zip code:
CITY PEST CONTROL, INC (1349 N E A STREET in LINTON, IN; small business) : $1,120,060 in 75 contractsfrom 2000 to 2005
Contracts for Insect and Rodent Control Services, Maintenance, Repair or Alteration of Real Property -- Miscellaneous Buildings, Other Housekeeping Services by Navy Signed by year:2000: $54,633; 2001: $11,470; 2002: $489,444; 2003: $200,872; 2004: $273,478; 2005: $90,163; 2006: $0.
Biggest contracts:
$233,105 with Navy for Insect and Rodent Control Services. Signed on 2002-10-21. Completion date: 2003-01-31.
$96,534, same as above.Signed on 2002-08-26. Completion date: 2002-10-31.
$69,572, same as above.Signed on 2002-09-24. Completion date: 2002-11-30.
$50,700, same as above.Signed on 2004-08-06. Completion date: 2005-10-15.
ROSS'S FLOOR STORE (190 A ST NW in LINTON, IN; small business) : $109,404 in 16 contractsfrom 1999 to 2006
Contracts for Maintenance, Repair or Alteration of Real Property -- Miscellaneous Buildings, Maintenance, Repair or Alteration of Real Property -- Other Administrative Facilities and Service Buildings, Maintenance, Repair or Alteration of Real Property -- Office Buildings, Maintenance, Repair or Alteration of Real Property -- Other Warehouse Buildings, and moreby Navy, Army Signed by year:2000: $40,623; 2001: $0; 2002: $4,249; 2003: $0; 2004: $7,448; 2005: $14,428; 2006: $31,556.
Biggest contracts:
$23,906 with Navy for Maintenance, Repair or Alteration of Real Property -- Miscellaneous Buildings. Signed on 2006-03-29. Completion date: 2006-05-10.
$14,343 with Navy for Maintenance, Repair or Alteration of Real Property -- Other Administrative Facilities and Service Buildings. Signed on 2000-05-18. Completion date: 2000-11-17.
$12,360, same as above.Signed on 2000-02-01. Completion date: 2000-03-02.
$11,100 with Navy for Maintenance, Repair or Alteration of Real Property -- Office Buildings. Signed on 1999-12-03. Completion date: 1999-12-19.
LINTON SERVICE (310 NE C ST in LINTON, IN; small business) : $49,716 in 3 contractsfrom 2003 to 2005
$17,600 with Navy for Other Housekeeping Services. Signed on 2004-05-25. Completion date: 2005-05-26.
$17,600, same as above.Signed on 2003-04-30. Completion date: 2004-05-16.
$14,516, same as above.Signed on 2005-05-03. Completion date: 2006-05-15.
Top industries in this zip code by the number of employees in 2005:
2002 - 2018 National Fire Incident Reporting System (NFIRS) incidents
Based on the data from the years 2002 - 2018 the average number of fire incidents per year is 51. The highest number of reported fires - 122 took place in 2012, and the least - 0 in 2016. The data has a decreasing trend.
When looking into fire subcategories, the most reports belonged to: Outside Fires (48.6%), and Structure Fires (37.4%).
Fire incident types reported to NFIRS in Zip Code 47441


 Nearest zip codes: 47848, 47443, 47438, 47465, 47578, 47471.


 Based on the data from the years 2002 - 2018 the average number of fire incidents per year is 51. The highest number of reported fires - 122 took place in 2012, and the least - 0 in 2016. The data has a decreasing trend.
 When looking into fire subcategories, the most reports belonged to: Outside Fires (48.6%), and Structure Fires (37.4%).