Estimated zip code population in 2022: 1,062 Zip code population in 2010: 932 Zip code population in 2000: 763
Houses and condos: 401 Renter-occupied apartments: 48
% of renters here:
12%
State:
29%
March 2022 cost of living index in zip code 47943: 85.9 (less than average, U.S. average is 100)
Land area: 62.7 sq. mi. Water area: 0.1 sq. mi.
Population density: 17 people per square mile
(very low).
OSM Map
General Map
Google Map
MSN Map
OSM Map
General Map
Google Map
MSN Map
OSM Map
General Map
Google Map
MSN Map
OSM Map
General Map
Google Map
MSN Map
Please wait while loading the map...
Real estate property taxes paid for housing units in 2022:
This zip code:
0.6% ($2,222)
Indiana:
0.7% ($1,467)
Median real estate property taxes paid for housing units with mortgages in 2022: $2,243 (0.6%) Median real estate property taxes paid for housing units with no mortgage in 2022: $2,249 (1.0%)
Business Search- 14 Million verified businesses
Males: 529
(49.8%)
Females: 533
(50.2%)
For population 25 years and over in 47943:
High school or higher: 74.9%
Bachelor's degree or higher: 8.7%
Graduate or professional degree: 4.7%
Mean travel time to work (commute): 28.9 minutes
For population 15 years and over in 47943:
Never married: 33.1%
Now married: 51.3%
Separated: 0.0%
Widowed: 2.6%
Divorced: 13.1%
Zip code 47943 compared to state average:
Median house value above state average.
Unemployed percentage significantly below state average.
Black race population percentage significantly below state average.
Hispanic race population percentage significantly above state average.
Median age below state average.
Foreign-born population percentage significantly above state average.
Renting percentage significantly below state average.
Length of stay since moving in significantly above state average.
House age below state average.
Number of college students significantly below state average.
Percentage of population with a bachelor's degree or higher significantly below state average.
Estimated median house/condo value in 2022: $372,159
47943:
$372,159
Indiana:
$208,700
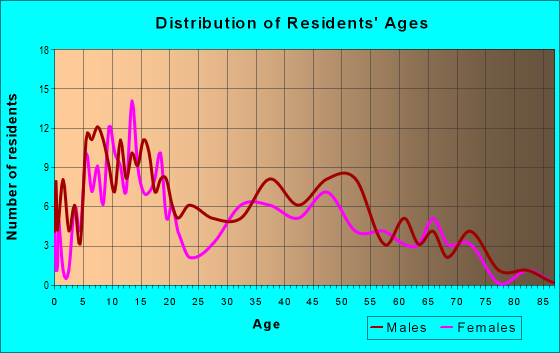
Median resident age:
This zip code:
33.7 years
Indiana median age:
38.2 years
Average household size:
This zip code:
2.8 people
Indiana:
2.4 people
Averages for the 2020 tax year for zip code 47943, filed in 2021:
Average Adjusted Gross Income (AGI) in 2020: $56,686 (Individual Income Tax Returns)
Here:
$56,686
State:
$64,978
Salary/wage: $50,802 (reported on 87.8% of returns)
Here:
$50,802
State:
$55,245
(% of AGI for various income ranges: 1144.0% for AGIs below $25k, 4338.9% for AGIs $25k-50k, 7488.6% for AGIs $50k-75k, 13240.0% for AGIs $75k-100k, 18955.0% for AGIs $100k-200k)
Taxable interest for individuals: $942 (reported on 24.5% of returns)
This zip code:
$942
Indiana:
$1,351
(% of AGI for various income ranges: 8.0% for AGIs below $25k, 11.1% for AGIs $25k-50k, 16.7% for AGIs $75k-100k, 225.0% for AGIs $100k-200k)
Ordinary dividends: $825 (reported on 8.2% of returns)
Here:
$825
State:
$5,827
(% of AGI for various income ranges: 10.0% for AGIs below $25k, 76.7% for AGIs $75k-100k)
Net capital gain/loss in AGI: +$760 (reported on 10.2% of returns)
Here:
+$760
State:
+$17,730
(% of AGI for various income ranges: 20.0% for AGIs below $25k, 60.0% for AGIs $75k-100k)
Profit/loss from business: +$4,400 (reported on 6.1% of returns)
Here:
+$4,400
State:
+$12,144
(% of AGI for various income ranges: 132.0% for AGIs below $25k)
Taxable individual retirement arrangement distribution: $8,600 (reported on 6.1% of returns)
47943:
$8,600
Indiana:
$18,302
(% of AGI for various income ranges: 258.0% for AGIs below $25k)
Earned income credit: $2,000 (reported on 8.2% of returns)
Here:
$2,000
State:
$2,298
(% of AGI for various income ranges: 36.0% for AGIs below $25k, 48.9% for AGIs $25k-50k)
Percentage of individuals using paid preparers for their 2020 taxes: 91.8%
Here:
92%
State:
94%
(% for various income ranges: 92.9% for AGIs below $25k, 91.7% for AGIs $25k-50k, 90.9% for AGIs $50k-75k, 100.0% for AGIs $75k-100k, 85.7% for AGIs $100k-200k)
Averages for the 2012 tax year for zip code 47943, filed in 2013:
Average Adjusted Gross Income (AGI) in 2012: $43,500 (Individual Income Tax Returns)
Here:
$43,500
State:
$52,932
Salary/wage: $42,940 (reported on 81.4% of returns)
Here:
$42,940
State:
$45,173
(% of AGI for various income ranges: 64.5% for AGIs below $25k, 88.7% for AGIs $25k-50k, 80.0% for AGIs $50k-75k, 85.2% for AGIs $75k-100k, 74.0% for AGIs $100k-200k)
Taxable interest for individuals: $462 (reported on 30.2% of returns)
This zip code:
$462
Indiana:
$1,311
(% of AGI for various income ranges: 0.9% for AGIs below $25k, 0.2% for AGIs $25k-50k, 0.4% for AGIs $50k-75k, 0.4% for AGIs $100k-200k)
Ordinary dividends: $600 (reported on 9.3% of returns)
Here:
$600
State:
$4,690
Profit/loss from business: +$3,350 (reported on 9.3% of returns)
Here:
+$3,350
State:
+$11,105
Taxable individual retirement arrangement distribution: $3,000 (reported on 4.7% of returns)
47943:
$3,000
Indiana:
$13,841
Total itemized deductions: $16,200 (21% of AGI, reported on 23.3% of returns)
Here:
$16,200
State:
$20,913
Here:
21.3% of AGI
State:
18.2% of AGI
(% of AGI for various income ranges: 20.4% for AGIs below $25k, 10.3% for AGIs $50k-75k, 11.7% for AGIs $75k-100k, 10.6% for AGIs $100k-200k)
Charity contributions: $2,920 (reported on 11.6% of returns)
Here:
$2,920
State:
$4,697
Taxes paid: $6,811 (reported on 20.9% of returns)
47943:
$6,811
State:
$7,456
(% of AGI for various income ranges: 4.6% for AGIs below $25k, 2.9% for AGIs $50k-75k, 4.5% for AGIs $75k-100k, 5.9% for AGIs $100k-200k)
Earned income credit: $2,217 (reported on 14.0% of returns)
Here:
$2,217
State:
$2,265
(% of AGI for various income ranges: 8.3% for AGIs below $25k)
Percentage of individuals using paid preparers for their 2012 taxes: 69.8%
Here:
70%
State:
53%
(% for various income ranges: 64.3% for AGIs below $25k, 71.4% for AGIs $25k-50k, 85.7% for AGIs $50k-75k, 75.0% for AGIs $75k-100k, 50.0% for AGIs $100k-200k)
Averages for the 2004 tax year for zip code 47943, filed in 2005:
Average Adjusted Gross Income (AGI) in 2004: $40,516 (Individual Income Tax Returns)
Here:
$40,516
State:
$44,790
Salary/wage: $35,433 (reported on 88.2% of returns)
Here:
$35,433
State:
$39,615
(% of AGI for various income ranges: 102.9% for AGIs below $10k, 81.4% for AGIs $10k-25k, 78.8% for AGIs $25k-50k, 84.4% for AGIs $50k-75k, 80.9% for AGIs $75k-100k, 58.8% for AGIs over 100k)
Taxable interest for individuals: $874 (reported on 44.7% of returns)
This zip code:
$874
Indiana:
$1,535
(% of AGI for various income ranges: 4.0% for AGIs below $10k, 1.4% for AGIs $10k-25k, 1.2% for AGIs $25k-50k, 0.9% for AGIs $50k-75k, 0.2% for AGIs $75k-100k, 0.9% for AGIs over 100k)
Taxable dividends: $434 (reported on 14.2% of returns)
Here:
$434
State:
$2,998
(% of AGI for various income ranges: 0.1% for AGIs $10k-25k, 0.2% for AGIs $25k-50k, 0.1% for AGIs $50k-75k, 0.3% for AGIs over 100k)
Net capital gain/loss: +$4,200 (reported on 8.0% of returns)
Here:
+$4,200
State:
+$8,619
Profit/loss from business: +$892 (reported on 9.9% of returns)
Here:
+$892
State:
+$10,071
IRA payment deduction: $3,909 (reported on 2.9% of returns)
47943:
$3,909
Indiana:
$2,840
Total itemized deductions: $17,481 (22% of AGI, reported on 21.1% of returns)
Here:
$17,481
State:
$17,065
Here:
22.4% of AGI
State:
19.5% of AGI
(% of AGI for various income ranges: 7.1% for AGIs $25k-50k, 9.4% for AGIs $50k-75k, 12.7% for AGIs $75k-100k, 13.6% for AGIs over 100k)
Charity contributions deductions: $2,868 (3% of AGI, reported on 14.2% of returns)
Here:
$2,868
State:
$3,550
Here:
3.5% of AGI
State:
3.8% of AGI
(% of AGI for various income ranges: 4.7% for AGIs below $10k, 0.8% for AGIs $50k-75k, 2.2% for AGIs $75k-100k, 1.8% for AGIs over 100k)
Total tax: $4,725 (reported on 71.9% of returns)
47943:
$4,725
State:
$6,914
(% of AGI for various income ranges: 2.9% for AGIs below $10k, 4.3% for AGIs $10k-25k, 4.8% for AGIs $25k-50k, 8.2% for AGIs $50k-75k, 9.0% for AGIs $75k-100k, 15.4% for AGIs over 100k)
Earned income credit: $1,581 (reported on 11.5% of returns)
Here:
$1,581
State:
$1,685
Percentage of individuals using paid preparers for their 2004 taxes: 69.5%
Here:
70%
State:
59%
(% for various income ranges: 55.6% for AGIs below $10k, 61.5% for AGIs $10k-25k, 81.4% for AGIs $25k-50k, 64.5% for AGIs $50k-75k, 86.2% for AGIs $75k-100k, 75.0% for AGIs over 100k)
Household received Food Stamps/SNAP in the past 12 months: 0 Household did not receive Food Stamps/SNAP in the past 12 months: 384
Women who had a birth in the past 12 months: 54 (58 now married, 0 unmarried) Women who did not have a birth in the past 12 months: 319 (112 now married, 206 unmarried)
Housing units in zip code 47943 with a mortgage: 300 (16 second mortgage, 17 both second mortgage and home equity loan) Houses without a mortgage: 33
Median monthly owner costs for units with a mortgage: $1,532 Median monthly owner costs for units without a mortgage: $529
Residents with income below the poverty level in 2022:
This zip code:
15.8%
Whole state:
12.6%
Median number of rooms in houses and condos:
Here:
5.8
State:
6.6
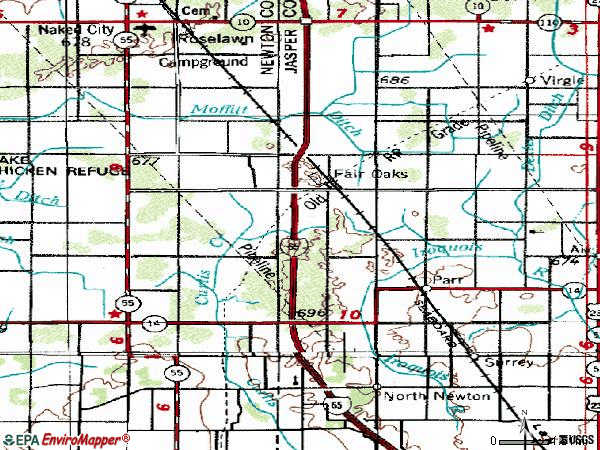
Notable locations in this zip code not listed on our city pages
Size of family households: 86 2-persons, 174 3-persons, 86 4-persons
Size of nonfamily households: 35 1-person
172 married couples with children.
98 single-parent households (98 women).
72.4% of residents of 47943 zip code speak English at home.
26.9% of residents speak Spanish at home (51% very well, 10% well, 29% not well, 10% not at all).
Foreign born population: 187 (17.6%) (30.7% of them are naturalized citizens)
This zip code:
17.6%
Whole state:
6.1%
72%Honduras
18%Costa Rica
15%Dutch
5%Italian
4%American
Year of entry for the foreign-born population
752010 or later
1162000 to 2009
01990 to 1999
0Before 1990
Facilities with environmental interests located in this zip code:
FAIR OAKS DAIRY NORTH (5431 E 600 N in FAIR OAKS, IN)
STATE MASTER (Indiana facility tracking) National Pollutant Discharge Elimination System NON-MAJOR (Tracking pollutant discharge elimination systems) - permit Business SIC classification: DAIRY FARMS
38.7%Utility gas
28.8%Bottled, tank, or LP gas
15.9%Wood
10.8%Electricity
6.7%Other fuel
Population in 1990: 1,254.
Place of birth for U.S.-born residents:
This state: 739
Northeast: 47
Midwest: 83
South: 12
78% of the 47943 zip code residents lived in the same house 5 years ago. Out of people who lived in different houses, 19% lived in this county. Out of people who lived in different counties, 50% lived in Indiana.
83% of the 47943 zip code residents lived in the same house 1 year ago. Out of people who lived in different houses, 19% moved from this county. Out of people who lived in different houses, 83% moved from different state.
Private vs. public school enrollment:
Students in private schools in grades 1 to 8 (elementary and middle school):
Here:
0.0%
Indiana:
14.9%
Students in private schools in grades 9 to 12 (high school):
Here:
0.0%
Indiana:
11.4%
Occupation by median earnings in the past 12 months ($)
55,346Health diagnosing and treating practitioners and other technical occupations
53,166Healthcare support occupations
46,525Construction and extraction occupations
37,557Office and administrative support occupations
28,754Farming, fishing, and forestry occupations
Top industries in this zip code by the number of employees in 2005:
Educational Services: All Other Miscellaneous Schools and Instruction (10-19 employees: 1 establishment)
Construction: Site Preparation Contractors (1-4: 1)
Construction: All Other Specialty Trade Contractors (1-4: 1)
Wholesale Trade: Automobile and Other Motor Vehicle Merchant Wholesalers (1-4: 1)
Accommodation and Food Services: RV (Recreational Vehicle) Parks and Campgrounds (1-4: 1)
Construction: New Single-Family Housing Construction (except Operative Builders) (1-4: 1)
Fatal accident statistics in 2014:
Fatal accident count: 1
Vehicles involved in fatal accidents: 1
Fatal accidents caused by drunken drivers: 0
Fatalities: 1
Persons involved in fatal accidents: 1
Pedestrians involved in fatal accidents: 0
Fatal accident statistics in 2013:
Fatal accident count: 3
Vehicles involved in fatal accidents: 5
Fatal accidents caused by drunken drivers: 2
Fatalities: 3
Persons involved in fatal accidents: 7
Pedestrians involved in fatal accidents: 0
Home Mortgage Disclosure Act Aggregated Statistics For Year 2009 (Based on 2 partial tracts)
A) FHA, FSA/RHS & VA Home Purchase Loans
B) Conventional Home Purchase Loans
C) Refinancings
D) Home Improvement Loans
F) Non-occupant Loans on < 5 Family Dwellings (A B C & D)
G) Loans On Manufactured Home Dwelling (A B C & D)
Number
Average Value
Number
Average Value
Number
Average Value
Number
Average Value
Number
Average Value
Number
Average Value
LOANS ORIGINATED
10
$145,111
11
$144,107
92
$153,029
7
$36,904
3
$69,780
5
$105,560
APPLICATIONS APPROVED, NOT ACCEPTED
1
$154,110
0
$0
9
$147,922
0
$0
0
$0
0
$0
APPLICATIONS DENIED
2
$138,295
3
$95,910
27
$162,521
3
$69,780
1
$121,590
1
$54,780
APPLICATIONS WITHDRAWN
0
$0
1
$207,110
11
$177,998
0
$0
0
$0
0
$0
FILES CLOSED FOR INCOMPLETENESS
1
$224,480
0
$0
4
$195,642
1
$69,930
0
$0
0
$0
Aggregated Statistics For Year 2008 (Based on 2 partial tracts)
A) FHA, FSA/RHS & VA Home Purchase Loans
B) Conventional Home Purchase Loans
C) Refinancings
D) Home Improvement Loans
F) Non-occupant Loans on < 5 Family Dwellings (A B C & D)
G) Loans On Manufactured Home Dwelling (A B C & D)
Number
Average Value
Number
Average Value
Number
Average Value
Number
Average Value
Number
Average Value
Number
Average Value
LOANS ORIGINATED
11
$128,195
20
$174,931
56
$142,608
8
$71,098
1
$99,770
6
$91,530
APPLICATIONS APPROVED, NOT ACCEPTED
0
$0
3
$271,843
4
$202,435
2
$63,025
0
$0
0
$0
APPLICATIONS DENIED
0
$0
3
$133,470
18
$150,594
4
$23,160
1
$17,820
2
$97,765
APPLICATIONS WITHDRAWN
0
$0
1
$186,180
8
$171,925
0
$0
0
$0
0
$0
FILES CLOSED FOR INCOMPLETENESS
0
$0
0
$0
2
$123,820
0
$0
0
$0
0
$0
Aggregated Statistics For Year 2007 (Based on 2 partial tracts)
A) FHA, FSA/RHS & VA Home Purchase Loans
B) Conventional Home Purchase Loans
C) Refinancings
D) Home Improvement Loans
F) Non-occupant Loans on < 5 Family Dwellings (A B C & D)
G) Loans On Manufactured Home Dwelling (A B C & D)
Number
Average Value
Number
Average Value
Number
Average Value
Number
Average Value
Number
Average Value
Number
Average Value
LOANS ORIGINATED
5
$131,750
30
$146,492
52
$145,140
12
$38,712
4
$167,360
7
$90,099
APPLICATIONS APPROVED, NOT ACCEPTED
0
$0
2
$99,545
8
$109,234
2
$64,360
0
$0
1
$99,770
APPLICATIONS DENIED
1
$189,300
8
$121,818
24
$172,500
4
$32,292
1
$87,300
4
$108,455
APPLICATIONS WITHDRAWN
0
$0
3
$100,810
10
$214,861
0
$0
0
$0
0
$0
FILES CLOSED FOR INCOMPLETENESS
0
$0
1
$112,690
3
$232,203
0
$0
0
$0
0
$0
Aggregated Statistics For Year 2006 (Based on 2 partial tracts)
A) FHA, FSA/RHS & VA Home Purchase Loans
B) Conventional Home Purchase Loans
C) Refinancings
D) Home Improvement Loans
F) Non-occupant Loans on < 5 Family Dwellings (A B C & D)
G) Loans On Manufactured Home Dwelling (A B C & D)
Number
Average Value
Number
Average Value
Number
Average Value
Number
Average Value
Number
Average Value
Number
Average Value
LOANS ORIGINATED
4
$122,485
35
$124,750
47
$117,216
9
$58,594
6
$123,673
6
$80,023
APPLICATIONS APPROVED, NOT ACCEPTED
0
$0
5
$107,786
7
$129,676
0
$0
1
$93,090
1
$45,430
APPLICATIONS DENIED
1
$143,860
11
$103,293
34
$145,135
8
$40,699
2
$87,965
4
$72,600
APPLICATIONS WITHDRAWN
1
$178,610
6
$103,037
20
$150,679
1
$128,280
1
$95,320
1
$75,720
FILES CLOSED FOR INCOMPLETENESS
0
$0
2
$104,225
4
$206,442
0
$0
0
$0
0
$0
Aggregated Statistics For Year 2005 (Based on 2 partial tracts)
A) FHA, FSA/RHS & VA Home Purchase Loans
B) Conventional Home Purchase Loans
C) Refinancings
D) Home Improvement Loans
F) Non-occupant Loans on < 5 Family Dwellings (A B C & D)
G) Loans On Manufactured Home Dwelling (A B C & D)
Number
Average Value
Number
Average Value
Number
Average Value
Number
Average Value
Number
Average Value
Number
Average Value
LOANS ORIGINATED
5
$114,200
37
$128,696
50
$128,676
9
$66,364
4
$77,945
7
$92,516
APPLICATIONS APPROVED, NOT ACCEPTED
0
$0
7
$106,833
9
$129,809
1
$15,590
0
$0
0
$0
APPLICATIONS DENIED
0
$0
8
$116,305
36
$119,961
7
$48,930
3
$121,447
1
$193,750
APPLICATIONS WITHDRAWN
0
$0
5
$134,066
23
$134,627
6
$113,132
2
$78,390
0
$0
FILES CLOSED FOR INCOMPLETENESS
0
$0
2
$60,575
5
$167,382
0
$0
2
$99,100
0
$0
Aggregated Statistics For Year 2004 (Based on 2 partial tracts)
A) FHA, FSA/RHS & VA Home Purchase Loans
B) Conventional Home Purchase Loans
C) Refinancings
D) Home Improvement Loans
F) Non-occupant Loans on < 5 Family Dwellings (A B C & D)
G) Loans On Manufactured Home Dwelling (A B C & D)


 Nearest zip codes: 47964, 46381, 46310, 46349, 46377, 47963.