Estimated zip code population in 2022: 2,210 Zip code population in 2010: 2,034 Zip code population in 2000: 2,094
Houses and condos: 899 Renter-occupied apartments: 200
% of renters here:
23%
State:
29%
March 2022 cost of living index in zip code 47970: 85.6 (less than average, U.S. average is 100)
Land area: 58.7 sq. mi. Water area: 0.4 sq. mi.
Population density: 38 people per square mile
(very low).
OSM Map
General Map
Google Map
MSN Map
OSM Map
General Map
Google Map
MSN Map
OSM Map
General Map
Google Map
MSN Map
OSM Map
General Map
Google Map
MSN Map
Please wait while loading the map...
Real estate property taxes paid for housing units in 2022:
This zip code:
0.5% ($917)
Indiana:
0.7% ($1,467)
Median real estate property taxes paid for housing units with mortgages in 2022: $983 (0.5%) Median real estate property taxes paid for housing units with no mortgage in 2022: $674 (0.4%)
Business Search- 14 Million verified businesses
Males: 1,037
(47.0%)
Females: 1,172
(53.0%)
For population 25 years and over in 47970:
High school or higher: 89.6%
Bachelor's degree or higher: 25.0%
Graduate or professional degree: 9.4%
Unemployed: 2.8%
Mean travel time to work (commute): 26.2 minutes
For population 15 years and over in 47970:
Never married: 26.7%
Now married: 51.4%
Separated: 1.2%
Widowed: 4.7%
Divorced: 16.0%
Zip code 47970 compared to state average:
Black race population percentage significantly below state average.
Hispanic race population percentage below state average.
Median age above state average.
Foreign-born population percentage significantly below state average.
Length of stay since moving in below state average.
Estimated median house/condo value in 2022: $180,396
47970:
$180,396
Indiana:
$208,700
Median resident age:
This zip code:
43.5 years
Indiana median age:
38.2 years
Average household size:
This zip code:
2.6 people
Indiana:
2.4 people
Averages for the 2020 tax year for zip code 47970, filed in 2021:
Average Adjusted Gross Income (AGI) in 2020: $62,187 (Individual Income Tax Returns)
Here:
$62,187
State:
$64,978
Salary/wage: $49,065 (reported on 83.5% of returns)
Here:
$49,065
State:
$55,245
(% of AGI for various income ranges: 1191.4% for AGIs below $25k, 3568.2% for AGIs $25k-50k, 6575.8% for AGIs $50k-75k, 10755.0% for AGIs $75k-100k, 21495.7% for AGIs $100k-200k)
Taxable interest for individuals: $537 (reported on 30.9% of returns)
This zip code:
$537
Indiana:
$1,351
(% of AGI for various income ranges: 3.8% for AGIs below $25k, 10.9% for AGIs $25k-50k, 10.0% for AGIs $50k-75k, 63.3% for AGIs $75k-100k, 72.9% for AGIs $100k-200k)
Ordinary dividends: $4,457 (reported on 14.4% of returns)
Here:
$4,457
State:
$5,827
(% of AGI for various income ranges: 28.6% for AGIs $25k-50k, 65.0% for AGIs $75k-100k, 137.1% for AGIs $100k-200k)
Net capital gain/loss in AGI: +$7,917 (reported on 12.4% of returns)
Here:
+$7,917
State:
+$17,730
(% of AGI for various income ranges: 114.2% for AGIs $50k-75k, 430.0% for AGIs $100k-200k)
Profit/loss from business: +$9,400 (reported on 13.4% of returns)
Here:
+$9,400
State:
+$12,144
(% of AGI for various income ranges: 45.7% for AGIs below $25k, 65.5% for AGIs $25k-50k, 319.2% for AGIs $50k-75k, 855.7% for AGIs $100k-200k)
Taxable individual retirement arrangement distribution: $11,688 (reported on 8.2% of returns)
47970:
$11,688
Indiana:
$18,302
(% of AGI for various income ranges: 80.5% for AGIs below $25k, 253.3% for AGIs $50k-75k, 660.0% for AGIs $100k-200k)
Earned income credit: $2,362 (reported on 16.5% of returns)
Here:
$2,362
State:
$2,298
(% of AGI for various income ranges: 107.6% for AGIs below $25k, 69.1% for AGIs $25k-50k)
Percentage of individuals using paid preparers for their 2020 taxes: 94.8%
Here:
95%
State:
94%
(% for various income ranges: 93.1% for AGIs below $25k, 96.3% for AGIs $25k-50k, 93.8% for AGIs $50k-75k, 100.0% for AGIs $75k-100k, 100.0% for AGIs $100k-200k, 66.7% for AGIs over 200k)
Averages for the 2012 tax year for zip code 47970, filed in 2013:
Average Adjusted Gross Income (AGI) in 2012: $47,343 (Individual Income Tax Returns)
Here:
$47,343
State:
$52,932
Salary/wage: $39,649 (reported on 84.5% of returns)
Here:
$39,649
State:
$45,173
(% of AGI for various income ranges: 76.4% for AGIs below $25k, 85.3% for AGIs $25k-50k, 86.3% for AGIs $50k-75k, 77.5% for AGIs $75k-100k, 47.8% for AGIs $100k-200k)
Taxable interest for individuals: $638 (reported on 29.9% of returns)
This zip code:
$638
Indiana:
$1,311
(% of AGI for various income ranges: 0.9% for AGIs below $25k, 0.2% for AGIs $25k-50k, 0.4% for AGIs $50k-75k, 0.2% for AGIs $75k-100k, 0.5% for AGIs $100k-200k)
Ordinary dividends: $1,493 (reported on 14.4% of returns)
Here:
$1,493
State:
$4,690
(% of AGI for various income ranges: 1.0% for AGIs below $25k, 0.5% for AGIs $50k-75k, 0.7% for AGIs $100k-200k)
Net capital gain/loss in AGI: +$7,100 (reported on 9.3% of returns)
Here:
+$7,100
State:
+$10,406
(% of AGI for various income ranges: 0.2% for AGIs $50k-75k, 4.1% for AGIs $100k-200k)
Profit/loss from business: +$7,207 (reported on 15.5% of returns)
Here:
+$7,207
State:
+$11,105
(% of AGI for various income ranges: 3.9% for AGIs below $25k, 1.4% for AGIs $25k-50k, 3.1% for AGIs $50k-75k, 3.2% for AGIs $100k-200k)
Taxable individual retirement arrangement distribution: $7,783 (reported on 6.2% of returns)
47970:
$7,783
Indiana:
$13,841
Total itemized deductions: $17,316 (18% of AGI, reported on 19.6% of returns)
Here:
$17,316
State:
$20,913
Here:
17.9% of AGI
State:
18.2% of AGI
(% of AGI for various income ranges: 7.2% for AGIs $25k-50k, 7.6% for AGIs $50k-75k, 7.0% for AGIs $75k-100k, 9.1% for AGIs $100k-200k)
Charity contributions: $3,693 (reported on 14.4% of returns)
Here:
$3,693
State:
$4,697
(% of AGI for various income ranges: 1.2% for AGIs $25k-50k, 0.6% for AGIs $50k-75k, 1.2% for AGIs $75k-100k, 1.7% for AGIs $100k-200k)
Taxes paid: $6,347 (reported on 19.6% of returns)
47970:
$6,347
State:
$7,456
(% of AGI for various income ranges: 1.7% for AGIs $25k-50k, 2.1% for AGIs $50k-75k, 2.7% for AGIs $75k-100k, 4.2% for AGIs $100k-200k)
Earned income credit: $2,033 (reported on 18.6% of returns)
Here:
$2,033
State:
$2,265
(% of AGI for various income ranges: 5.5% for AGIs below $25k, 1.5% for AGIs $25k-50k)
Percentage of individuals using paid preparers for their 2012 taxes: 49.5%
Here:
49%
State:
53%
(% for various income ranges: 41.0% for AGIs below $25k, 43.5% for AGIs $25k-50k, 50.0% for AGIs $50k-75k, 70.0% for AGIs $75k-100k, 77.8% for AGIs $100k-200k)
Averages for the 2004 tax year for zip code 47970, filed in 2005:
Average Adjusted Gross Income (AGI) in 2004: $38,226 (Individual Income Tax Returns)
Here:
$38,226
State:
$44,790
Salary/wage: $35,176 (reported on 86.8% of returns)
Here:
$35,176
State:
$39,615
(% of AGI for various income ranges: 96.9% for AGIs below $10k, 80.1% for AGIs $10k-25k, 86.8% for AGIs $25k-50k, 84.4% for AGIs $50k-75k, 83.0% for AGIs $75k-100k, 57.7% for AGIs over 100k)
Taxable interest for individuals: $1,039 (reported on 44.8% of returns)
This zip code:
$1,039
Indiana:
$1,535
(% of AGI for various income ranges: 3.7% for AGIs below $10k, 1.4% for AGIs $10k-25k, 0.8% for AGIs $25k-50k, 1.4% for AGIs $50k-75k, 1.0% for AGIs $75k-100k, 1.4% for AGIs over 100k)
Taxable dividends: $1,635 (reported on 18.4% of returns)
Here:
$1,635
State:
$2,998
(% of AGI for various income ranges: 1.5% for AGIs below $10k, 0.7% for AGIs $10k-25k, 0.4% for AGIs $25k-50k, 0.7% for AGIs $50k-75k, 1.0% for AGIs $75k-100k, 1.1% for AGIs over 100k)
Net capital gain/loss: +$809 (reported on 12.1% of returns)
Here:
+$809
State:
+$8,619
(% of AGI for various income ranges: -2.2% for AGIs below $10k, -0.5% for AGIs $10k-25k, 0.5% for AGIs $25k-50k, 0.5% for AGIs $50k-75k, 0.2% for AGIs $75k-100k, 0.4% for AGIs over 100k)
Profit/loss from business: +$5,408 (reported on 14.3% of returns)
Here:
+$5,408
State:
+$10,071
(% of AGI for various income ranges: 8.8% for AGIs below $10k, 3.0% for AGIs $10k-25k, 2.2% for AGIs $25k-50k, 1.6% for AGIs $50k-75k, 3.1% for AGIs $75k-100k)
Profit/loss from farming: +$6,135 (reported on 5.7% of returns)
Here:
+$6,135
State:
-$2,212
IRA payment deduction: $3,286 (reported on 2.3% of returns)
47970:
$3,286
Indiana:
$2,840
Total itemized deductions: $13,776 (21% of AGI, reported on 22.6% of returns)
Here:
$13,776
State:
$17,065
Here:
20.8% of AGI
State:
19.5% of AGI
(% of AGI for various income ranges: 7.9% for AGIs $10k-25k, 6.9% for AGIs $25k-50k, 7.6% for AGIs $50k-75k, 10.3% for AGIs $75k-100k, 9.5% for AGIs over 100k)
Charity contributions deductions: $2,242 (3% of AGI, reported on 17.7% of returns)
Here:
$2,242
State:
$3,550
Here:
3.1% of AGI
State:
3.8% of AGI
(% of AGI for various income ranges: 0.9% for AGIs $10k-25k, 0.5% for AGIs $25k-50k, 1.0% for AGIs $50k-75k, 1.2% for AGIs $75k-100k, 2.0% for AGIs over 100k)
Total tax: $4,869 (reported on 73.2% of returns)
47970:
$4,869
State:
$6,914
(% of AGI for various income ranges: 3.2% for AGIs below $10k, 3.9% for AGIs $10k-25k, 6.1% for AGIs $25k-50k, 8.2% for AGIs $50k-75k, 10.8% for AGIs $75k-100k, 18.2% for AGIs over 100k)
Earned income credit: $1,660 (reported on 15.5% of returns)
Here:
$1,660
State:
$1,685
Percentage of individuals using paid preparers for their 2004 taxes: 61.3%
Here:
61%
State:
59%
(% for various income ranges: 58.8% for AGIs below $10k, 64.5% for AGIs $10k-25k, 60.5% for AGIs $25k-50k, 61.5% for AGIs $50k-75k, 57.5% for AGIs $75k-100k, 67.5% for AGIs over 100k)
Household received Food Stamps/SNAP in the past 12 months: 85 Household did not receive Food Stamps/SNAP in the past 12 months: 775
Women who had a birth in the past 12 months: 14 (0 now married, 12 unmarried) Women who did not have a birth in the past 12 months: 498 (224 now married, 274 unmarried)
Housing units in zip code 47970 with a mortgage: 438 (55 second mortgage, 48 both second mortgage and home equity loan) Houses without a mortgage: 8
Median monthly owner costs for units with a mortgage: $1,166 Median monthly owner costs for units without a mortgage: $464
Residents with income below the poverty level in 2022:
This zip code:
15.0%
Whole state:
12.6%
Residents with income below 50% of the poverty level in 2022:
This zip code:
6.1%
Whole state:
6.3%
Median number of rooms in houses and condos:
Here:
6.2
State:
6.6
Median number of rooms in apartments:
Here:
5.7
State:
4.3
Notable locations in this zip code not listed on our city pages
297 married couples with children.
183 single-parent households (59 men, 124 women).
96.9% of residents of 47970 zip code speak English at home.
1.7% of residents speak Spanish at home (100% very well).
0.2% of residents speak other Indo-European language at home (100% very well).
0.3% of residents speak Asian or Pacific Island language at home (100% very well).
0.2% of residents speak other language at home (100% very well).
Foreign born population: 48 (2.2%) (58.0% of them are naturalized citizens)
This zip code:
2.2%
Whole state:
6.1%
48%Honduras
27%Belize
10%Malaysia
6%Serbia
6%Sierra Leone
22%English
20%American
17%German
9%Dutch
3%Irish
3%Swedish
3%European
Year of entry for the foreign-born population
02010 or later
162000 to 2009
01990 to 1999
43Before 1990
Facilities with environmental interests located in this zip code:
AMERITECH (127 N MAIN ST in OTTERBEIN, IN)
STATE MASTER (Indiana facility tracking) - CRTK-95, EPCRA (Resource Conservation and Recovery Act (tracking hazardous waste)) Organizations: INDIANA BELL TELEPHONE CO (CONTACT/OWNER)
, INDIANA BELL TELEPHONE CO INC (CONTACT/OWNER)
Alternative names: IND BELL TEL CO OTTERBEIN 583 OFFICE
OTTERBEIN ELEMENTARY SCHOOL (111 W OXFORD ST in OTTERBEIN, IN)
(Geographic Names Information System) STATE MASTER (Indiana facility tracking) - UST-11097, UNDERGROUND STORAGE TANK PROGRAM (National Center for Education Statistics) - STATE ID-0421 Organizations: BENTON COMMUNITY SCHOOL CORP (SCHOOL DISTRICT)
OTTERBEIN WWTP (502 E 2ND ST in OTTERBEIN, IN)
STATE MASTER (Indiana facility tracking) - CRTK-1401, EPCRA National Pollutant Discharge Elimination System NON-MAJOR (Tracking pollutant discharge elimination systems) - permit Business SIC classification: SEWERAGE SYSTEMS Organizations: DAN BROCK CERT OPER 10497 (CONTACT/OPERATOR)
, OTTERBEIN TOWN COUNCIL (CONTACT/OWNER)
Alternative names: OTTERBEIN MUNICIPAL STP, OTTERBIEN MUNICIPAL STP
MUSSER AUTO & TRUCK SUPPLY INC (7695 S 1150 E in OTTERBEIN, IN)
STATE MASTER (Indiana facility tracking) - UST-15102, UNDERGROUND STORAGE TANK PROGRAM (Resource Conservation and Recovery Act (tracking hazardous waste)) Organizations: CASE JI (CONTACT/OWNER)
Alternative names: MINNIEAR FARM EQUIPMENT INC
AMOCO FERTILIZER PLT (RTE 52 N in OTTERBEIN, IN)
STATE MASTER (Indiana facility tracking) (Resource Conservation and Recovery Act (tracking hazardous waste))
ROWE TRUCK EQUIPMENT (102 W FIRST ST in OTTERBEIN, IN)
STATE MASTER (Indiana facility tracking) (Resource Conservation and Recovery Act (tracking hazardous waste))
Housing units lacking complete plumbing facilities: 1.0% Housing units lacking complete kitchen facilities: 0.7%
38.3%Utility gas
31.1%Bottled, tank, or LP gas
22.8%Electricity
5.9%Wood
1.9%No fuel used
Population in 1990: 1,527. Population change in the 1990s: +567 (+37.1%).
Place of birth for U.S.-born residents:
This state: 1,770
Northeast: 6
Midwest: 188
South: 99
West: 73
57% of the 47970 zip code residents lived in the same house 5 years ago. Out of people who lived in different houses, 38% lived in this county. Out of people who lived in different counties, 50% lived in Indiana.
95% of the 47970 zip code residents lived in the same house 1 year ago. Out of people who lived in different houses, 8% moved from this county. Out of people who lived in different houses, 30% moved from different county within same state. Out of people who lived in different houses, 42% moved from different state. Out of people who lived in different houses, 30% moved from abroad.
Private vs. public school enrollment:
Students in private schools in grades 1 to 8 (elementary and middle school): 18
Here:
6.6%
Indiana:
14.9%
Students in private schools in grades 9 to 12 (high school): 22
Here:
12.0%
Indiana:
11.4%
Students in private undergraduate colleges:
Here:
0.0%
Indiana:
22.3%
Occupation by median earnings in the past 12 months ($)
88,599Architecture and engineering occupations
78,032Health diagnosing and treating practitioners and other technical occupations
70,313Management occupations
64,804Installation, maintenance, and repair occupations
59,059Community and social service occupations
53,792Production occupations
Top industries in this zip code by the number of employees in 2005:


+$6,135
-$2,212
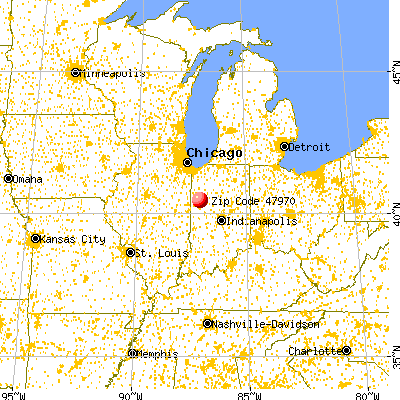
 Nearest zip codes: 47975, 47971, 47906, 47992, 47918, 47907.


