Estimated zip code population in 2022: 15,534 Zip code population in 2010: 14,231 Zip code population in 2000: 13,728
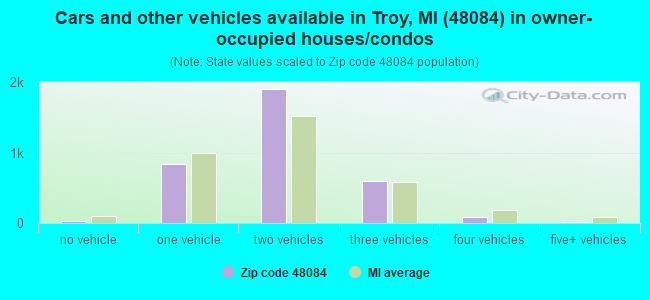
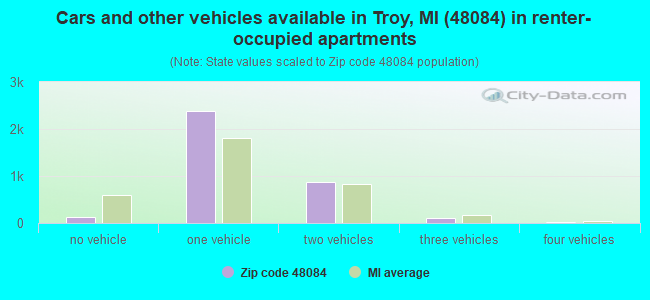
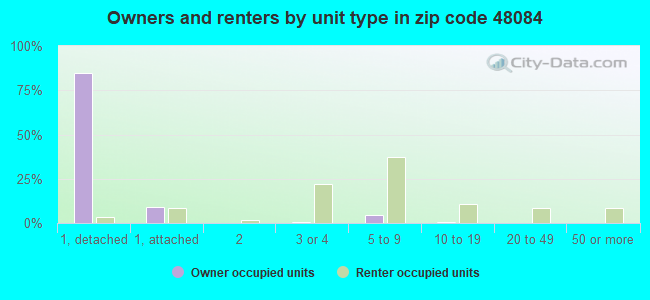
Houses and condos: 7,288 Renter-occupied apartments: 3,464
% of renters here:
50%
State:
27%
March 2022 cost of living index in zip code 48084: 99.0 (near average, U.S. average is 100)
Land area: 6.2 sq. mi. Water area: 0.0 sq. mi.
Population density: 2,513 people per square mile
(average).
OSM Map
General Map
Google Map
MSN Map
OSM Map
General Map
Google Map
MSN Map
OSM Map
General Map
Google Map
MSN Map
OSM Map
General Map
Google Map
MSN Map
Please wait while loading the map...
Real estate property taxes paid for housing units in 2022:
This zip code:
1.1% ($4,731)
Michigan:
1.2% ($2,746)
Median real estate property taxes paid for housing units with mortgages in 2022: $4,703 (1.1%) Median real estate property taxes paid for housing units with no mortgage in 2022: $4,817 (1.1%)
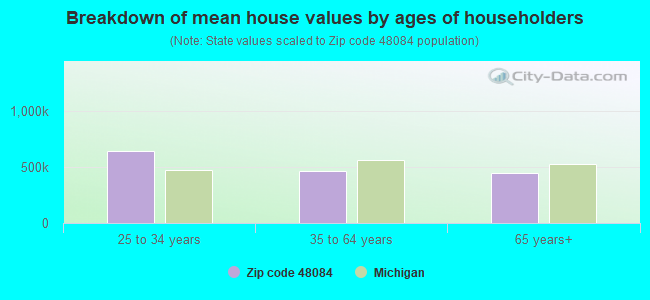
Estimated median house/condo value in 2022: $441,212
48084:
$441,212
Michigan:
$224,400
According to our research of Michigan and other state lists, there were 9 registered sex offenders living in 48084 zip code as of May 13, 2024. The ratio of all residents to sex offenders in zip code 48084 is 1,764 to 1. The ratio of registered sex offenders to all residents in this zip code is much lower than the state average.
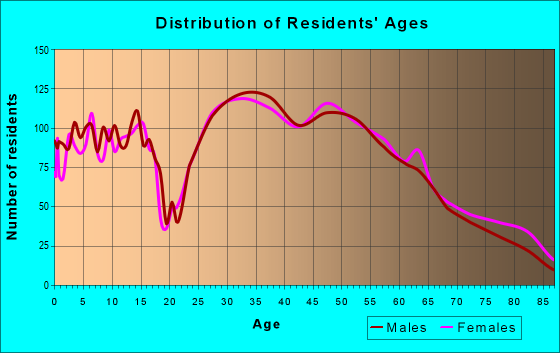
Median resident age:
This zip code:
38.2 years
Michigan median age:
40.3 years
Average household size:
This zip code:
2.2 people
Michigan:
2.4 people
Averages for the 2020 tax year for zip code 48084, filed in 2021:
Average Adjusted Gross Income (AGI) in 2020: $116,620 (Individual Income Tax Returns)
Here:
$116,620
State:
$68,945
Salary/wage: $98,220 (reported on 82.2% of returns)
Here:
$98,220
State:
$57,142
(% of AGI for various income ranges: 1055.1% for AGIs below $25k, 3578.3% for AGIs $25k-50k, 6987.5% for AGIs $50k-75k, 10548.8% for AGIs $75k-100k, 19170.5% for AGIs $100k-200k, 90696.6% for AGIs over 200k)
Taxable interest for individuals: $2,723 (reported on 42.4% of returns)
This zip code:
$2,723
Michigan:
$1,630
(% of AGI for various income ranges: 30.0% for AGIs below $25k, 36.4% for AGIs $25k-50k, 63.4% for AGIs $50k-75k, 76.4% for AGIs $75k-100k, 141.2% for AGIs $100k-200k, 2045.9% for AGIs over 200k)
Ordinary dividends: $7,136 (reported on 36.5% of returns)
Here:
$7,136
State:
$6,972
(% of AGI for various income ranges: 66.0% for AGIs below $25k, 84.0% for AGIs $25k-50k, 143.4% for AGIs $50k-75k, 217.8% for AGIs $75k-100k, 464.2% for AGIs $100k-200k, 3985.9% for AGIs over 200k)
Net capital gain/loss in AGI: +$24,259 (reported on 36.4% of returns)
Here:
+$24,259
State:
+$20,064
(% of AGI for various income ranges: 36.0% for AGIs below $25k, 46.2% for AGIs $25k-50k, 147.0% for AGIs $50k-75k, 210.9% for AGIs $75k-100k, 585.4% for AGIs $100k-200k, 20631.0% for AGIs over 200k)
Profit/loss from business: +$20,906 (reported on 15.1% of returns)
Here:
+$20,906
State:
+$11,172
(% of AGI for various income ranges: 114.3% for AGIs below $25k, 204.9% for AGIs $25k-50k, 239.1% for AGIs $50k-75k, 228.1% for AGIs $75k-100k, 451.3% for AGIs $100k-200k, 4727.6% for AGIs over 200k)
Taxable individual retirement arrangement distribution: $23,880 (reported on 10.1% of returns)
48084:
$23,880
Michigan:
$19,803
(% of AGI for various income ranges: 76.3% for AGIs below $25k, 167.9% for AGIs $25k-50k, 229.6% for AGIs $50k-75k, 320.3% for AGIs $75k-100k, 562.9% for AGIs $100k-200k, 2303.8% for AGIs over 200k)
Self-employed (Keogh) retirement plans: $23,567 (reported on 1.1% of returns)
48084:
$23,567
Michigan:
$25,132
(% of AGI for various income ranges: 51.6% for AGIs $75k-100k, 612.1% for AGIs over 200k)
Total itemized deductions: $39,130 (reported on 9.8% of returns)
Here:
$39,130
State:
$34,117
(% of AGI for various income ranges: 101.7% for AGIs below $25k, 160.3% for AGIs $25k-50k, 240.3% for AGIs $50k-75k, 387.5% for AGIs $75k-100k, 674.0% for AGIs $100k-200k, 5533.8% for AGIs over 200k)
Charity contributions: $9,577 (reported on 8.1% of returns)
Here:
$9,577
State:
$13,548
(% of AGI for various income ranges: 8.0% for AGIs below $25k, 22.5% for AGIs $25k-50k, 24.7% for AGIs $50k-75k, 58.4% for AGIs $75k-100k, 135.4% for AGIs $100k-200k, 1320.0% for AGIs over 200k)
Taxes paid: $8,688 (reported on 9.7% of returns)
48084:
$8,688
State:
$7,972
(% of AGI for various income ranges: 15.5% for AGIs below $25k, 29.0% for AGIs $25k-50k, 58.9% for AGIs $50k-75k, 120.0% for AGIs $75k-100k, 216.8% for AGIs $100k-200k, 904.5% for AGIs over 200k)
Earned income credit: $1,444 (reported on 5.2% of returns)
Here:
$1,444
State:
$2,251
(% of AGI for various income ranges: 33.3% for AGIs below $25k, 29.1% for AGIs $25k-50k)
Percentage of individuals using paid preparers for their 2020 taxes: 92.0%
Here:
92%
State:
93%
(% for various income ranges: 90.0% for AGIs below $25k, 92.6% for AGIs $25k-50k, 92.1% for AGIs $50k-75k, 91.1% for AGIs $75k-100k, 92.9% for AGIs $100k-200k, 93.8% for AGIs over 200k)
Averages for the 2012 tax year for zip code 48084, filed in 2013:
Average Adjusted Gross Income (AGI) in 2012: $119,730 (Individual Income Tax Returns)
Here:
$119,730
State:
$55,609
Salary/wage: $92,549 (reported on 82.1% of returns)
Here:
$92,549
State:
$46,782
(% of AGI for various income ranges: 67.8% for AGIs below $25k, 76.9% for AGIs $25k-50k, 76.1% for AGIs $50k-75k, 77.7% for AGIs $75k-100k, 80.8% for AGIs $100k-200k, 49.8% for AGIs over 200k)
Taxable interest for individuals: $2,473 (reported on 45.3% of returns)
This zip code:
$2,473
Michigan:
$1,491
(% of AGI for various income ranges: 1.9% for AGIs below $25k, 0.7% for AGIs $25k-50k, 0.8% for AGIs $50k-75k, 0.9% for AGIs $75k-100k, 0.9% for AGIs $100k-200k, 1.0% for AGIs over 200k)
Ordinary dividends: $8,603 (reported on 33.7% of returns)
Here:
$8,603
State:
$6,225
(% of AGI for various income ranges: 4.7% for AGIs below $25k, 2.3% for AGIs $25k-50k, 2.1% for AGIs $50k-75k, 2.7% for AGIs $75k-100k, 1.8% for AGIs $100k-200k, 2.6% for AGIs over 200k)
Net capital gain/loss in AGI: +$27,004 (reported on 30.2% of returns)
Here:
+$27,004
State:
+$9,326
(% of AGI for various income ranges: 0.3% for AGIs $50k-75k, 0.5% for AGIs $75k-100k, 0.9% for AGIs $100k-200k, 12.5% for AGIs over 200k)
Profit/loss from business: +$50,519 (reported on 14.8% of returns)
Here:
+$50,519
State:
+$11,523
(% of AGI for various income ranges: 9.1% for AGIs below $25k, 5.1% for AGIs $25k-50k, 1.9% for AGIs $50k-75k, 2.2% for AGIs $75k-100k, 2.7% for AGIs $100k-200k, 9.1% for AGIs over 200k)
Taxable individual retirement arrangement distribution: $19,849 (reported on 12.8% of returns)
48084:
$19,849
Michigan:
$15,298
(% of AGI for various income ranges: 4.4% for AGIs below $25k, 3.3% for AGIs $25k-50k, 3.2% for AGIs $50k-75k, 3.7% for AGIs $75k-100k, 2.9% for AGIs $100k-200k, 1.1% for AGIs over 200k)
Self-employment retirement plans: $17,510 (reported on 1.3% of returns)
48084:
$17,510
Michigan:
$20,834
(% of AGI for various income ranges: 0.3% for AGIs $100k-200k, 0.2% for AGIs over 200k)
Total itemized deductions: $30,361 (13% of AGI, reported on 40.2% of returns)
Here:
$30,361
State:
$21,628
Here:
13.2% of AGI
State:
18.4% of AGI
(% of AGI for various income ranges: 13.4% for AGIs below $25k, 9.8% for AGIs $25k-50k, 10.5% for AGIs $50k-75k, 11.0% for AGIs $75k-100k, 12.4% for AGIs $100k-200k, 8.9% for AGIs over 200k)
Charity contributions: $5,215 (reported on 34.9% of returns)
Here:
$5,215
State:
$4,225
(% of AGI for various income ranges: 0.8% for AGIs below $25k, 1.1% for AGIs $25k-50k, 1.5% for AGIs $50k-75k, 1.5% for AGIs $75k-100k, 1.7% for AGIs $100k-200k, 1.5% for AGIs over 200k)
Taxes paid: $14,671 (reported on 40.2% of returns)
48084:
$14,671
State:
$8,327
(% of AGI for various income ranges: 2.9% for AGIs below $25k, 2.5% for AGIs $25k-50k, 3.2% for AGIs $50k-75k, 4.1% for AGIs $75k-100k, 5.6% for AGIs $100k-200k, 5.4% for AGIs over 200k)
Earned income credit: $1,462 (reported on 6.3% of returns)
Here:
$1,462
State:
$2,306
(% of AGI for various income ranges: 2.3% for AGIs below $25k, 0.4% for AGIs $25k-50k)
Percentage of individuals using paid preparers for their 2012 taxes: 57.7%
Here:
58%
State:
57%
(% for various income ranges: 51.5% for AGIs below $25k, 56.2% for AGIs $25k-50k, 59.6% for AGIs $50k-75k, 59.1% for AGIs $75k-100k, 59.9% for AGIs $100k-200k, 70.3% for AGIs over 200k)
Averages for the 2004 tax year for zip code 48084, filed in 2005:
Average Adjusted Gross Income (AGI) in 2004: $72,526 (Individual Income Tax Returns)
Here:
$72,526
State:
$48,204
Salary/wage: $69,114 (reported on 80.8% of returns)
Here:
$69,114
State:
$42,791
(% of AGI for various income ranges: 130.1% for AGIs below $10k, 62.7% for AGIs $10k-25k, 74.8% for AGIs $25k-50k, 78.6% for AGIs $50k-75k, 79.9% for AGIs $75k-100k, 76.5% for AGIs over 100k)
Taxable interest for individuals: $2,096 (reported on 64.1% of returns)
This zip code:
$2,096
Michigan:
$1,725
(% of AGI for various income ranges: 23.0% for AGIs below $10k, 4.7% for AGIs $10k-25k, 2.5% for AGIs $25k-50k, 2.2% for AGIs $50k-75k, 1.8% for AGIs $75k-100k, 1.3% for AGIs over 100k)
Taxable dividends: $3,910 (reported on 43.6% of returns)
Here:
$3,910
State:
$3,420
(% of AGI for various income ranges: 21.2% for AGIs below $10k, 6.5% for AGIs $10k-25k, 2.6% for AGIs $25k-50k, 2.2% for AGIs $50k-75k, 1.8% for AGIs $75k-100k, 2.1% for AGIs over 100k)
Net capital gain/loss: +$5,374 (reported on 37.4% of returns)
Here:
+$5,374
State:
+$8,532
(% of AGI for various income ranges: -12.2% for AGIs below $10k, -0.3% for AGIs $10k-25k, 0.3% for AGIs $25k-50k, 0.4% for AGIs $50k-75k, 0.3% for AGIs $75k-100k, 4.6% for AGIs over 100k)
Profit/loss from business: +$19,381 (reported on 13.8% of returns)
Here:
+$19,381
State:
+$9,547
(% of AGI for various income ranges: 7.2% for AGIs below $10k, 6.2% for AGIs $10k-25k, 2.9% for AGIs $25k-50k, 2.6% for AGIs $50k-75k, 2.9% for AGIs $75k-100k, 4.1% for AGIs over 100k)
IRA payment deduction: $3,454 (reported on 3.3% of returns)
48084:
$3,454
Michigan:
$2,875
(% of AGI for various income ranges: 1.3% for AGIs below $10k, 0.3% for AGIs $25k-50k, 0.3% for AGIs $50k-75k, 0.2% for AGIs $75k-100k, 0.1% for AGIs over 100k)
Self-employed pension: $16,270 (reported on 1.6% of returns)
Here:
$16,270
Michigan:
$13,826
(% of AGI for various income ranges: 2.1% for AGIs below $10k, 0.3% for AGIs $50k-75k, 0.5% for AGIs over 100k)
Total itemized deductions: $22,194 (19% of AGI, reported on 45.7% of returns)
Here:
$22,194
State:
$18,509
Here:
18.9% of AGI
State:
20.7% of AGI
(% of AGI for various income ranges: 41.2% for AGIs below $10k, 22.8% for AGIs $10k-25k, 12.4% for AGIs $25k-50k, 13.0% for AGIs $50k-75k, 16.2% for AGIs $75k-100k, 13.2% for AGIs over 100k)
Charity contributions deductions: $3,651 (3% of AGI, reported on 40.6% of returns)
Here:
$3,651
State:
$3,365
Here:
2.9% of AGI
State:
3.6% of AGI
(% of AGI for various income ranges: 1.4% for AGIs below $10k, 1.5% for AGIs $10k-25k, 1.3% for AGIs $25k-50k, 1.6% for AGIs $50k-75k, 2.3% for AGIs $75k-100k, 2.3% for AGIs over 100k)
Total tax: $13,304 (reported on 83.1% of returns)
48084:
$13,304
State:
$7,691
(% of AGI for various income ranges: 6.4% for AGIs below $10k, 5.0% for AGIs $10k-25k, 8.8% for AGIs $25k-50k, 10.6% for AGIs $50k-75k, 11.4% for AGIs $75k-100k, 18.9% for AGIs over 100k)
Earned income credit: $1,121 (reported on 3.9% of returns)
Here:
$1,121
State:
$1,737
Percentage of individuals using paid preparers for their 2004 taxes: 55.0%
Here:
55%
State:
60%
(% for various income ranges: 48.8% for AGIs below $10k, 59.7% for AGIs $10k-25k, 54.1% for AGIs $25k-50k, 55.6% for AGIs $50k-75k, 52.4% for AGIs $75k-100k, 58.9% for AGIs over 100k)
Likely homosexual households (counted as self-reported same-sex unmarried-partner households)
Lesbian couples: 0.0% of all households
Gay men: 0.2% of all households
Household received Food Stamps/SNAP in the past 12 months: 113 Household did not receive Food Stamps/SNAP in the past 12 months: 6,800
Women who had a birth in the past 12 months: 286 (284 now married, 9 unmarried) Women who did not have a birth in the past 12 months: 3,497 (1,699 now married, 1,789 unmarried)
Housing units in zip code 48084 with a mortgage: 2,262 (344 second mortgage, 336 both second mortgage and home equity loan) Houses without a mortgage: 62
Median monthly owner costs for units with a mortgage: $2,225 Median monthly owner costs for units without a mortgage: $768
Residents with income below the poverty level in 2022:
This zip code:
6.2%
Whole state:
13.4%
Residents with income below 50% of the poverty level in 2022:
This zip code:
3.1%
Whole state:
6.9%
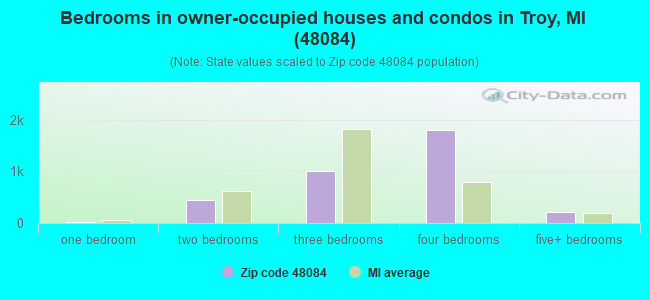
Median number of rooms in houses and condos:
Here:
7.7
State:
6.5
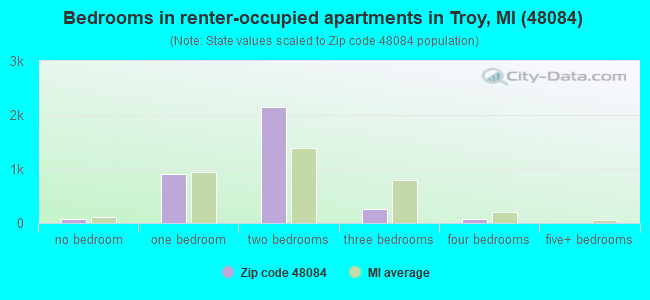
Median number of rooms in apartments:
Here:
3.7
State:
4.3
Notable locations in this zip code not listed on our city pages
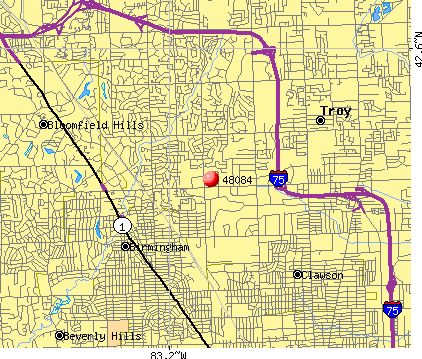
Notable locations in zip code 48084: Somerset Golf Course (A), Troy Civic Center (B), Troy Fire Department Station 3 (C). Display/hide their locations on the map
Shopping Centers: Design Center Shopping Center (1), Cambridge Crossings Shopping Center (2), The Somerset Collection Shopping Center (3). Display/hide their locations on the map
Parks in zip code 48084 include: Boulan Park (1), Kresge Foundation Historical Marker (2), Sebastion Spering Kresge Company Historical Marker (3), Schroeder Park (4), Philipp J Huber Park (5). Display/hide their locations on the map
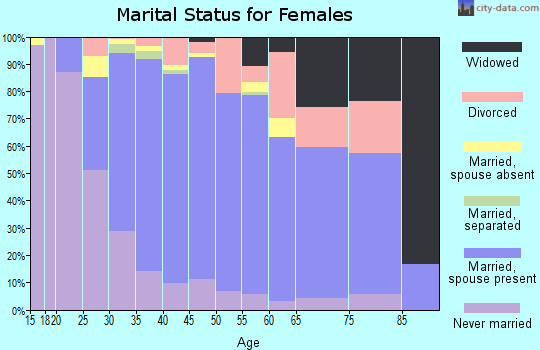
2,731 married couples with children.
384 single-parent households (81 men, 303 women).
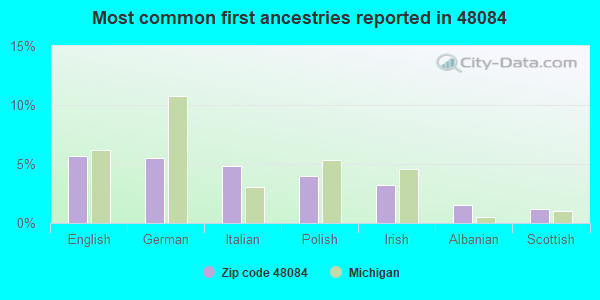
62.5% of residents of 48084 zip code speak English at home.
1.3% of residents speak Spanish at home (43% very well, 50% well, 7% not well).
14.4% of residents speak other Indo-European language at home (81% very well, 15% well, 3% not well).
19.0% of residents speak Asian or Pacific Island language at home (75% very well, 22% well, 3% not well).
3.1% of residents speak other language at home (77% very well, 13% well, 10% not well).
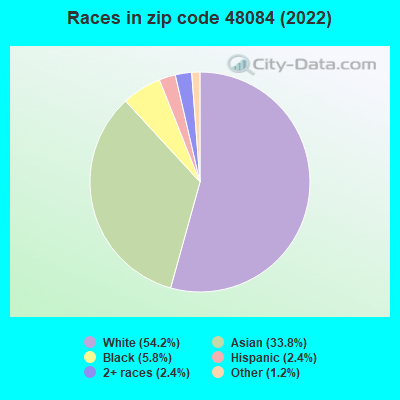
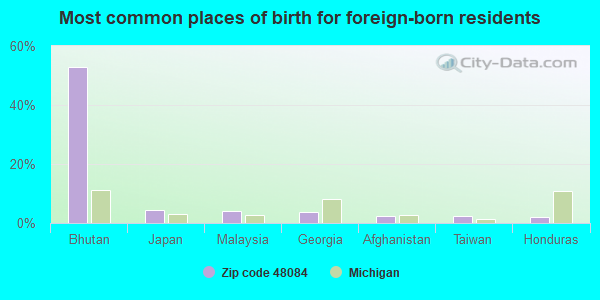
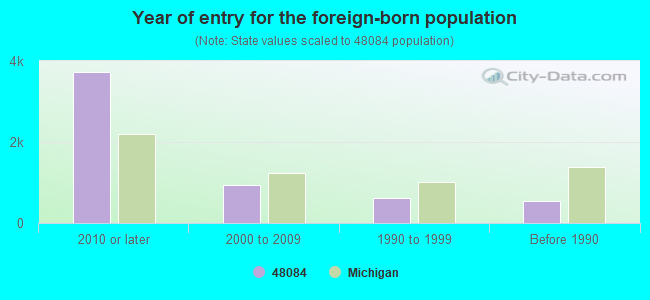
Foreign born population: 5,247 (33.8%) (32.8% of them are naturalized citizens)
Major facilities with environmental interests located in this zip code:
AKZO NOBEL COATINGS (1845 MAXWELL in TROY, MI)
STATE MASTER (New Jersey environmental info) - NJEMS-002843, PESTICIDES - MANUFACTURE HAZARDOUS WASTE BIENNIAL REPORTER (Resource Conservation and Recovery Act (tracking hazardous waste)) Large Quantity Generators, more that 1000 kg of hazardous waste/month (Resource Conservation and Recovery Act (tracking hazardous waste)) - notification Organizations: AKZO NOBEL COATINGS INC, AKZO COATINGS INC (CONTACT/OPERATOR)
BARRETT PAVING MATERIALS INC (2040 BARRETT RD in TROY, MI)
AIR MINOR (AIRS/AFS) CRITERIA AND HAZARDOUS AIR POLLUTANT INVENTORY (Inventory of air pollution sources) (Resource Conservation and Recovery Act (tracking hazardous waste)) Business SIC classification: ASPHALT PAVING MIXTURES AND BLOCKS Business NAICS classification: ASPHALT PAVING MIXTURE AND BLOCK MANUFACTURING.
BOULAN PARK MIDDLE SCHOOL (3570 NORTHFIELD PARKWAY in TROY, MI)
(National Center for Education Statistics) - STATE ID-06367 Organizations: TROY SCHOOL DISTRICT (SCHOOL DISTRICT)
MI DEPT/TRANSPORTATION BRIDGE (I-75 OVER ADAMS ROAD in TROY, MI)
(Resource Conservation and Recovery Act (tracking hazardous waste)) Organizations: MICH DEPT OF TRANSPORTATION (CONTACT/OPERATOR)
Alternative names: MI DEPT/TRANSPORTATION BRIDGE S09-63174, MIDOT BRIDGE I-75 OVER ADAMS RD, MIDOT BRIDGE I-75 S09-63174
BEMIS ELEMENTARY SCHOOL (3571 NORTHFIELD PARKWAY in TROY, MI)
(National Center for Education Statistics) - STATE ID-06940 Organizations: TROY SCHOOL DISTRICT (SCHOOL DISTRICT)
BAKER MIDDLE SCHOOL (1291 TORPEY DRIVE in TROY, MI)
(National Center for Education Statistics) - STATE ID-00174 Organizations: TROY SCHOOL DISTRICT (SCHOOL DISTRICT)
Housing units lacking complete plumbing facilities: 0.4% Housing units lacking complete kitchen facilities: 0.7%
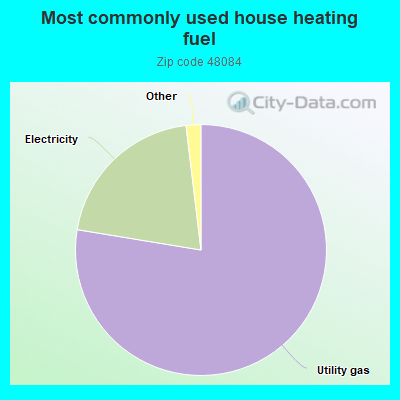
77.6%Utility gas
20.5%Electricity
0.8%No fuel used
0.7%Bottled, tank, or LP gas
Population in 1990: 13,010. Population change in the 1990s: +718 (+5.5%).
Place of birth for U.S.-born residents:
This state: 7,796
Northeast: 492
Midwest: 835
South: 617
West: 260
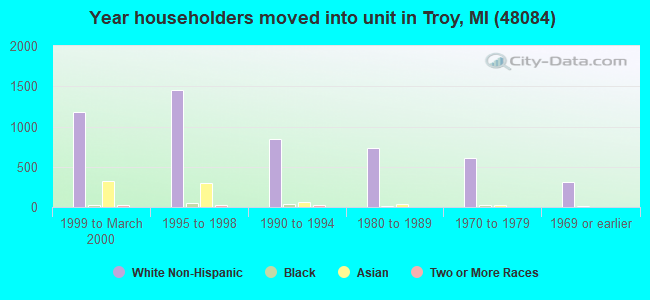
55% of the 48084 zip code residents lived in the same house 5 years ago. Out of people who lived in different houses, 59% lived in this county. Out of people who lived in different counties, 50% lived in Michigan.
86% of the 48084 zip code residents lived in the same house 1 year ago. Out of people who lived in different houses, 40% moved from this county. Out of people who lived in different houses, 22% moved from different county within same state. Out of people who lived in different houses, 15% moved from different state. Out of people who lived in different houses, 26% moved from abroad.
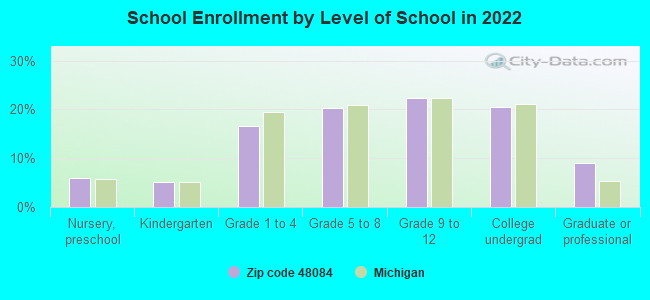
Private vs. public school enrollment:
Students in private schools in grades 1 to 8 (elementary and middle school): 75
Here:
5.6%
Michigan:
12.4%
Students in private schools in grades 9 to 12 (high school): 38
Here:
4.7%
Michigan:
9.8%
Students in private undergraduate colleges: 91
Here:
12.1%
Michigan:
14.9%
Occupation by median earnings in the past 12 months ($)
127,861Legal occupations
114,930Management occupations
102,564Computer and mathematical occupations
94,028Architecture and engineering occupations
90,217Business and financial operations occupations
88,138Health diagnosing and treating practitioners and other technical occupations
Companies with biggest federal contracts located in this zip code (TROY, MI):
AMERICAN SYSTEMS TECHNOLOGY IN (888 W BIG BEAVER RD STE 80; small business) : $10,817,185 in 49 contractsfrom 2000 to 2006
Contracts for Feasibility Studies (non-construction), ADPE System Configuration, Defense Tank - Automotive -- Advanced Development (R&D), Defense Tank - Automotive -- Applied Research and Exploratory Development (R&D), and moreby Army, Air Force Signed by year:2000: $190,054; 2001: $267,376; 2002: $1,313,390; 2003: $3,390,056; 2004: $1,264,263; 2005: $4,130,593; 2006: $261,453.
Biggest contracts:
$883,488 with Army for Feasibility Studies (non-construction). Signed on 2005-01-07. Completion date: 2005-03-16.
$849,334 with Army for ADPE System Configuration. Signed on 2002-09-18. Completion date: 2003-08-29.
$827,262 with Army for Feasibility Studies (non-construction). Signed on 2005-03-10. Completion date: 2005-03-16.
$729,218 with Army for Defense Tank - Automotive -- Advanced Development (R&D). Signed on 2005-07-27. Completion date: 2007-07-27.
WRIGHT TOOL COMPANY (1738 MAPLELAWN DR; small business) : $7,557,667 in 2254 contractsfrom 2000 to 2006
Contracts for Sets, Kits, and Outfits of Hand Tools, Recycling and Reclamation Equipment, Vehicular Brake, Steering, Axle, Wheel, and Track Components, Hand Tools, Nonedged, Nonpowered, and moreby Army, Defense Logistics Agency, Air Force, Federal Supply Service, and others Signed by year:2000: $358,466; 2001: $684,454; 2002: $422,244; 2003: $1,154,108; 2004: $2,334,689; 2005: $1,446,329; 2006: $1,157,377.
Biggest contracts:
$473,641 with Army for Sets, Kits, and Outfits of Hand Tools. Signed on 2006-01-31. Completion date: 2006-12-31.
$383,800, same as above.Signed on 2005-03-15. Completion date: 2005-09-02.
$378,120, same as above.Signed on 2004-09-22. Completion date: 2004-03-30.
$312,225, same as above.Signed on 2004-09-21. Completion date: 2005-02-21.
AJAX PAVING INDUSTRIES, INC (830 KIRTS BLVD) : $7,498,010 in 11 contractsfrom 2002 to 2004
Contracts for Maintenance, Repair or Alteration of Real Property -- Office Buildings by Army Signed by year:2000: $0; 2001: $0; 2002: $7,338,000; 2003: $112,239; 2004: $47,771; 2005: $0; 2006: $0.
Biggest contracts:
$7,338,000 with Army for Maintenance, Repair or Alteration of Real Property -- Office Buildings. Taking place in IN. Signed on 2002-09-27. Completion date: 2003-09-05.
$81,609, same as above.Signed on 2003-08-29. Completion date: 2003-09-05.
$17,380, same as above.Signed on 2004-04-14. Completion date: 2003-09-05.
$13,750, same as above.Signed on 2004-04-23. Completion date: 2003-09-05.
DELPHI DIESEL SYSTEMS LTD (1624 MEIJER DR) : $6,216,358 in 41 contractsfrom 1999 to 2006
Contracts for Engine Fuel System Components, Nonaircraft, Diesel Engines and Components, Hardware, Commercial, Engine Electrical System Components, Nonaircraft, and moreby Army, Defense Logistics Agency, Navy Signed by year:2000: $341,738; 2001: $851,548; 2002: $1,557,096; 2003: $1,298,366; 2004: $1,430,238; 2005: $574,558; 2006: $2,679.
Biggest contracts:
$942,490 with Army for Engine Fuel System Components, Nonaircraft. Signed on 2003-10-03. Completion date: 2006-01-31.
$828,180, same as above.Signed on 2002-03-12. Completion date: 2006-01-31.
$553,265 with Defense Logistics Agency for Engine Fuel System Components, Nonaircraft. Signed on 2004-01-18. Completion date: 2004-06-24.
$476,397 with Army for Engine Fuel System Components, Nonaircraft. Signed on 2002-12-20. Completion date: 2006-01-31.
LMS NORTH AMERICA, INC (1050 WILSHIRE DRIVE; small business) : $3,587,756 in 109 contractsfrom 2000 to 2006
Contracts for ADP Software, Miscellaneous Items, Compressors and Vacuum Pumps, Laboratory Equipment and Supplies, and moreby Army, Navy, NASA, Minerals Management Service, and others Signed by year:2000: $185,759; 2001: $436,363; 2002: $173,969; 2003: $461,827; 2004: $1,226,097; 2005: $728,871; 2006: $374,870.
Biggest contracts:
$273,335 with Army for ADP Software. Signed on 2004-09-09. Completion date: 2005-09-30.
$216,542 with Navy for Miscellaneous Items. Signed on 2004-03-26. Completion date: 2004-06-30.
$165,433 with NASA for Compressors and Vacuum Pumps. Signed on 2006-09-27. Completion date: 2007-03-31.
$146,039 with Army for ADP Software. Signed on 2006-04-06. Completion date: 2008-04-30.
MC GREGOR MANUFACTURING CORP (2785 W MAPLE RD; small business) : $2,237,213 in 9 contractsfrom 2000 to 2004
Contracts for Defense Aircraft -- Basic Research (R&D), Airframe Structural Components, Aircraft Maintenance and Repair Shop Specialized Equipment by Army Signed by year:2000: $506,698; 2001: $47,993; 2002: $374,100; 2003: $618,722; 2004: $689,700; 2005: $0; 2006: $0.
Biggest contracts:
$689,700 with Army for Defense Aircraft -- Basic Research (R&D). Signed on 2004-10-21. Completion date: 2006-12-31.
$380,093 with Army for Airframe Structural Components. Signed on 2000-09-14. Completion date: 2001-12-31.
$374,100 with Army for Defense Aircraft -- Basic Research (R&D). Signed on 2002-12-05. Completion date: 2006-12-31.
$362,699, same as above.Signed on 2003-02-27. Completion date: 2006-12-31.
MERITOR HEAVY VEHICLE SYSTEMS, (2135 WEST MAPLE ROAD) : $2,002,256 in 20 contractsfrom 1999 to 2004
Contracts for Vehicular Power Transmission Components, Liquid and Gas Flow, Liquid Level, and Mechanical Motion Measuring Instruments by Army Signed by year:2000: $1,158,233; 2001: $276,033; 2002: $241,971; 2003: $179,576; 2004: $10,050; 2005: $0; 2006: $0.
Biggest contracts:
$747,441 with Army for Vehicular Power Transmission Components. Signed on 2000-01-31. Completion date: 2000-03-31.
$220,356, same as above.Signed on 2002-02-19. Completion date: 2002-09-20.
$127,821, same as above.Signed on 2000-07-20. Completion date: 2001-01-21.
$98,302, same as above.Signed on 2001-10-19. Completion date: 2002-01-27.
INTERIOR DYNAMICS INC (1742 CROOKS RD; small business) : $1,033,664 in 21 contractsfrom 2001 to 2005
Contracts for Office Furniture, Lease or Rental of Equipment -- Office Supplies and Devices, Installation of Equipment -- Furniture, Maintenance, Repair or Alteration of Real Property -- Office Buildings by U.S. Army Corps of Engineers - civil program financing only, Army, Public Buildings Service Signed by year:2000: $0; 2001: $77,902; 2002: $36,416; 2003: $201,452; 2004: $546,726; 2005: $171,168; 2006: $0.
Biggest contracts:
$205,048 with U.S. Army Corps of Engineers - civil program financing only for Office Furniture. Signed on 2004-09-07. Completion date: 2003-01-30.
$205,048 with Army for Office Furniture. Signed on 2004-09-07. Completion date: 2003-01-30.
$151,111 with U.S. Army Corps of Engineers - civil program financing only for Office Furniture. Signed on 2003-09-22. Completion date: 2003-01-30.
$85,584 with Army for Lease or Rental of Equipment -- Office Supplies and Devices. Signed on 2005-09-06. Completion date: 2006-09-11.
CRAFT-TECH ENTERPRISES INC (1737 THUNDERBIRD DR; small business) : $832,724 in 2 contractsfrom 1999 to 2000
$733,224 with Navy for Miscellaneous Communication Equipment. Signed on 2000-05-08. Completion date: 2001-10-14.
$99,500 with Navy for Miscellaneous Welding, Soldering, and Brazing Supplies and Accessories. Signed on 1999-11-19. Completion date: 2000-06-16.
VISCA LLC (2301 W BIG BEAVER RD , SU; small business) : $628,053 in 5 contractsfrom 2005 to 2006
Contracts for Defense Tank - Automotive -- Basic Research (R&D), Defense Tank - Automotive -- Applied Research and Exploratory Development (R&D) by Army Signed by year:2000: $0; 2001: $0; 2002: $0; 2003: $0; 2004: $0; 2005: $189,854; 2006: $438,199.
Biggest contracts:
$388,263 with Army for Defense Tank - Automotive -- Basic Research (R&D). Signed on 2006-01-20. Completion date: 2008-01-20.
$69,988 with Army for Defense Tank - Automotive -- Applied Research and Exploratory Development (R&D). Signed on 2005-11-28. Completion date: 2006-05-28.
$69,720, same as above.Signed on 2005-01-31. Completion date: 2005-07-21.
$50,146, same as above.Signed on 2005-09-21. Completion date: 2006-01-30.
Top industries in this zip code by the number of employees in 2005:
Administrative and Support and Waste Management and Remediation Services: Professional Employer Organizations (250-499: 1, 100-249: 2, 50-99: 5, 20-49: 7, 10-19: 1, 1-4: 5)
Professional, Scientific, and Technical Services: Offices of Lawyers (100-249: 1, 50-99: 4, 20-49: 10, 10-19: 11, 5-9: 16, 1-4: 52)
Finance and Insurance: Real Estate Credit (500-999: 1, 100-249: 1, 20-49: 4, 10-19: 4, 5-9: 2, 1-4: 11)
Professional, Scientific, and Technical Services: Administrative Management and General Management Consulting Services (250-499: 1, 100-249: 3, 20-49: 3, 10-19: 4, 5-9: 2, 1-4: 10)
People in group quarters in 2010:
53 people in group homes intended for adults
People in group quarters in 2000:
10 people in homes for the mentally retarded
6 people in other group homes
3 people in religious group quarters
Fatal accident statistics in 2014:
Fatal accident count: 1
Vehicles involved in fatal accidents: 1
Fatal accidents caused by drunken drivers: 0
Fatalities: 1
Persons involved in fatal accidents: 1
Pedestrians involved in fatal accidents: 1
Fatal accident statistics in 2013:
Fatal accident count: 1
Vehicles involved in fatal accidents: 2
Fatal accidents caused by drunken drivers: 0
Fatalities: 2
Persons involved in fatal accidents: 3
Pedestrians involved in fatal accidents: 0
Home Mortgage Disclosure Act Aggregated Statistics For Year 2009 (Based on 4 full and 6 partial tracts)
A) FHA, FSA/RHS & VA Home Purchase Loans
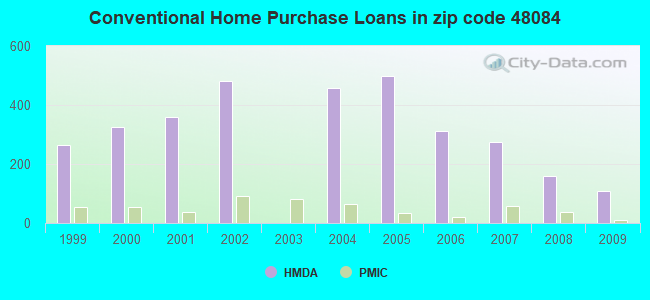
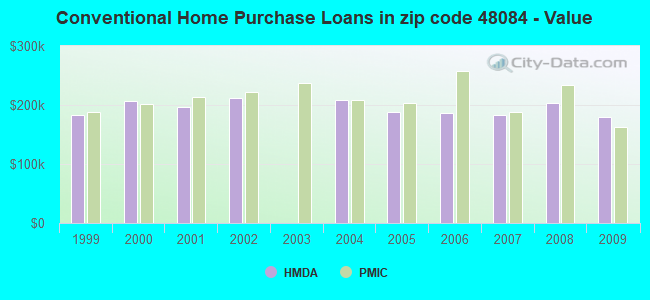
B) Conventional Home Purchase Loans
C) Refinancings
D) Home Improvement Loans
E) Loans on Dwellings For 5+ Families
F) Non-occupant Loans on < 5 Family Dwellings (A B C & D)
Number
Average Value
Number
Average Value
Number
Average Value
Number
Average Value
Number
Average Value
Number
Average Value
LOANS ORIGINATED
55
$185,705
110
$180,069
551
$213,541
7
$59,317
0
$0
14
$125,849
APPLICATIONS APPROVED, NOT ACCEPTED
5
$156,402
12
$121,042
56
$239,329
0
$0
0
$0
6
$130,055
APPLICATIONS DENIED
15
$141,153
15
$145,351
128
$238,245
1
$3,060
0
$0
7
$179,714
APPLICATIONS WITHDRAWN
7
$131,756
17
$172,675
104
$201,789
1
$15,260
2
$700,000
3
$254,287
FILES CLOSED FOR INCOMPLETENESS
1
$254,300
8
$258,274
25
$221,050
0
$0
0
$0
0
$0
Aggregated Statistics For Year 2008 (Based on 4 full and 6 partial tracts)
A) FHA, FSA/RHS & VA Home Purchase Loans
B) Conventional Home Purchase Loans
C) Refinancings
D) Home Improvement Loans
E) Loans on Dwellings For 5+ Families
F) Non-occupant Loans on < 5 Family Dwellings (A B C & D)
G) Loans On Manufactured Home Dwelling (A B C & D)
Number
Average Value
Number
Average Value
Number
Average Value
Number
Average Value
Number
Average Value
Number
Average Value
Number
Average Value
LOANS ORIGINATED
39
$167,737
159
$204,115
315
$229,373
14
$71,506
4
$4,925,000
13
$138,949
2
$94,825
APPLICATIONS APPROVED, NOT ACCEPTED
0
$0
11
$202,344
48
$202,424
2
$19,150
0
$0
2
$178,715
0
$0
APPLICATIONS DENIED
6
$122,767
29
$182,788
122
$215,390
9
$63,294
0
$0
17
$108,380
0
$0
APPLICATIONS WITHDRAWN
5
$135,676
12
$224,117
61
$218,160
1
$101,720
2
$700,000
6
$261,918
1
$107,990
FILES CLOSED FOR INCOMPLETENESS
0
$0
1
$284,820
15
$250,437
3
$84,033
0
$0
0
$0
0
$0
Aggregated Statistics For Year 2007 (Based on 4 full and 6 partial tracts)
A) FHA, FSA/RHS & VA Home Purchase Loans
B) Conventional Home Purchase Loans
C) Refinancings
D) Home Improvement Loans
F) Non-occupant Loans on < 5 Family Dwellings (A B C & D)
G) Loans On Manufactured Home Dwelling (A B C & D)
Number
Average Value
Number
Average Value
Number
Average Value
Number
Average Value
Number
Average Value
Number
Average Value
LOANS ORIGINATED
7
$144,476
274
$182,523
370
$220,063
36
$61,347
28
$180,612
0
$0
APPLICATIONS APPROVED, NOT ACCEPTED
2
$164,125
39
$196,294
60
$221,236
26
$65,395
5
$50,834
0
$0
APPLICATIONS DENIED
2
$138,000
39
$168,847
185
$239,860
28
$54,778
22
$193,188
4
$17,858
APPLICATIONS WITHDRAWN
0
$0
23
$194,815
54
$204,723
4
$12,368
8
$105,785
0
$0
FILES CLOSED FOR INCOMPLETENESS
0
$0
13
$197,365
33
$220,198
1
$50,860
2
$200,595
0
$0
Aggregated Statistics For Year 2006 (Based on 4 full and 6 partial tracts)
A) FHA, FSA/RHS & VA Home Purchase Loans
B) Conventional Home Purchase Loans
C) Refinancings
D) Home Improvement Loans
F) Non-occupant Loans on < 5 Family Dwellings (A B C & D)
G) Loans On Manufactured Home Dwelling (A B C & D)
Number
Average Value
Number
Average Value
Number
Average Value
Number
Average Value
Number
Average Value
Number
Average Value
LOANS ORIGINATED
5
$211,762
312
$185,723
513
$192,378
57
$94,050
42
$155,701
1
$35,600
APPLICATIONS APPROVED, NOT ACCEPTED
0
$0
30
$147,400
61
$166,794
10
$21,641
2
$202,230
0
$0
APPLICATIONS DENIED
0
$0
55
$185,476
166
$197,036
26
$81,183
1
$5,090
3
$44,040
APPLICATIONS WITHDRAWN
0
$0
28
$193,800
96
$195,080
7
$99,620
8
$101,189
0
$0
FILES CLOSED FOR INCOMPLETENESS
0
$0
5
$242,836
33
$235,639
3
$62,103
0
$0
0
$0
Aggregated Statistics For Year 2005 (Based on 4 full and 6 partial tracts)
A) FHA, FSA/RHS & VA Home Purchase Loans
B) Conventional Home Purchase Loans
C) Refinancings
D) Home Improvement Loans
F) Non-occupant Loans on < 5 Family Dwellings (A B C & D)
G) Loans On Manufactured Home Dwelling (A B C & D)
Number
Average Value
Number
Average Value
Number
Average Value
Number
Average Value
Number
Average Value
Number
Average Value
LOANS ORIGINATED
0
$0
498
$188,379
581
$220,185
46
$118,901
70
$174,670
0
$0
APPLICATIONS APPROVED, NOT ACCEPTED
2
$148,625
52
$191,730
92
$187,188
9
$24,357
23
$142,167
1
$9,150
APPLICATIONS DENIED
0
$0
92
$165,353
153
$185,311
10
$118,051
14
$167,799
0
$0
APPLICATIONS WITHDRAWN
0
$0
56
$185,433
175
$164,307
8
$29,436
8
$107,020
0
$0
FILES CLOSED FOR INCOMPLETENESS
0
$0
10
$141,822
93
$245,974
0
$0
2
$169,525
0
$0
Aggregated Statistics For Year 2004 (Based on 4 full and 6 partial tracts)
A) FHA, FSA/RHS & VA Home Purchase Loans
B) Conventional Home Purchase Loans
C) Refinancings
D) Home Improvement Loans
F) Non-occupant Loans on < 5 Family Dwellings (A B C & D)
Number
Average Value
Number
Average Value
Number
Average Value
Number
Average Value
Number
Average Value
LOANS ORIGINATED
10
$155,147
456
$208,851
839
$217,011
59
$113,741
46
$184,001
APPLICATIONS APPROVED, NOT ACCEPTED
2
$163,210
59
$207,664
128
$202,278
5
$27,082
13
$147,061
APPLICATIONS DENIED
4
$144,065
72
$172,163
127
$198,620
18
$86,839
12
$142,982
APPLICATIONS WITHDRAWN
0
$0
44
$192,873
79
$254,451
4
$115,085
4
$187,550
FILES CLOSED FOR INCOMPLETENESS
1
$130,200
18
$209,732
72
$217,529
2
$140,415
4
$167,315
Aggregated Statistics For Year 2002 (Based on 4 full and 6 partial tracts)
A) FHA, FSA/RHS & VA Home Purchase Loans
B) Conventional Home Purchase Loans
C) Refinancings
D) Home Improvement Loans
E) Loans on Dwellings For 5+ Families
F) Non-occupant Loans on < 5 Family Dwellings (A B C & D)
Number
Average Value
Number
Average Value
Number
Average Value
Number
Average Value
Number
Average Value
Number
Average Value
LOANS ORIGINATED
4
$128,060
482
$211,784
2,224
$203,767
79
$55,624
2
$3,556,020
62
$159,676
APPLICATIONS APPROVED, NOT ACCEPTED
2
$73,855
58
$205,956
205
$204,836
11
$42,742
0
$0
9
$178,726
APPLICATIONS DENIED
11
$108,090
51
$159,824
141
$190,657
17
$19,021
0
$0
5
$200,104
APPLICATIONS WITHDRAWN
0
$0
26
$231,516
149
$181,220
1
$66,220
0
$0
1
$127,350
FILES CLOSED FOR INCOMPLETENESS
0
$0
16
$204,987
74
$206,222
0
$0
0
$0
2
$217,000
Aggregated Statistics For Year 2001 (Based on 4 full and 6 partial tracts)
A) FHA, FSA/RHS & VA Home Purchase Loans
B) Conventional Home Purchase Loans
C) Refinancings
D) Home Improvement Loans
F) Non-occupant Loans on < 5 Family Dwellings (A B C & D)
Number
Average Value
Number
Average Value
Number
Average Value
Number
Average Value
Number
Average Value
LOANS ORIGINATED
7
$156,709
361
$195,979
1,575
$198,510
103
$43,603
39
$143,053
APPLICATIONS APPROVED, NOT ACCEPTED
0
$0
33
$185,614
138
$200,457
16
$46,238
2
$82,975
APPLICATIONS DENIED
2
$146,000
18
$176,744
142
$164,843
22
$50,989
5
$144,104
APPLICATIONS WITHDRAWN
0
$0
15
$221,220
107
$170,926
10
$20,598
5
$173,426
FILES CLOSED FOR INCOMPLETENESS
0
$0
1
$180,040
45
$176,108
0
$0
4
$187,710
Aggregated Statistics For Year 2000 (Based on 4 full and 6 partial tracts)
A) FHA, FSA/RHS & VA Home Purchase Loans
B) Conventional Home Purchase Loans
C) Refinancings
D) Home Improvement Loans
F) Non-occupant Loans on < 5 Family Dwellings (A B C & D)
Number
Average Value
Number
Average Value
Number
Average Value
Number
Average Value
Number
Average Value
LOANS ORIGINATED
9
$168,730
324
$206,400
306
$180,572
108
$38,729
23
$145,504
APPLICATIONS APPROVED, NOT ACCEPTED
2
$129,475
47
$152,172
56
$117,260
21
$27,188
8
$129,816
APPLICATIONS DENIED
0
$0
32
$226,444
84
$184,388
27
$38,610
3
$71,990
APPLICATIONS WITHDRAWN
2
$122,000
11
$216,617
46
$177,635
15
$111,928
4
$111,695
FILES CLOSED FOR INCOMPLETENESS
0
$0
4
$180,418
15
$173,572
1
$152,580
0
$0
Aggregated Statistics For Year 1999 (Based on 2 full and 3 partial tracts)
A) FHA, FSA/RHS & VA Home Purchase Loans
B) Conventional Home Purchase Loans
C) Refinancings
D) Home Improvement Loans
F) Non-occupant Loans on < 5 Family Dwellings (A B C & D)
2002 - 2018 National Fire Incident Reporting System (NFIRS) incidents
According to the data from the years 2002 - 2018 the average number of fire incidents per year is 33. The highest number of reported fires - 62 took place in 2006, and the least - 0 in 2014. The data has a rising trend.
When looking into fire subcategories, the most incidents belonged to: Structure Fires (46.9%), and Outside Fires (26.3%).
Fire incident types reported to NFIRS in Zip Code 48084


 Nearest zip codes: 48017, 48098, 48073, 48009, 48083, 48072.
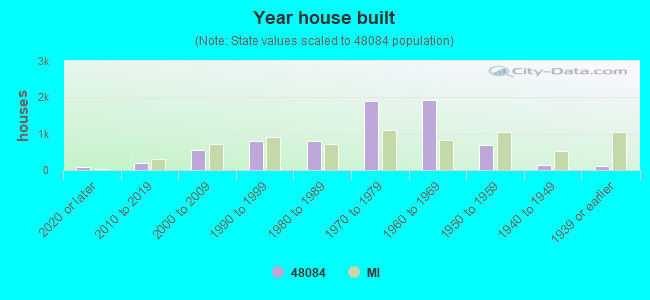


 According to the data from the years 2002 - 2018 the average number of fire incidents per year is 33. The highest number of reported fires - 62 took place in 2006, and the least - 0 in 2014. The data has a rising trend.
 When looking into fire subcategories, the most incidents belonged to: Structure Fires (46.9%), and Outside Fires (26.3%).