Estimated zip code population in 2022: 975 Zip code population in 2010: 1,376 Zip code population in 2000: 1,361
Houses and condos: 486 Renter-occupied apartments: 48
% of renters here:
12%
State:
27%
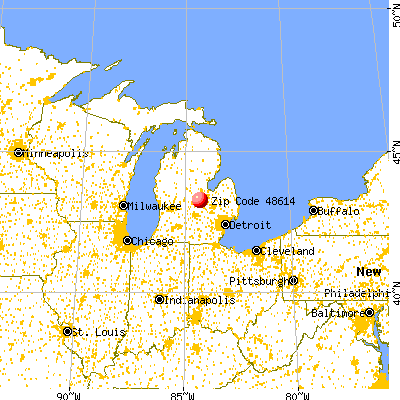
March 2022 cost of living index in zip code 48614: 81.1 (low, U.S. average is 100)
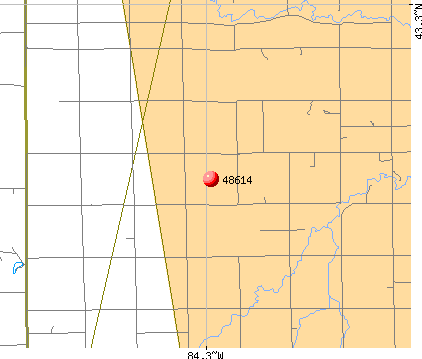
Land area: 35.5 sq. mi. Water area: 0.2 sq. mi.
Population density: 27 people per square mile
(very low).
OSM Map
General Map
Google Map
MSN Map
OSM Map
General Map
Google Map
MSN Map
OSM Map
General Map
Google Map
MSN Map
OSM Map
General Map
Google Map
MSN Map
Please wait while loading the map...
Real estate property taxes paid for housing units in 2022:
This zip code:
1.5% ($2,033)
Michigan:
1.2% ($2,746)
Median real estate property taxes paid for housing units with mortgages in 2022: $2,115 (1.4%) Median real estate property taxes paid for housing units with no mortgage in 2022: $1,958 (1.5%)
Business Search- 14 Million verified businesses
Males: 498
(51.1%)
Females: 477
(48.9%)
For population 25 years and over in 48614:
High school or higher: 87.8%
Bachelor's degree or higher: 11.6%
Graduate or professional degree: 2.4%
Unemployed: 8.9%
Mean travel time to work (commute): 38.6 minutes
For population 15 years and over in 48614:
Never married: 23.9%
Now married: 55.8%
Separated: 0.6%
Widowed: 9.1%
Divorced: 10.6%
Zip code 48614 compared to state average:
Median house value below state average.
Unemployed percentage above state average.
Black race population percentage significantly below state average.
Hispanic race population percentage significantly below state average.
Median age significantly above state average.
Foreign-born population percentage significantly below state average.
Renting percentage significantly below state average.
Length of stay since moving in significantly above state average.
Percentage of population with a bachelor's degree or higher significantly below state average.
Estimated median house/condo value in 2022: $138,813
48614:
$138,813
Michigan:
$224,400
According to our research of Michigan and other state lists, there were 5 registered sex offenders living in 48614 zip code as of May 28, 2024. The ratio of all residents to sex offenders in zip code 48614 is 306 to 1. The ratio of registered sex offenders to all residents in this zip code is near the state average.
Median resident age:
This zip code:
51.4 years
Michigan median age:
40.3 years
Average household size:
This zip code:
2.3 people
Michigan:
2.4 people
Averages for the 2020 tax year for zip code 48614, filed in 2021:
Average Adjusted Gross Income (AGI) in 2020: $44,609 (Individual Income Tax Returns)
Here:
$44,609
State:
$68,945
Salary/wage: $41,047 (reported on 78.9% of returns)
Here:
$41,047
State:
$57,142
(% of AGI for various income ranges: 984.4% for AGIs below $25k, 3152.1% for AGIs $25k-50k, 5751.7% for AGIs $50k-75k, 7690.0% for AGIs $75k-100k, 19853.3% for AGIs $100k-200k)
Taxable interest for individuals: $550 (reported on 24.6% of returns)
This zip code:
$550
Michigan:
$1,630
(% of AGI for various income ranges: 12.5% for AGIs below $25k, 8.6% for AGIs $25k-50k, 23.3% for AGIs $50k-75k, 103.3% for AGIs $100k-200k)
Ordinary dividends: $960 (reported on 8.8% of returns)
Here:
$960
State:
$6,972
(% of AGI for various income ranges: 10.0% for AGIs below $25k, 53.3% for AGIs $50k-75k)
Net capital gain/loss in AGI: +$1,925 (reported on 7.0% of returns)
Here:
+$1,925
State:
+$20,064
(% of AGI for various income ranges: 15.0% for AGIs below $25k, 88.3% for AGIs $50k-75k)
Profit/loss from business: +$3,767 (reported on 10.5% of returns)
Here:
+$3,767
State:
+$11,172
(% of AGI for various income ranges: 81.9% for AGIs below $25k, 158.3% for AGIs $50k-75k)
Taxable individual retirement arrangement distribution: $8,175 (reported on 7.0% of returns)
48614:
$8,175
Michigan:
$19,803
(% of AGI for various income ranges: 233.6% for AGIs $25k-50k)
Earned income credit: $2,060 (reported on 17.5% of returns)
Here:
$2,060
State:
$2,251
(% of AGI for various income ranges: 75.0% for AGIs below $25k, 61.4% for AGIs $25k-50k)
Percentage of individuals using paid preparers for their 2020 taxes: 94.7%
Here:
95%
State:
93%
(% for various income ranges: 95.5% for AGIs below $25k, 94.1% for AGIs $25k-50k, 100.0% for AGIs $50k-75k, 100.0% for AGIs $75k-100k, 83.3% for AGIs $100k-200k)
Averages for the 2012 tax year for zip code 48614, filed in 2013:
Average Adjusted Gross Income (AGI) in 2012: $38,614 (Individual Income Tax Returns)
Here:
$38,614
State:
$55,609
Salary/wage: $32,935 (reported on 82.8% of returns)
Here:
$32,935
State:
$46,782
(% of AGI for various income ranges: 58.4% for AGIs below $25k, 63.9% for AGIs $25k-50k, 77.0% for AGIs $50k-75k, 72.1% for AGIs $75k-100k, 78.2% for AGIs $100k-200k)
Taxable interest for individuals: $682 (reported on 29.3% of returns)
This zip code:
$682
Michigan:
$1,491
(% of AGI for various income ranges: 1.1% for AGIs below $25k, 1.1% for AGIs $25k-50k, 0.1% for AGIs $50k-75k, 0.4% for AGIs $75k-100k)
Ordinary dividends: $1,040 (reported on 8.6% of returns)
Here:
$1,040
State:
$6,225
Net capital gain/loss in AGI: +$1,467 (reported on 10.3% of returns)
Here:
+$1,467
State:
+$9,326
Profit/loss from business: +$4,717 (reported on 10.3% of returns)
Here:
+$4,717
State:
+$11,523
(% of AGI for various income ranges: 1.6% for AGIs below $25k, 2.4% for AGIs $25k-50k, 1.8% for AGIs $50k-75k)
Taxable individual retirement arrangement distribution: $6,750 (reported on 6.9% of returns)
48614:
$6,750
Michigan:
$15,298
Total itemized deductions: $17,718 (25% of AGI, reported on 19.0% of returns)
Here:
$17,718
State:
$21,628
Here:
25.4% of AGI
State:
18.4% of AGI
(% of AGI for various income ranges: 10.3% for AGIs $25k-50k, 6.9% for AGIs $50k-75k, 13.1% for AGIs $75k-100k, 11.6% for AGIs $100k-200k)
Charity contributions: $2,286 (reported on 12.1% of returns)
Here:
$2,286
State:
$4,225
Taxes paid: $4,827 (reported on 19.0% of returns)
48614:
$4,827
State:
$8,327
(% of AGI for various income ranges: 1.8% for AGIs $25k-50k, 1.9% for AGIs $50k-75k, 3.7% for AGIs $75k-100k, 4.4% for AGIs $100k-200k)
Earned income credit: $2,092 (reported on 20.7% of returns)
Here:
$2,092
State:
$2,306
(% of AGI for various income ranges: 5.8% for AGIs below $25k, 1.2% for AGIs $25k-50k)
Percentage of individuals using paid preparers for their 2012 taxes: 70.7%
Here:
71%
State:
57%
(% for various income ranges: 68.0% for AGIs below $25k, 73.3% for AGIs $25k-50k, 70.0% for AGIs $50k-75k, 80.0% for AGIs $75k-100k, 66.7% for AGIs $100k-200k)
Averages for the 2004 tax year for zip code 48614, filed in 2005:
Average Adjusted Gross Income (AGI) in 2004: $37,021 (Individual Income Tax Returns)
Here:
$37,021
State:
$48,204
Salary/wage: $33,035 (reported on 87.0% of returns)
Here:
$33,035
State:
$42,791
(% of AGI for various income ranges: 92.3% for AGIs below $10k, 70.4% for AGIs $10k-25k, 77.5% for AGIs $25k-50k, 84.2% for AGIs $50k-75k, 80.6% for AGIs $75k-100k, 70.9% for AGIs over 100k)
Taxable interest for individuals: $757 (reported on 43.7% of returns)
This zip code:
$757
Michigan:
$1,725
(% of AGI for various income ranges: 5.5% for AGIs below $10k, 3.0% for AGIs $10k-25k, 0.6% for AGIs $25k-50k, 0.8% for AGIs $50k-75k, 0.3% for AGIs $75k-100k, 0.1% for AGIs over 100k)
Taxable dividends: $766 (reported on 15.1% of returns)
Here:
$766
State:
$3,420
(% of AGI for various income ranges: 1.3% for AGIs below $10k, 0.3% for AGIs $10k-25k, 0.1% for AGIs $25k-50k, 0.2% for AGIs $50k-75k, 1.0% for AGIs $75k-100k, 0.0% for AGIs over 100k)
Net capital gain/loss: +$2,757 (reported on 11.9% of returns)
Here:
+$2,757
State:
+$8,532
(% of AGI for various income ranges: 0.5% for AGIs $10k-25k, -0.2% for AGIs $25k-50k, 2.3% for AGIs $50k-75k, 2.0% for AGIs $75k-100k)
Profit/loss from business: +$4,000 (reported on 11.6% of returns)
Here:
+$4,000
State:
+$9,547
(% of AGI for various income ranges: -0.4% for AGIs below $10k, 5.1% for AGIs $10k-25k, 0.2% for AGIs $25k-50k, 3.3% for AGIs $75k-100k)
Total itemized deductions: $14,845 (20% of AGI, reported on 23.8% of returns)
Here:
$14,845
State:
$18,509
Here:
20.3% of AGI
State:
20.7% of AGI
(% of AGI for various income ranges: 6.4% for AGIs $10k-25k, 8.1% for AGIs $25k-50k, 10.3% for AGIs $50k-75k, 10.0% for AGIs $75k-100k, 13.0% for AGIs over 100k)
Charity contributions deductions: $1,893 (2% of AGI, reported on 19.6% of returns)
Here:
$1,893
State:
$3,365
Here:
2.4% of AGI
State:
3.6% of AGI
(% of AGI for various income ranges: 1.3% for AGIs $25k-50k, 1.0% for AGIs $50k-75k, 1.6% for AGIs $75k-100k, 0.8% for AGIs over 100k)
Total tax: $4,550 (reported on 72.1% of returns)
48614:
$4,550
State:
$7,691
(% of AGI for various income ranges: 1.1% for AGIs below $10k, 3.4% for AGIs $10k-25k, 5.4% for AGIs $25k-50k, 8.2% for AGIs $50k-75k, 10.2% for AGIs $75k-100k, 17.1% for AGIs over 100k)
Earned income credit: $1,629 (reported on 16.9% of returns)
Here:
$1,629
State:
$1,737
Percentage of individuals using paid preparers for their 2004 taxes: 71.1%
Here:
71%
State:
60%
(% for various income ranges: 60.7% for AGIs below $10k, 72.3% for AGIs $10k-25k, 70.2% for AGIs $25k-50k, 78.6% for AGIs $50k-75k, 76.6% for AGIs $75k-100k, 81.2% for AGIs over 100k)
Likely homosexual households (counted as self-reported same-sex unmarried-partner households)
Lesbian couples: 0.4% of all households
Gay men: 0.0% of all households
Household received Food Stamps/SNAP in the past 12 months: 77 Household did not receive Food Stamps/SNAP in the past 12 months: 344
Women who had a birth in the past 12 months: 5 (5 now married, 0 unmarried) Women who did not have a birth in the past 12 months: 160 (65 now married, 95 unmarried)
Housing units in zip code 48614 with a mortgage: 216 (6 second mortgage, 4 both second mortgage and home equity loan) Houses without a mortgage: 8
Median monthly owner costs for units with a mortgage: $1,071 Median monthly owner costs for units without a mortgage: $523
Residents with income below the poverty level in 2022:
This zip code:
14.0%
Whole state:
13.4%
Residents with income below 50% of the poverty level in 2022:
This zip code:
10.2%
Whole state:
6.9%
Median number of rooms in houses and condos:
Here:
6.3
State:
6.5
Median number of rooms in apartments:
Here:
6.0
State:
4.3
Notable locations in this zip code not listed on our city pages
Notable locations in zip code 48614: Marion Township Fire Department (A), Tri - Township Fire Department Station 2 (B), Brant Township Hall (C). Display/hide their locations on the map
Cemeteries: Marion Township Cemetery (1), Saint Johns Cemetery (2), Saint Theresa Cemetery (3), Brant Cemeteries (4). Display/hide their locations on the map
Size of family households: 139 2-persons, 84 3-persons, 41 4-persons, 25 5-persons, 2 6-persons
Size of nonfamily households: 107 1-person, 13 2-persons, 5 3-persons
98 married couples with children.
52 single-parent households (16 men, 36 women).
98.8% of residents of 48614 zip code speak English at home.
0.7% of residents speak other Indo-European language at home (100% very well).
0.1% of residents speak Asian or Pacific Island language at home (100% not well).
Foreign born population: 10 (1.0%) (100.0% of them are naturalized citizens)
This zip code:
1.0%
Whole state:
6.9%
50%Ukraine
10%France
10%Singapore
33%German
25%American
18%English
3%European
3%Finnish
2%Czech
2%Hungarian
Year of entry for the foreign-born population
02010 or later
02000 to 2009
11990 to 1999
7Before 1990
Facilities with environmental interests located in this zip code:
MI DEPT/ENVIRONMENTAL QUALITY (13350 S MERIDIAN RD in BRANT, MI)
Small Quantity Generators, between 100 kg and 1000 kg of hazardous waste/month (Resource Conservation and Recovery Act (tracking hazardous waste)) Organizations: MI DEPT NATURAL RESOURCES (CONTACT/OPERATOR)
Housing units lacking complete plumbing facilities: 4.8% Housing units lacking complete kitchen facilities: 5.1%
62.2%Bottled, tank, or LP gas
20.5%Wood
5.6%Electricity
5.6%Fuel oil, kerosene, etc.
3.9%Other fuel
2.0%Utility gas
0.7%No fuel used
Population in 1990: 1,572.
Place of birth for U.S.-born residents:
This state: 893
Northeast: 6
Midwest: 24
South: 24
West: 14
71% of the 48614 zip code residents lived in the same house 5 years ago. Out of people who lived in different houses, 61% lived in this county. Out of people who lived in different counties, 50% lived in Michigan.
95% of the 48614 zip code residents lived in the same house 1 year ago. Out of people who lived in different houses, 46% moved from this county. Out of people who lived in different houses, 46% moved from different county within same state. Out of people who lived in different houses, 8% moved from different state.
Private vs. public school enrollment:
Students in private schools in grades 1 to 8 (elementary and middle school): 6
Here:
8.2%
Michigan:
12.4%
Students in private schools in grades 9 to 12 (high school):
Here:
0.0%
Michigan:
9.8%
Students in private undergraduate colleges:
Here:
0.0%
Michigan:
14.9%
Occupation by median earnings in the past 12 months ($)
84,992Business and financial operations occupations
68,042Management occupations
65,388Computer and mathematical occupations
57,153Construction and extraction occupations
47,828Transportation occupations
45,077Production occupations
Top industries in this zip code by the number of employees in 2005:
Wholesale Trade: Sporting and Recreational Goods and Supplies Merchant Wholesalers (10-19 employees: 1 establishment)
Construction: Electrical Contractors (5-9: 1)
Health Care and Social Assistance: Homes for the Elderly (5-9: 1)
Construction: Plumbing, Heating, and Air-Conditioning Contractors (5-9: 1)
Wholesale Trade: Medical, Dental, and Hospital Equipment and Supplies Merchant Wholesalers (5-9: 1)
Other Services (except Public Administration): Religious Organizations (1-4: 2)
Administrative and Support and Waste Management and Remediation Services: Landscaping Services (1-4: 1)
Construction: Site Preparation Contractors (1-4: 1)
People in group quarters in 2000:
4 people in other noninstitutional group quarters
Fatal accident statistics in 2010:
Fatal accident count: 1
Vehicles involved in fatal accidents: 1
Fatal accidents caused by drunken drivers: 1
Fatalities: 1
Persons involved in fatal accidents: 2
Pedestrians involved in fatal accidents: 0
Home Mortgage Disclosure Act Aggregated Statistics For Year 2009 (Based on 4 partial tracts)
A) FHA, FSA/RHS & VA Home Purchase Loans
B) Conventional Home Purchase Loans
C) Refinancings
D) Home Improvement Loans
F) Non-occupant Loans on < 5 Family Dwellings (A B C & D)
G) Loans On Manufactured Home Dwelling (A B C & D)
Number
Average Value
Number
Average Value
Number
Average Value
Number
Average Value
Number
Average Value
Number
Average Value
LOANS ORIGINATED
11
$98,825
6
$98,765
56
$113,516
6
$39,982
3
$59,490
5
$82,284
APPLICATIONS APPROVED, NOT ACCEPTED
0
$0
0
$0
4
$99,520
1
$3,050
0
$0
1
$59,340
APPLICATIONS DENIED
2
$65,550
3
$49,127
20
$107,946
6
$18,670
1
$54,050
7
$44,709
APPLICATIONS WITHDRAWN
1
$101,050
2
$71,035
11
$132,079
0
$0
0
$0
0
$0
FILES CLOSED FOR INCOMPLETENESS
0
$0
0
$0
2
$171,625
0
$0
0
$0
1
$68,100
Aggregated Statistics For Year 2008 (Based on 4 partial tracts)
A) FHA, FSA/RHS & VA Home Purchase Loans
B) Conventional Home Purchase Loans
C) Refinancings
D) Home Improvement Loans
F) Non-occupant Loans on < 5 Family Dwellings (A B C & D)
G) Loans On Manufactured Home Dwelling (A B C & D)
Number
Average Value
Number
Average Value
Number
Average Value
Number
Average Value
Number
Average Value
Number
Average Value
LOANS ORIGINATED
11
$93,827
7
$108,310
45
$110,032
11
$16,650
3
$52,253
8
$87,848
APPLICATIONS APPROVED, NOT ACCEPTED
1
$108,990
1
$89,500
6
$76,705
2
$35,605
0
$0
1
$46,210
APPLICATIONS DENIED
4
$64,040
4
$68,212
32
$112,108
11
$38,795
1
$127,440
13
$69,160
APPLICATIONS WITHDRAWN
2
$129,365
1
$156,130
12
$110,736
0
$0
0
$0
3
$119,190
FILES CLOSED FOR INCOMPLETENESS
1
$60,210
0
$0
2
$150,535
0
$0
0
$0
1
$114,330
Aggregated Statistics For Year 2007 (Based on 4 partial tracts)
A) FHA, FSA/RHS & VA Home Purchase Loans
B) Conventional Home Purchase Loans
C) Refinancings
D) Home Improvement Loans
F) Non-occupant Loans on < 5 Family Dwellings (A B C & D)
G) Loans On Manufactured Home Dwelling (A B C & D)
Number
Average Value
Number
Average Value
Number
Average Value
Number
Average Value
Number
Average Value
Number
Average Value
LOANS ORIGINATED
7
$115,646
19
$79,569
56
$94,132
16
$33,774
5
$73,804
11
$70,276
APPLICATIONS APPROVED, NOT ACCEPTED
0
$0
3
$85,077
11
$106,485
1
$70,430
0
$0
0
$0
APPLICATIONS DENIED
0
$0
10
$70,861
44
$103,716
14
$47,930
1
$26,540
10
$62,554
APPLICATIONS WITHDRAWN
0
$0
2
$63,900
18
$123,535
1
$113,330
0
$0
0
$0
FILES CLOSED FOR INCOMPLETENESS
1
$103,420
0
$0
3
$142,730
0
$0
0
$0
0
$0
Aggregated Statistics For Year 2006 (Based on 4 partial tracts)
A) FHA, FSA/RHS & VA Home Purchase Loans
B) Conventional Home Purchase Loans
C) Refinancings
D) Home Improvement Loans
F) Non-occupant Loans on < 5 Family Dwellings (A B C & D)
G) Loans On Manufactured Home Dwelling (A B C & D)
Number
Average Value
Number
Average Value
Number
Average Value
Number
Average Value
Number
Average Value
Number
Average Value
LOANS ORIGINATED
3
$116,680
22
$101,094
76
$92,785
14
$38,336
4
$62,582
9
$63,081
APPLICATIONS APPROVED, NOT ACCEPTED
0
$0
6
$118,727
12
$93,890
1
$67,300
0
$0
2
$88,525
APPLICATIONS DENIED
1
$57,160
8
$71,610
50
$101,894
14
$22,033
2
$87,890
8
$46,331
APPLICATIONS WITHDRAWN
0
$0
4
$68,182
22
$118,498
2
$103,280
1
$56,420
1
$48,640
FILES CLOSED FOR INCOMPLETENESS
0
$0
0
$0
15
$132,728
0
$0
0
$0
0
$0
Aggregated Statistics For Year 2005 (Based on 4 partial tracts)
A) FHA, FSA/RHS & VA Home Purchase Loans
B) Conventional Home Purchase Loans
C) Refinancings
D) Home Improvement Loans
F) Non-occupant Loans on < 5 Family Dwellings (A B C & D)
G) Loans On Manufactured Home Dwelling (A B C & D)
Number
Average Value
Number
Average Value
Number
Average Value
Number
Average Value
Number
Average Value
Number
Average Value
LOANS ORIGINATED
3
$118,637
37
$89,906
95
$100,946
15
$23,809
7
$78,983
18
$66,179
APPLICATIONS APPROVED, NOT ACCEPTED
1
$112,810
5
$88,436
19
$81,836
2
$60,215
2
$71,985
3
$89,507
APPLICATIONS DENIED
1
$89,980
11
$73,706
68
$107,710
12
$47,136
2
$76,250
16
$66,335
APPLICATIONS WITHDRAWN
0
$0
4
$96,638
36
$112,637
2
$215,510
1
$45,720
2
$112,635
FILES CLOSED FOR INCOMPLETENESS
0
$0
1
$82,690
7
$122,786
0
$0
0
$0
0
$0
Aggregated Statistics For Year 2004 (Based on 4 partial tracts)
A) FHA, FSA/RHS & VA Home Purchase Loans
B) Conventional Home Purchase Loans
C) Refinancings
D) Home Improvement Loans
F) Non-occupant Loans on < 5 Family Dwellings (A B C & D)
G) Loans On Manufactured Home Dwelling (A B C & D)
Number
Average Value
Number
Average Value
Number
Average Value
Number
Average Value
Number
Average Value
Number
Average Value
LOANS ORIGINATED
9
$98,330
36
$93,998
101
$99,722
11
$26,200
3
$60,237
22
$56,113
APPLICATIONS APPROVED, NOT ACCEPTED
2
$83,645
2
$35,995
24
$108,972
2
$54,720
0
$0
4
$59,445
APPLICATIONS DENIED
2
$91,085
8
$82,640
55
$105,429
12
$35,237
1
$120,140
13
$81,168
APPLICATIONS WITHDRAWN
1
$134,080
4
$112,632
26
$95,367
2
$50,035
0
$0
4
$89,412
FILES CLOSED FOR INCOMPLETENESS
0
$0
1
$107,490
12
$101,737
0
$0
0
$0
0
$0
Aggregated Statistics For Year 2003 (Based on 4 partial tracts)
A) FHA, FSA/RHS & VA Home Purchase Loans
B) Conventional Home Purchase Loans
C) Refinancings
D) Home Improvement Loans
F) Non-occupant Loans on < 5 Family Dwellings (A B C & D)
Number
Average Value
Number
Average Value
Number
Average Value
Number
Average Value
Number
Average Value
LOANS ORIGINATED
5
$80,514
32
$96,472
189
$96,335
5
$18,102
6
$54,223
APPLICATIONS APPROVED, NOT ACCEPTED
0
$0
3
$33,780
21
$126,056
2
$3,890
0
$0
APPLICATIONS DENIED
0
$0
7
$52,974
64
$88,643
6
$32,562
3
$41,673
APPLICATIONS WITHDRAWN
0
$0
4
$111,428
22
$94,657
0
$0
0
$0
FILES CLOSED FOR INCOMPLETENESS
0
$0
3
$73,193
5
$86,516
0
$0
0
$0
Aggregated Statistics For Year 2002 (Based on 4 partial tracts)
A) FHA, FSA/RHS & VA Home Purchase Loans
B) Conventional Home Purchase Loans
C) Refinancings
D) Home Improvement Loans
F) Non-occupant Loans on < 5 Family Dwellings (A B C & D)
Number
Average Value
Number
Average Value
Number
Average Value
Number
Average Value
Number
Average Value
LOANS ORIGINATED
3
$101,103
31
$100,204
158
$87,729
11
$32,576
4
$48,805
APPLICATIONS APPROVED, NOT ACCEPTED
0
$0
1
$173,160
21
$99,816
1
$7,770
0
$0
APPLICATIONS DENIED
2
$102,145
8
$50,528
61
$85,054
4
$11,565
2
$21,580
APPLICATIONS WITHDRAWN
0
$0
5
$68,934
19
$90,567
0
$0
1
$24,390
FILES CLOSED FOR INCOMPLETENESS
0
$0
0
$0
6
$109,773
0
$0
0
$0
Aggregated Statistics For Year 2001 (Based on 4 partial tracts)
A) FHA, FSA/RHS & VA Home Purchase Loans
B) Conventional Home Purchase Loans
C) Refinancings
D) Home Improvement Loans
F) Non-occupant Loans on < 5 Family Dwellings (A B C & D)
Number
Average Value
Number
Average Value
Number
Average Value
Number
Average Value
Number
Average Value
LOANS ORIGINATED
5
$100,952
24
$83,548
142
$79,754
19
$26,504
1
$130,840
APPLICATIONS APPROVED, NOT ACCEPTED
0
$0
5
$90,744
9
$79,132
3
$9,690
0
$0
APPLICATIONS DENIED
1
$75,880
15
$61,235
49
$71,750
10
$16,309
2
$29,265
APPLICATIONS WITHDRAWN
1
$85,370
3
$74,973
23
$65,503
0
$0
0
$0
FILES CLOSED FOR INCOMPLETENESS
0
$0
0
$0
3
$54,673
1
$19,060
0
$0
Aggregated Statistics For Year 2000 (Based on 4 partial tracts)
A) FHA, FSA/RHS & VA Home Purchase Loans
B) Conventional Home Purchase Loans
C) Refinancings
D) Home Improvement Loans
F) Non-occupant Loans on < 5 Family Dwellings (A B C & D)
Number
Average Value
Number
Average Value
Number
Average Value
Number
Average Value
Number
Average Value
LOANS ORIGINATED
5
$85,218
30
$83,808
69
$66,395
17
$13,335
1
$34,300
APPLICATIONS APPROVED, NOT ACCEPTED
0
$0
5
$72,528
14
$76,664
6
$34,280
0
$0
APPLICATIONS DENIED
4
$52,088
20
$72,887
48
$61,897
15
$20,991
1
$14,510
APPLICATIONS WITHDRAWN
0
$0
5
$80,474
14
$69,626
0
$0
0
$0
FILES CLOSED FOR INCOMPLETENESS
0
$0
0
$0
5
$86,708
0
$0
0
$0
Aggregated Statistics For Year 1999 (Based on 2 partial tracts)
A) FHA, FSA/RHS & VA Home Purchase Loans
B) Conventional Home Purchase Loans
C) Refinancings
D) Home Improvement Loans
F) Non-occupant Loans on < 5 Family Dwellings (A B C & D)
Detailed PMIC statistics for the following Tracts:0124.00
, 0125.00
2002 - 2018 National Fire Incident Reporting System (NFIRS) incidents
Based on the data from the years 2002 - 2018 the average number of fires per year is 13. The highest number of fires - 37 took place in 2003, and the least - 0 in 2006. The data has a growing trend.
When looking into fire subcategories, the most reports belonged to: Structure Fires (54.4%), and Outside Fires (39.2%).
Fire incident types reported to NFIRS in Zip Code 48614


 Nearest zip codes: 48649, 48807, 48655, 48841, 48637, 48831.


 Based on the data from the years 2002 - 2018 the average number of fires per year is 13. The highest number of fires - 37 took place in 2003, and the least - 0 in 2006. The data has a growing trend.
 When looking into fire subcategories, the most reports belonged to: Structure Fires (54.4%), and Outside Fires (39.2%).