Estimated zip code population in 2022: 3,096 Zip code population in 2010: 3,359 Zip code population in 2000: 3,377
Houses and condos: 1,332 Renter-occupied apartments: 119
% of renters here:
9%
State:
27%
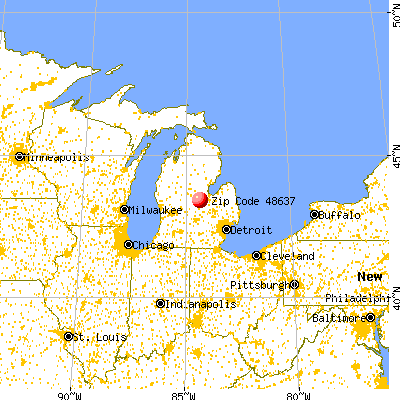
March 2022 cost of living index in zip code 48637: 80.5 (low, U.S. average is 100)
Land area: 72.8 sq. mi. Water area: 0.1 sq. mi.
Population density: 43 people per square mile
(very low).
OSM Map
General Map
Google Map
MSN Map
OSM Map
General Map
Google Map
MSN Map
OSM Map
General Map
Google Map
MSN Map
OSM Map
General Map
Google Map
MSN Map
Please wait while loading the map...
Real estate property taxes paid for housing units in 2022:
This zip code:
1.5% ($2,277)
Michigan:
1.2% ($2,746)
Median real estate property taxes paid for housing units with mortgages in 2022: $2,214 (1.6%) Median real estate property taxes paid for housing units with no mortgage in 2022: $2,344 (1.5%)
Estimated median house/condo value in 2022: $148,745
48637:
$148,745
Michigan:
$224,400
According to our research of Michigan and other state lists, there were 10 registered sex offenders living in 48637 zip code as of May 28, 2024. The ratio of all residents to sex offenders in zip code 48637 is 337 to 1. The ratio of registered sex offenders to all residents in this zip code is near the state average.
Median resident age:
This zip code:
46.6 years
Michigan median age:
40.3 years
Average household size:
This zip code:
2.4 people
Michigan:
2.4 people
Averages for the 2020 tax year for zip code 48637, filed in 2021:
Average Adjusted Gross Income (AGI) in 2020: $55,511 (Individual Income Tax Returns)
Here:
$55,511
State:
$68,945
Salary/wage: $48,436 (reported on 75.0% of returns)
Here:
$48,436
State:
$57,142
(% of AGI for various income ranges: 897.8% for AGIs below $25k, 3088.9% for AGIs $25k-50k, 6201.7% for AGIs $50k-75k, 9130.0% for AGIs $75k-100k, 18436.4% for AGIs $100k-200k)
Taxable interest for individuals: $1,290 (reported on 36.0% of returns)
This zip code:
$1,290
Michigan:
$1,630
(% of AGI for various income ranges: 23.6% for AGIs below $25k, 38.6% for AGIs $25k-50k, 56.7% for AGIs $50k-75k, 68.3% for AGIs $75k-100k, 324.5% for AGIs $100k-200k)
Ordinary dividends: $3,432 (reported on 15.2% of returns)
Here:
$3,432
State:
$6,972
(% of AGI for various income ranges: 19.7% for AGIs below $25k, 33.4% for AGIs $25k-50k, 72.2% for AGIs $50k-75k, 34.2% for AGIs $75k-100k, 453.6% for AGIs $100k-200k)
Net capital gain/loss in AGI: +$8,553 (reported on 11.6% of returns)
Here:
+$8,553
State:
+$20,064
(% of AGI for various income ranges: 3.6% for AGIs below $25k, 25.4% for AGIs $25k-50k, 93.3% for AGIs $50k-75k, 1231.8% for AGIs $100k-200k)
Profit/loss from business: +$5,289 (reported on 11.6% of returns)
Here:
+$5,289
State:
+$11,172
(% of AGI for various income ranges: 47.8% for AGIs below $25k, 68.0% for AGIs $25k-50k, 58.3% for AGIs $50k-75k, 230.8% for AGIs $75k-100k, 193.6% for AGIs $100k-200k)
Taxable individual retirement arrangement distribution: $11,405 (reported on 12.8% of returns)
48637:
$11,405
Michigan:
$19,803
(% of AGI for various income ranges: 97.5% for AGIs below $25k, 123.4% for AGIs $25k-50k, 286.1% for AGIs $50k-75k, 447.5% for AGIs $75k-100k, 509.1% for AGIs $100k-200k)
Total itemized deductions: $38,700 (reported on 2.4% of returns)
Here:
$38,700
State:
$34,117
(% of AGI for various income ranges: 1407.3% for AGIs $100k-200k)
Charity contributions: $10,667 (reported on 1.8% of returns)
Here:
$10,667
State:
$13,548
(% of AGI for various income ranges: 290.9% for AGIs $100k-200k)
Taxes paid: $6,850 (reported on 2.4% of returns)
48637:
$6,850
State:
$7,972
(% of AGI for various income ranges: 249.1% for AGIs $100k-200k)
Earned income credit: $2,067 (reported on 12.8% of returns)
Here:
$2,067
State:
$2,251
(% of AGI for various income ranges: 59.7% for AGIs below $25k, 62.6% for AGIs $25k-50k)
Percentage of individuals using paid preparers for their 2020 taxes: 93.3%
Here:
93%
State:
93%
(% for various income ranges: 94.2% for AGIs below $25k, 93.2% for AGIs $25k-50k, 96.2% for AGIs $50k-75k, 94.4% for AGIs $75k-100k, 90.5% for AGIs $100k-200k, 66.7% for AGIs over 200k)
Averages for the 2012 tax year for zip code 48637, filed in 2013:
Average Adjusted Gross Income (AGI) in 2012: $45,896 (Individual Income Tax Returns)
Here:
$45,896
State:
$55,609
Salary/wage: $38,160 (reported on 79.4% of returns)
Here:
$38,160
State:
$46,782
(% of AGI for various income ranges: 63.4% for AGIs below $25k, 68.5% for AGIs $25k-50k, 71.6% for AGIs $50k-75k, 75.7% for AGIs $75k-100k, 69.6% for AGIs $100k-200k, 32.4% for AGIs over 200k)
Taxable interest for individuals: $1,132 (reported on 39.4% of returns)
This zip code:
$1,132
Michigan:
$1,491
(% of AGI for various income ranges: 1.9% for AGIs below $25k, 0.8% for AGIs $25k-50k, 1.2% for AGIs $50k-75k, 0.7% for AGIs $75k-100k, 0.3% for AGIs $100k-200k, 1.4% for AGIs over 200k)
Ordinary dividends: $2,127 (reported on 18.2% of returns)
Here:
$2,127
State:
$6,225
(% of AGI for various income ranges: 1.3% for AGIs below $25k, 0.5% for AGIs $25k-50k, 0.7% for AGIs $50k-75k, 1.2% for AGIs $75k-100k, 1.2% for AGIs $100k-200k)
Net capital gain/loss in AGI: +$9,359 (reported on 10.3% of returns)
Here:
+$9,359
State:
+$9,326
(% of AGI for various income ranges: 0.1% for AGIs $50k-75k, 1.8% for AGIs $75k-100k, 9.5% for AGIs $100k-200k)
Profit/loss from business: +$4,322 (reported on 10.9% of returns)
Here:
+$4,322
State:
+$11,523
(% of AGI for various income ranges: 4.0% for AGIs below $25k, 1.4% for AGIs $25k-50k, 0.6% for AGIs $50k-75k, 1.0% for AGIs $75k-100k)
Taxable individual retirement arrangement distribution: $9,442 (reported on 11.5% of returns)
48637:
$9,442
Michigan:
$15,298
(% of AGI for various income ranges: 3.0% for AGIs below $25k, 2.1% for AGIs $25k-50k, 2.3% for AGIs $50k-75k, 2.7% for AGIs $75k-100k, 3.5% for AGIs $100k-200k)
Total itemized deductions: $17,900 (20% of AGI, reported on 21.2% of returns)
Here:
$17,900
State:
$21,628
Here:
20.3% of AGI
State:
18.4% of AGI
(% of AGI for various income ranges: 5.9% for AGIs below $25k, 7.2% for AGIs $25k-50k, 6.4% for AGIs $50k-75k, 9.9% for AGIs $75k-100k, 11.7% for AGIs $100k-200k, 7.4% for AGIs over 200k)
Charity contributions: $2,719 (reported on 15.8% of returns)
Here:
$2,719
State:
$4,225
(% of AGI for various income ranges: 1.1% for AGIs $25k-50k, 0.6% for AGIs $50k-75k, 1.1% for AGIs $75k-100k, 2.1% for AGIs $100k-200k)
Taxes paid: $6,029 (reported on 21.2% of returns)
48637:
$6,029
State:
$8,327
(% of AGI for various income ranges: 1.0% for AGIs below $25k, 1.9% for AGIs $25k-50k, 1.8% for AGIs $50k-75k, 3.1% for AGIs $75k-100k, 4.4% for AGIs $100k-200k, 4.6% for AGIs over 200k)
Earned income credit: $2,152 (reported on 15.2% of returns)
Here:
$2,152
State:
$2,306
(% of AGI for various income ranges: 4.8% for AGIs below $25k, 1.0% for AGIs $25k-50k)
Percentage of individuals using paid preparers for their 2012 taxes: 64.8%
Here:
65%
State:
57%
(% for various income ranges: 58.8% for AGIs below $25k, 70.0% for AGIs $25k-50k, 68.0% for AGIs $50k-75k, 66.7% for AGIs $75k-100k, 72.7% for AGIs $100k-200k, 66.7% for AGIs over 200k)
Averages for the 2004 tax year for zip code 48637, filed in 2005:
Average Adjusted Gross Income (AGI) in 2004: $36,541 (Individual Income Tax Returns)
Here:
$36,541
State:
$48,204
Salary/wage: $33,593 (reported on 83.7% of returns)
Here:
$33,593
State:
$42,791
(% of AGI for various income ranges: 98.4% for AGIs below $10k, 61.6% for AGIs $10k-25k, 71.8% for AGIs $25k-50k, 84.0% for AGIs $50k-75k, 85.0% for AGIs $75k-100k, 72.6% for AGIs over 100k)
Taxable interest for individuals: $1,153 (reported on 50.6% of returns)
This zip code:
$1,153
Michigan:
$1,725
(% of AGI for various income ranges: 5.2% for AGIs below $10k, 5.4% for AGIs $10k-25k, 1.6% for AGIs $25k-50k, 0.9% for AGIs $50k-75k, 0.5% for AGIs $75k-100k, 0.8% for AGIs over 100k)
Taxable dividends: $1,302 (reported on 21.8% of returns)
Here:
$1,302
State:
$3,420
(% of AGI for various income ranges: 1.1% for AGIs below $10k, 1.2% for AGIs $10k-25k, 1.0% for AGIs $25k-50k, 0.5% for AGIs $50k-75k, 0.7% for AGIs $75k-100k, 0.6% for AGIs over 100k)
Net capital gain/loss: +$1,083 (reported on 15.1% of returns)
Here:
+$1,083
State:
+$8,532
(% of AGI for various income ranges: -1.7% for AGIs below $10k, -0.2% for AGIs $10k-25k, 0.5% for AGIs $25k-50k, 0.1% for AGIs $50k-75k, 1.5% for AGIs $75k-100k, 0.4% for AGIs over 100k)
Profit/loss from business: +$3,737 (reported on 12.9% of returns)
Here:
+$3,737
State:
+$9,547
(% of AGI for various income ranges: 6.8% for AGIs below $10k, 6.1% for AGIs $10k-25k, 1.0% for AGIs $25k-50k, 0.1% for AGIs $50k-75k, 0.8% for AGIs $75k-100k)
IRA payment deduction: $3,333 (reported on 2.5% of returns)
48637:
$3,333
Michigan:
$2,875
Total itemized deductions: $14,375 (22% of AGI, reported on 26.4% of returns)
Here:
$14,375
State:
$18,509
Here:
22.1% of AGI
State:
20.7% of AGI
(% of AGI for various income ranges: 15.8% for AGIs below $10k, 7.4% for AGIs $10k-25k, 8.5% for AGIs $25k-50k, 10.6% for AGIs $50k-75k, 12.3% for AGIs $75k-100k, 12.2% for AGIs over 100k)
Charity contributions deductions: $2,146 (3% of AGI, reported on 22.5% of returns)
Here:
$2,146
State:
$3,365
Here:
3.2% of AGI
State:
3.6% of AGI
(% of AGI for various income ranges: 1.0% for AGIs below $10k, 1.1% for AGIs $10k-25k, 1.1% for AGIs $25k-50k, 1.1% for AGIs $50k-75k, 1.7% for AGIs $75k-100k, 1.8% for AGIs over 100k)
Total tax: $4,248 (reported on 73.7% of returns)
48637:
$4,248
State:
$7,691
(% of AGI for various income ranges: 2.5% for AGIs below $10k, 4.2% for AGIs $10k-25k, 5.8% for AGIs $25k-50k, 8.0% for AGIs $50k-75k, 10.5% for AGIs $75k-100k, 15.5% for AGIs over 100k)
Earned income credit: $1,493 (reported on 13.5% of returns)
Here:
$1,493
State:
$1,737
Percentage of individuals using paid preparers for their 2004 taxes: 66.0%
Here:
66%
State:
60%
(% for various income ranges: 57.5% for AGIs below $10k, 64.6% for AGIs $10k-25k, 67.7% for AGIs $25k-50k, 70.2% for AGIs $50k-75k, 73.9% for AGIs $75k-100k, 76.6% for AGIs over 100k)
Household received Food Stamps/SNAP in the past 12 months: 148 Household did not receive Food Stamps/SNAP in the past 12 months: 1,128
Women who had a birth in the past 12 months: 42 (35 now married, 7 unmarried) Women who did not have a birth in the past 12 months: 515 (269 now married, 245 unmarried)
Housing units in zip code 48637 with a mortgage: 577 (46 second mortgage, 5 home equity loan, 27 both second mortgage and home equity loan) Houses without a mortgage: 8
Median monthly owner costs for units with a mortgage: $1,219 Median monthly owner costs for units without a mortgage: $552
Residents with income below the poverty level in 2022:
This zip code:
16.5%
Whole state:
13.4%
Residents with income below 50% of the poverty level in 2022:
This zip code:
4.9%
Whole state:
6.9%
Median number of rooms in houses and condos:
Here:
6.7
State:
6.5
Median number of rooms in apartments:
Here:
5.4
State:
4.3
Notable locations in this zip code not listed on our city pages
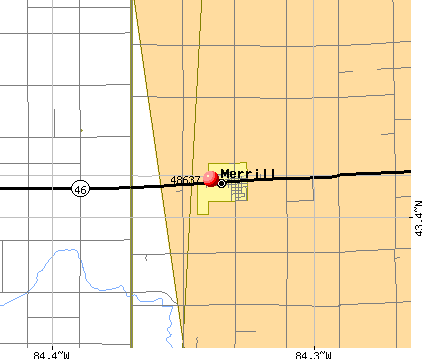
Notable locations in zip code 48637: Jam (A), Meridian Station (B), Lake of Dreams Campground (C), Merrill Station (D), Twin Bridges Golf Course (E), Merrill District Library (F), Jonesfield Township Hall (G), Merrill Village Police Deparment (H), Jonesfield - Lakefield Fire Department (I). Display/hide their locations on the map
Churches in zip code 48637 include: Saint Patrick Ryan Church (A), Merrill Church (B), Sacred Heart Church (C), Congregational Christian Church (D). Display/hide their locations on the map
440 married couples with children.
134 single-parent households (61 men, 73 women).
98.1% of residents of 48637 zip code speak English at home.
0.5% of residents speak Spanish at home (87% very well, 13% well).
1.0% of residents speak other Indo-European language at home (100% very well).
0.5% of residents speak Asian or Pacific Island language at home (100% very well).
Foreign born population: 70 (2.3%) (39.2% of them are naturalized citizens)
This zip code:
2.3%
Whole state:
6.9%
56%Honduras
21%Malaysia
4%Romania
1%France
28%German
10%American
10%English
7%Irish
4%Polish
4%French
3%Italian
Year of entry for the foreign-born population
32010 or later
02000 to 2009
101990 to 1999
58Before 1990
Major facilities with environmental interests located in this zip code:
MERRILL ELEMENTARY SCHOOL (325 WEST ALICE STREET in MERRILL, MI)
(National Center for Education Statistics) - STATE ID-02520 Organizations: MERRILL COMMUNITY SCHOOLS (SCHOOL DISTRICT)
MERRILL HIGH SCHOOL (555 W. ALICE STREET in MERRILL, MI)
(National Center for Education Statistics) - STATE ID-02519 Organizations: MERRILL COMMUNITY SCHOOLS (SCHOOL DISTRICT)
MERRILL MIDDLE SCHOOL (755 W. ALICE STREET in MERRILL, MI)
(National Center for Education Statistics) - STATE ID-06222 Organizations: MERRILL COMMUNITY SCHOOLS (SCHOOL DISTRICT)
MERRILL WWSL (NORTH FENMORE ROAD in MERRILL, MI)
CRITERIA AND HAZARDOUS AIR POLLUTANT INVENTORY (Inventory of air pollution sources) National Pollutant Discharge Elimination System NON-MAJOR (Tracking pollutant discharge elimination systems) - permit National Pollutant Discharge Elimination System NON-MAJOR (Tracking pollutant discharge elimination systems) - permit Business SIC classification: SEWERAGE SYSTEMS; REFUSE SYSTEMS Business NAICS classification: SOLID WASTE LANDFILL. Organizations: VILLAGE OF MERRILL WWSL (CONTACT/OWNER)
Alternative names: VILLAGE OF MERRILL DUMP, VILLAGE OF MERRILL WWSL
MERRILL VILLAGE OF (205 MIDLAND ST in MERRILL, MI)
(Resource Conservation and Recovery Act (tracking hazardous waste))
MI DEPT/TRANSPORTATION (105 1/2 W SAGINAW in MERRILL, MI)
(Resource Conservation and Recovery Act (tracking hazardous waste)) Organizations: MICH DEPT OF TRANSPORTATION (CONTACT/OPERATOR)
Housing units lacking complete plumbing facilities: 1.6% Housing units lacking complete kitchen facilities: 2.4%
46.7%Bottled, tank, or LP gas
32.0%Utility gas
8.9%Wood
6.6%Fuel oil, kerosene, etc.
3.8%Electricity
2.0%Other fuel
Population in 1990: 2,702. Population change in the 1990s: +675 (+25.0%).
Place of birth for U.S.-born residents:
This state: 2,856
Northeast: 20
Midwest: 44
South: 66
West: 21
73% of the 48637 zip code residents lived in the same house 5 years ago. Out of people who lived in different houses, 58% lived in this county. Out of people who lived in different counties, 50% lived in Michigan.
88% of the 48637 zip code residents lived in the same house 1 year ago. Out of people who lived in different houses, 71% moved from this county. Out of people who lived in different houses, 16% moved from different county within same state. Out of people who lived in different houses, 9% moved from different state.
Private vs. public school enrollment:
Students in private schools in grades 1 to 8 (elementary and middle school): 6
Here:
1.8%
Michigan:
12.4%
Students in private schools in grades 9 to 12 (high school): 5
Here:
3.5%
Michigan:
9.8%
Students in private undergraduate colleges: 6
Here:
8.8%
Michigan:
14.9%
Occupation by median earnings in the past 12 months ($)
90,147Computer and mathematical occupations
80,767Building and grounds cleaning and maintenance occupations
74,979Management occupations
67,166Law enforcement workers including supervisors
60,681Community and social service occupations
58,341Health diagnosing and treating practitioners and other technical occupations
Top industries in this zip code by the number of employees in 2005:
Accommodation and Food Services: Full-Service Restaurants (10-19 employees: 3 establishments)
Construction: New Single-Family Housing Construction (except Operative Builders) (10-19: 1, 1-4: 1)
Other Services (except Public Administration): Religious Organizations (5-9: 1, 1-4: 4)
Administrative and Support and Waste Management and Remediation Services: Landscaping Services (5-9: 1, 1-4: 2)
People in group quarters in 2010:
9 people in group homes intended for adults
2 people in other noninstitutional facilities
People in group quarters in 2000:
11 people in other noninstitutional group quarters
Fatal accident statistics in 2014:
Fatal accident count: 1
Vehicles involved in fatal accidents: 1
Fatal accidents caused by drunken drivers: 0
Fatalities: 1
Persons involved in fatal accidents: 1
Pedestrians involved in fatal accidents: 0
Fatal accident statistics in 2011:
Fatal accident count: 1
Vehicles involved in fatal accidents: 2
Fatal accidents caused by drunken drivers: 1
Fatalities: 1
Persons involved in fatal accidents: 2
Pedestrians involved in fatal accidents: 0
Home Mortgage Disclosure Act Aggregated Statistics For Year 2009 (Based on 2 full and 2 partial tracts)
A) FHA, FSA/RHS & VA Home Purchase Loans
B) Conventional Home Purchase Loans
C) Refinancings
D) Home Improvement Loans
F) Non-occupant Loans on < 5 Family Dwellings (A B C & D)
G) Loans On Manufactured Home Dwelling (A B C & D)
Number
Average Value
Number
Average Value
Number
Average Value
Number
Average Value
Number
Average Value
Number
Average Value
LOANS ORIGINATED
14
$98,318
15
$123,397
133
$108,205
5
$21,636
2
$91,990
7
$59,509
APPLICATIONS APPROVED, NOT ACCEPTED
2
$50,395
3
$71,713
11
$113,867
0
$0
0
$0
2
$42,060
APPLICATIONS DENIED
4
$86,462
2
$78,990
39
$113,779
4
$15,988
2
$40,540
2
$86,010
APPLICATIONS WITHDRAWN
4
$75,198
0
$0
12
$146,415
2
$7,000
0
$0
1
$112,910
FILES CLOSED FOR INCOMPLETENESS
0
$0
1
$215,220
2
$155,350
0
$0
0
$0
0
$0
Aggregated Statistics For Year 2008 (Based on 2 full and 2 partial tracts)
A) FHA, FSA/RHS & VA Home Purchase Loans
B) Conventional Home Purchase Loans
C) Refinancings
D) Home Improvement Loans
E) Loans on Dwellings For 5+ Families
F) Non-occupant Loans on < 5 Family Dwellings (A B C & D)
G) Loans On Manufactured Home Dwelling (A B C & D)
Number
Average Value
Number
Average Value
Number
Average Value
Number
Average Value
Number
Average Value
Number
Average Value
Number
Average Value
LOANS ORIGINATED
19
$76,434
28
$113,692
95
$105,539
15
$32,255
2
$237,975
6
$39,207
9
$80,487
APPLICATIONS APPROVED, NOT ACCEPTED
3
$73,373
4
$46,972
7
$82,547
0
$0
0
$0
1
$35,620
1
$35,620
APPLICATIONS DENIED
4
$50,995
13
$60,308
45
$113,291
13
$38,082
0
$0
4
$14,498
11
$79,369
APPLICATIONS WITHDRAWN
8
$73,252
7
$117,451
14
$106,639
1
$62,900
0
$0
1
$60,620
2
$80,705
FILES CLOSED FOR INCOMPLETENESS
0
$0
0
$0
0
$0
0
$0
0
$0
0
$0
0
$0
Aggregated Statistics For Year 2007 (Based on 2 full and 2 partial tracts)
A) FHA, FSA/RHS & VA Home Purchase Loans
B) Conventional Home Purchase Loans
C) Refinancings
D) Home Improvement Loans
F) Non-occupant Loans on < 5 Family Dwellings (A B C & D)
G) Loans On Manufactured Home Dwelling (A B C & D)
Number
Average Value
Number
Average Value
Number
Average Value
Number
Average Value
Number
Average Value
Number
Average Value
LOANS ORIGINATED
8
$83,192
42
$100,028
92
$98,446
26
$30,702
10
$90,662
5
$67,748
APPLICATIONS APPROVED, NOT ACCEPTED
1
$144,740
6
$73,353
17
$106,555
3
$31,293
2
$173,915
0
$0
APPLICATIONS DENIED
4
$84,992
13
$139,489
90
$108,056
16
$43,386
5
$132,834
9
$84,301
APPLICATIONS WITHDRAWN
1
$144,740
2
$92,830
35
$105,795
2
$37,890
1
$316,000
4
$70,208
FILES CLOSED FOR INCOMPLETENESS
0
$0
2
$128,985
4
$135,458
2
$109,990
2
$128,985
0
$0
Aggregated Statistics For Year 2006 (Based on 2 full and 2 partial tracts)
A) FHA, FSA/RHS & VA Home Purchase Loans
B) Conventional Home Purchase Loans
C) Refinancings
D) Home Improvement Loans
F) Non-occupant Loans on < 5 Family Dwellings (A B C & D)
G) Loans On Manufactured Home Dwelling (A B C & D)
Number
Average Value
Number
Average Value
Number
Average Value
Number
Average Value
Number
Average Value
Number
Average Value
LOANS ORIGINATED
17
$81,338
58
$104,956
124
$83,575
29
$44,297
13
$97,500
13
$68,883
APPLICATIONS APPROVED, NOT ACCEPTED
2
$104,990
9
$77,388
14
$90,218
1
$6,060
1
$6,060
4
$35,498
APPLICATIONS DENIED
2
$91,990
23
$68,086
108
$89,079
18
$44,806
1
$67,440
7
$51,070
APPLICATIONS WITHDRAWN
0
$0
2
$96,620
30
$107,373
6
$96,323
1
$143,980
0
$0
FILES CLOSED FOR INCOMPLETENESS
0
$0
2
$63,275
24
$111,760
0
$0
0
$0
0
$0
Aggregated Statistics For Year 2005 (Based on 2 full and 2 partial tracts)
A) FHA, FSA/RHS & VA Home Purchase Loans
B) Conventional Home Purchase Loans
C) Refinancings
D) Home Improvement Loans
F) Non-occupant Loans on < 5 Family Dwellings (A B C & D)
G) Loans On Manufactured Home Dwelling (A B C & D)
Number
Average Value
Number
Average Value
Number
Average Value
Number
Average Value
Number
Average Value
Number
Average Value
LOANS ORIGINATED
9
$77,363
61
$106,440
154
$99,981
15
$35,882
7
$76,343
8
$100,106
APPLICATIONS APPROVED, NOT ACCEPTED
0
$0
20
$67,926
25
$90,887
0
$0
0
$0
4
$34,998
APPLICATIONS DENIED
0
$0
24
$64,252
106
$102,243
20
$51,233
2
$89,040
8
$95,890
APPLICATIONS WITHDRAWN
0
$0
12
$75,829
44
$97,010
6
$147,233
3
$125,420
1
$66,690
FILES CLOSED FOR INCOMPLETENESS
0
$0
0
$0
19
$127,404
2
$29,995
0
$0
0
$0
Aggregated Statistics For Year 2004 (Based on 2 full and 2 partial tracts)
A) FHA, FSA/RHS & VA Home Purchase Loans
B) Conventional Home Purchase Loans
C) Refinancings
D) Home Improvement Loans
F) Non-occupant Loans on < 5 Family Dwellings (A B C & D)
G) Loans On Manufactured Home Dwelling (A B C & D)
Number
Average Value
Number
Average Value
Number
Average Value
Number
Average Value
Number
Average Value
Number
Average Value
LOANS ORIGINATED
9
$89,976
55
$102,761
205
$97,426
20
$27,146
9
$137,304
7
$55,860
APPLICATIONS APPROVED, NOT ACCEPTED
3
$73,570
4
$84,290
20
$121,383
6
$36,922
6
$121,322
5
$93,552
APPLICATIONS DENIED
2
$95,485
22
$71,888
90
$98,313
16
$19,248
3
$68,433
8
$73,175
APPLICATIONS WITHDRAWN
1
$59,870
2
$117,840
38
$111,227
4
$25,498
3
$102,233
2
$116,700
FILES CLOSED FOR INCOMPLETENESS
0
$0
4
$96,990
11
$119,319
0
$0
0
$0
0
$0
Aggregated Statistics For Year 2003 (Based on 2 full and 4 partial tracts)
A) FHA, FSA/RHS & VA Home Purchase Loans
B) Conventional Home Purchase Loans
C) Refinancings
D) Home Improvement Loans
F) Non-occupant Loans on < 5 Family Dwellings (A B C & D)
Number
Average Value
Number
Average Value
Number
Average Value
Number
Average Value
Number
Average Value
LOANS ORIGINATED
15
$110,745
62
$111,682
515
$93,433
23
$40,099
12
$50,472
APPLICATIONS APPROVED, NOT ACCEPTED
2
$78,990
8
$110,250
60
$111,379
1
$56,100
0
$0
APPLICATIONS DENIED
1
$72,860
10
$79,876
140
$86,216
13
$16,822
6
$53,957
APPLICATIONS WITHDRAWN
3
$107,637
8
$122,459
77
$100,636
2
$25,150
2
$44,060
FILES CLOSED FOR INCOMPLETENESS
0
$0
1
$68,000
11
$111,346
0
$0
0
$0
Aggregated Statistics For Year 2002 (Based on 2 full and 4 partial tracts)
A) FHA, FSA/RHS & VA Home Purchase Loans
B) Conventional Home Purchase Loans
C) Refinancings
D) Home Improvement Loans
F) Non-occupant Loans on < 5 Family Dwellings (A B C & D)
Number
Average Value
Number
Average Value
Number
Average Value
Number
Average Value
Number
Average Value
LOANS ORIGINATED
18
$88,688
78
$108,004
397
$93,919
50
$21,835
14
$62,011
APPLICATIONS APPROVED, NOT ACCEPTED
1
$119,190
6
$119,083
31
$95,467
6
$21,993
2
$62,995
APPLICATIONS DENIED
0
$0
12
$79,458
99
$79,379
14
$12,084
2
$46,995
APPLICATIONS WITHDRAWN
3
$76,367
8
$105,258
64
$74,681
3
$9,863
2
$46,995
FILES CLOSED FOR INCOMPLETENESS
2
$73,995
2
$91,315
22
$86,448
0
$0
0
$0
Aggregated Statistics For Year 2001 (Based on 2 full and 4 partial tracts)
A) FHA, FSA/RHS & VA Home Purchase Loans
B) Conventional Home Purchase Loans
C) Refinancings
D) Home Improvement Loans
E) Loans on Dwellings For 5+ Families
F) Non-occupant Loans on < 5 Family Dwellings (A B C & D)
Number
Average Value
Number
Average Value
Number
Average Value
Number
Average Value
Number
Average Value
Number
Average Value
LOANS ORIGINATED
13
$96,425
57
$93,305
295
$87,366
37
$22,074
2
$264,975
2
$55,990
APPLICATIONS APPROVED, NOT ACCEPTED
0
$0
5
$69,906
31
$78,770
8
$44,451
0
$0
0
$0
APPLICATIONS DENIED
0
$0
11
$98,523
98
$69,969
13
$13,213
0
$0
0
$0
APPLICATIONS WITHDRAWN
3
$48,347
5
$112,292
42
$76,165
4
$47,138
0
$0
1
$61,790
FILES CLOSED FOR INCOMPLETENESS
0
$0
0
$0
15
$61,592
1
$6,060
0
$0
0
$0
Aggregated Statistics For Year 2000 (Based on 2 full and 4 partial tracts)
A) FHA, FSA/RHS & VA Home Purchase Loans
B) Conventional Home Purchase Loans
C) Refinancings
D) Home Improvement Loans
F) Non-occupant Loans on < 5 Family Dwellings (A B C & D)
Number
Average Value
Number
Average Value
Number
Average Value
Number
Average Value
Number
Average Value
LOANS ORIGINATED
14
$83,866
75
$89,538
117
$73,047
41
$14,334
12
$91,983
APPLICATIONS APPROVED, NOT ACCEPTED
0
$0
4
$102,258
19
$66,728
6
$9,665
1
$21,980
APPLICATIONS DENIED
2
$97,990
39
$52,718
74
$68,435
5
$16,628
8
$82,630
APPLICATIONS WITHDRAWN
0
$0
13
$88,056
58
$61,744
4
$64,108
0
$0
FILES CLOSED FOR INCOMPLETENESS
1
$71,230
1
$225,560
16
$95,536
0
$0
0
$0
Aggregated Statistics For Year 1999 (Based on 1 full and 2 partial tracts)
A) FHA, FSA/RHS & VA Home Purchase Loans
B) Conventional Home Purchase Loans
C) Refinancings
D) Home Improvement Loans
F) Non-occupant Loans on < 5 Family Dwellings (A B C & D)
2002 - 2018 National Fire Incident Reporting System (NFIRS) incidents
According to the data from the years 2002 - 2018 the average number of fire incidents per year is 24. The highest number of fires - 36 took place in 2003, and the least - 11 in 2014. The data has a dropping trend.
When looking into fire subcategories, the most incidents belonged to: Structure Fires (59.9%), and Outside Fires (25.6%).
Fire incident types reported to NFIRS in Zip Code 48637


 Nearest zip codes: 48662, 48626, 48615, 48614, 48640, 48655.


 According to the data from the years 2002 - 2018 the average number of fire incidents per year is 24. The highest number of fires - 36 took place in 2003, and the least - 11 in 2014. The data has a dropping trend.
 When looking into fire subcategories, the most incidents belonged to: Structure Fires (59.9%), and Outside Fires (25.6%).