Estimated zip code population in 2022: 5,016 Zip code population in 2010: 5,125 Zip code population in 2000: 5,159
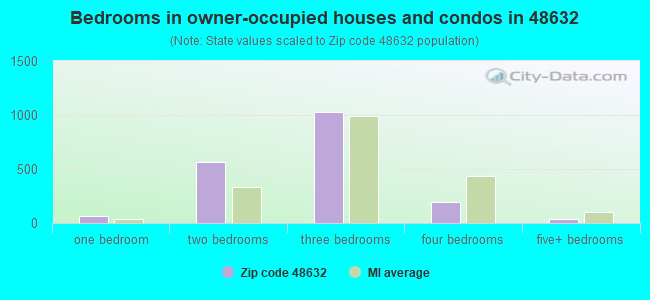
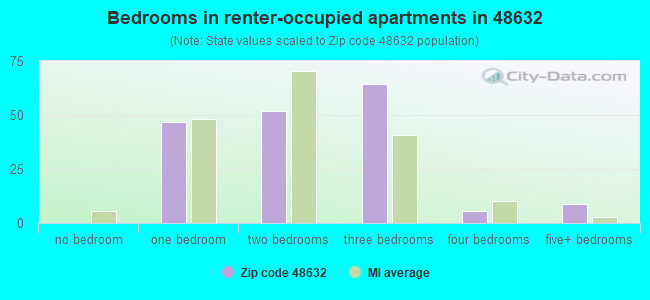
Houses and condos: 4,462 Renter-occupied apartments: 177
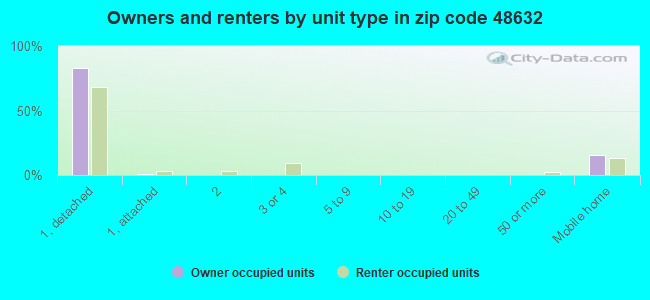
% of renters here:
9%
State:
27%
March 2022 cost of living index in zip code 48632: 81.0 (low, U.S. average is 100)
Land area: 126.8 sq. mi. Water area: 4.6 sq. mi.
Population density: 40 people per square mile
(very low).
OSM Map
General Map
Google Map
MSN Map
OSM Map
General Map
Google Map
MSN Map
OSM Map
General Map
Google Map
MSN Map
OSM Map
General Map
Google Map
MSN Map
Please wait while loading the map...
Real estate property taxes paid for housing units in 2022:
This zip code:
0.9% ($1,301)
Michigan:
1.2% ($2,746)
Median real estate property taxes paid for housing units with mortgages in 2022: $1,411 (0.8%) Median real estate property taxes paid for housing units with no mortgage in 2022: $1,225 (1.1%)
Business Search- 14 Million verified businesses
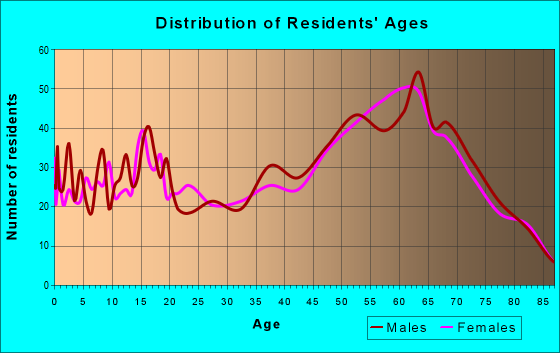
Males: 2,618
(52.2%)
Females: 2,397
(47.8%)
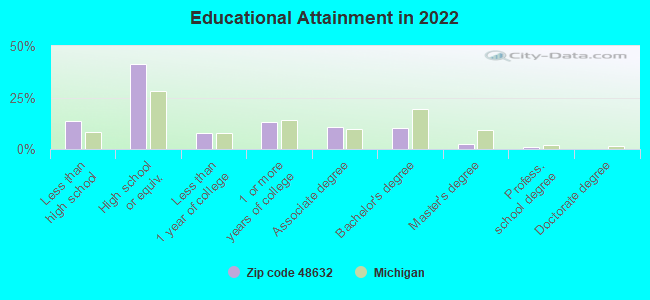
For population 25 years and over in 48632:
High school or higher: 86.1%
Bachelor's degree or higher: 14.1%
Graduate or professional degree: 3.9%
Unemployed: 8.6%
Mean travel time to work (commute): 31.0 minutes
For population 15 years and over in 48632:
Never married: 24.9%
Now married: 52.3%
Separated: 1.1%
Widowed: 7.7%
Divorced: 14.0%
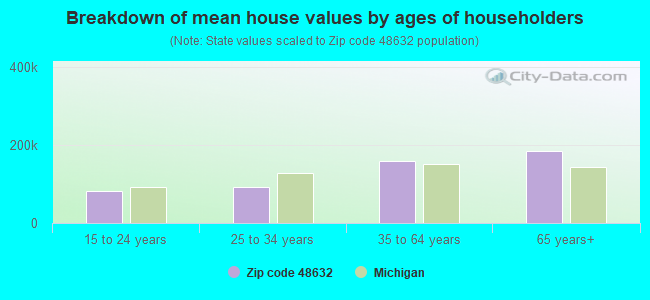
Zip code 48632 compared to state average:
Median house value below state average.
Unemployed percentage above state average.
Black race population percentage significantly below state average.
Median age significantly above state average.
Foreign-born population percentage significantly below state average.
Renting percentage significantly below state average.
Length of stay since moving in significantly above state average.
House age below state average.
Percentage of population with a bachelor's degree or higher below state average.
Averages for the 2020 tax year for zip code 48632, filed in 2021:
Average Adjusted Gross Income (AGI) in 2020: $48,030 (Individual Income Tax Returns)
Here:
$48,030
State:
$68,945
Salary/wage: $37,782 (reported on 65.4% of returns)
Here:
$37,782
State:
$57,142
(% of AGI for various income ranges: 728.1% for AGIs below $25k, 2600.2% for AGIs $25k-50k, 5033.6% for AGIs $50k-75k, 7265.8% for AGIs $75k-100k, 13236.7% for AGIs $100k-200k)
Taxable interest for individuals: $1,867 (reported on 29.5% of returns)
This zip code:
$1,867
Michigan:
$1,630
(% of AGI for various income ranges: 14.5% for AGIs below $25k, 28.2% for AGIs $25k-50k, 40.9% for AGIs $50k-75k, 50.0% for AGIs $75k-100k, 163.3% for AGIs $100k-200k)
Ordinary dividends: $4,488 (reported on 14.1% of returns)
Here:
$4,488
State:
$6,972
(% of AGI for various income ranges: 17.0% for AGIs below $25k, 21.0% for AGIs $25k-50k, 36.8% for AGIs $50k-75k, 98.3% for AGIs $75k-100k, 417.5% for AGIs $100k-200k)
Net capital gain/loss in AGI: +$11,603 (reported on 14.1% of returns)
Here:
+$11,603
State:
+$20,064
(% of AGI for various income ranges: 18.6% for AGIs below $25k, 15.8% for AGIs $25k-50k, 90.0% for AGIs $50k-75k, 273.3% for AGIs $75k-100k, 794.2% for AGIs $100k-200k)
Profit/loss from business: +$8,221 (reported on 12.0% of returns)
Here:
+$8,221
State:
+$11,172
(% of AGI for various income ranges: 69.1% for AGIs below $25k, 125.2% for AGIs $25k-50k, 138.2% for AGIs $50k-75k, 203.3% for AGIs $75k-100k, 542.5% for AGIs $100k-200k)
Taxable individual retirement arrangement distribution: $16,135 (reported on 13.2% of returns)
48632:
$16,135
Michigan:
$19,803
(% of AGI for various income ranges: 73.5% for AGIs below $25k, 163.6% for AGIs $25k-50k, 380.0% for AGIs $50k-75k, 757.5% for AGIs $75k-100k, 1610.0% for AGIs $100k-200k)
Total itemized deductions: $31,180 (reported on 2.1% of returns)
Here:
$31,180
State:
$34,117
(% of AGI for various income ranges: 122.8% for AGIs $25k-50k, 787.5% for AGIs $100k-200k)
Charity contributions: $7,233 (reported on 1.3% of returns)
Here:
$7,233
State:
$13,548
(% of AGI for various income ranges: 180.8% for AGIs $75k-100k)
Taxes paid: $8,775 (reported on 1.7% of returns)
48632:
$8,775
State:
$7,972
(% of AGI for various income ranges: 26.8% for AGIs $25k-50k, 180.8% for AGIs $100k-200k)
Earned income credit: $2,291 (reported on 18.4% of returns)
Here:
$2,291
State:
$2,251
(% of AGI for various income ranges: 80.6% for AGIs below $25k, 85.8% for AGIs $25k-50k)
Percentage of individuals using paid preparers for their 2020 taxes: 94.0%
Here:
94%
State:
93%
(% for various income ranges: 94.7% for AGIs below $25k, 95.3% for AGIs $25k-50k, 93.5% for AGIs $50k-75k, 94.7% for AGIs $75k-100k, 90.5% for AGIs $100k-200k, 75.0% for AGIs over 200k)
Averages for the 2012 tax year for zip code 48632, filed in 2013:
Average Adjusted Gross Income (AGI) in 2012: $35,404 (Individual Income Tax Returns)
Here:
$35,404
State:
$55,609
Salary/wage: $27,456 (reported on 72.6% of returns)
Here:
$27,456
State:
$46,782
(% of AGI for various income ranges: 51.1% for AGIs below $25k, 62.0% for AGIs $25k-50k, 61.5% for AGIs $50k-75k, 56.5% for AGIs $75k-100k, 48.4% for AGIs $100k-200k)
Taxable interest for individuals: $1,008 (reported on 29.4% of returns)
This zip code:
$1,008
Michigan:
$1,491
(% of AGI for various income ranges: 1.2% for AGIs below $25k, 0.9% for AGIs $25k-50k, 0.4% for AGIs $50k-75k, 1.0% for AGIs $75k-100k, 0.8% for AGIs $100k-200k)
Ordinary dividends: $3,390 (reported on 14.4% of returns)
Here:
$3,390
State:
$6,225
(% of AGI for various income ranges: 1.1% for AGIs below $25k, 0.7% for AGIs $25k-50k, 0.4% for AGIs $50k-75k, 1.6% for AGIs $75k-100k, 3.3% for AGIs $100k-200k)
Net capital gain/loss in AGI: +$1,522 (reported on 11.4% of returns)
Here:
+$1,522
State:
+$9,326
(% of AGI for various income ranges: 0.5% for AGIs $25k-50k, 0.6% for AGIs $75k-100k, 1.4% for AGIs $100k-200k)
Profit/loss from business: +$5,900 (reported on 11.9% of returns)
Here:
+$5,900
State:
+$11,523
(% of AGI for various income ranges: 5.1% for AGIs below $25k, 1.8% for AGIs $25k-50k, 3.0% for AGIs $50k-75k, 0.4% for AGIs $75k-100k)
Taxable individual retirement arrangement distribution: $12,533 (reported on 14.9% of returns)
48632:
$12,533
Michigan:
$15,298
(% of AGI for various income ranges: 4.1% for AGIs below $25k, 4.2% for AGIs $25k-50k, 4.7% for AGIs $50k-75k, 5.0% for AGIs $75k-100k, 8.4% for AGIs $100k-200k)
Total itemized deductions: $18,712 (26% of AGI, reported on 16.4% of returns)
Here:
$18,712
State:
$21,628
Here:
26.0% of AGI
State:
18.4% of AGI
(% of AGI for various income ranges: 7.3% for AGIs below $25k, 6.9% for AGIs $25k-50k, 7.1% for AGIs $50k-75k, 9.7% for AGIs $75k-100k, 12.8% for AGIs $100k-200k)
Charity contributions: $2,642 (reported on 11.9% of returns)
Here:
$2,642
State:
$4,225
(% of AGI for various income ranges: 0.4% for AGIs below $25k, 0.4% for AGIs $25k-50k, 0.5% for AGIs $50k-75k, 1.5% for AGIs $75k-100k, 1.9% for AGIs $100k-200k)
Taxes paid: $5,452 (reported on 16.4% of returns)
48632:
$5,452
State:
$8,327
(% of AGI for various income ranges: 1.5% for AGIs below $25k, 1.6% for AGIs $25k-50k, 1.7% for AGIs $50k-75k, 2.9% for AGIs $75k-100k, 5.0% for AGIs $100k-200k)
Earned income credit: $2,070 (reported on 23.4% of returns)
Here:
$2,070
State:
$2,306
(% of AGI for various income ranges: 6.2% for AGIs below $25k, 1.0% for AGIs $25k-50k)
Percentage of individuals using paid preparers for their 2012 taxes: 59.7%
Here:
60%
State:
57%
(% for various income ranges: 57.4% for AGIs below $25k, 60.7% for AGIs $25k-50k, 61.9% for AGIs $50k-75k, 61.5% for AGIs $75k-100k, 70.0% for AGIs $100k-200k)
Averages for the 2004 tax year for zip code 48632, filed in 2005:
Average Adjusted Gross Income (AGI) in 2004: $31,182 (Individual Income Tax Returns)
Here:
$31,182
State:
$48,204
Salary/wage: $24,013 (reported on 79.3% of returns)
Here:
$24,013
State:
$42,791
(% of AGI for various income ranges: 87.8% for AGIs below $10k, 58.6% for AGIs $10k-25k, 64.0% for AGIs $25k-50k, 63.8% for AGIs $50k-75k, 67.7% for AGIs $75k-100k, 44.9% for AGIs over 100k)
Taxable interest for individuals: $1,593 (reported on 42.0% of returns)
This zip code:
$1,593
Michigan:
$1,725
(% of AGI for various income ranges: 4.7% for AGIs below $10k, 2.5% for AGIs $10k-25k, 1.8% for AGIs $25k-50k, 1.9% for AGIs $50k-75k, 0.8% for AGIs $75k-100k, 3.0% for AGIs over 100k)
Taxable dividends: $1,976 (reported on 19.0% of returns)
Here:
$1,976
State:
$3,420
(% of AGI for various income ranges: 2.1% for AGIs below $10k, 1.0% for AGIs $10k-25k, 1.0% for AGIs $25k-50k, 1.4% for AGIs $50k-75k, 0.3% for AGIs $75k-100k, 2.0% for AGIs over 100k)
Net capital gain/loss: +$5,930 (reported on 14.0% of returns)
Here:
+$5,930
State:
+$8,532
(% of AGI for various income ranges: 1.5% for AGIs below $10k, 0.7% for AGIs $10k-25k, 0.5% for AGIs $25k-50k, 1.7% for AGIs $50k-75k, 0.7% for AGIs $75k-100k, 12.0% for AGIs over 100k)
Profit/loss from business: +$4,262 (reported on 15.1% of returns)
Here:
+$4,262
State:
+$9,547
(% of AGI for various income ranges: 10.8% for AGIs below $10k, 3.4% for AGIs $10k-25k, 2.3% for AGIs $25k-50k, 1.6% for AGIs $50k-75k, 0.5% for AGIs $75k-100k)
IRA payment deduction: $2,719 (reported on 1.5% of returns)
48632:
$2,719
Michigan:
$2,875
Total itemized deductions: $14,637 (25% of AGI, reported on 19.1% of returns)
Here:
$14,637
State:
$18,509
Here:
24.6% of AGI
State:
20.7% of AGI
(% of AGI for various income ranges: 10.3% for AGIs below $10k, 6.8% for AGIs $10k-25k, 8.1% for AGIs $25k-50k, 10.5% for AGIs $50k-75k, 11.9% for AGIs $75k-100k, 9.0% for AGIs over 100k)
Charity contributions deductions: $2,072 (3% of AGI, reported on 15.5% of returns)
Here:
$2,072
State:
$3,365
Here:
3.3% of AGI
State:
3.6% of AGI
(% of AGI for various income ranges: 0.4% for AGIs below $10k, 0.5% for AGIs $10k-25k, 0.7% for AGIs $25k-50k, 1.2% for AGIs $50k-75k, 1.7% for AGIs $75k-100k, 1.8% for AGIs over 100k)
Total tax: $3,762 (reported on 70.7% of returns)
48632:
$3,762
State:
$7,691
(% of AGI for various income ranges: 2.9% for AGIs below $10k, 3.5% for AGIs $10k-25k, 6.3% for AGIs $25k-50k, 8.6% for AGIs $50k-75k, 11.2% for AGIs $75k-100k, 18.3% for AGIs over 100k)
Earned income credit: $1,692 (reported on 19.5% of returns)
Here:
$1,692
State:
$1,737
Percentage of individuals using paid preparers for their 2004 taxes: 64.6%
Here:
65%
State:
60%
(% for various income ranges: 58.9% for AGIs below $10k, 63.9% for AGIs $10k-25k, 67.4% for AGIs $25k-50k, 67.9% for AGIs $50k-75k, 67.6% for AGIs $75k-100k, 74.1% for AGIs over 100k)
Likely homosexual households (counted as self-reported same-sex unmarried-partner households)
Lesbian couples: 0.1% of all households
Gay men: 0.0% of all households
Household received Food Stamps/SNAP in the past 12 months: 389 Household did not receive Food Stamps/SNAP in the past 12 months: 1,685
Women who had a birth in the past 12 months: 33 (8 now married, 23 unmarried) Women who did not have a birth in the past 12 months: 862 (394 now married, 466 unmarried)
Housing units in zip code 48632 with a mortgage: 793 (39 second mortgage, 1 home equity loan, 33 both second mortgage and home equity loan) Houses without a mortgage: 11
Median monthly owner costs for units with a mortgage: $1,049 Median monthly owner costs for units without a mortgage: $432
Residents with income below the poverty level in 2022:
This zip code:
21.5%
Whole state:
13.4%
Residents with income below 50% of the poverty level in 2022:
This zip code:
14.5%
Whole state:
6.9%
Median number of rooms in houses and condos:
Here:
5.7
State:
6.5
Median number of rooms in apartments:
Here:
4.3
State:
4.3
Notable locations in this zip code not listed on our city pages
Notable locations in zip code 48632: Lost Lake Camp (A), Temple Forest Campground (B), Camp Neyati (C), Phelps Station (D), Mud Lake State Forest Campground (E), Lincoln Township Fire Department (F), Garfield Township Fire Department (G). Display/hide their locations on the map
Churches in zip code 48632 include: Lake Baptist Church (A), Liberty Baptist Church (B), Bethany Baptist Church (C), David Helm Chapel (D), Rock Lake Christian Assembly (E). Display/hide their locations on the map
Cemeteries: Conley Cemetery (1), Old Township Cemetery (2), Garfield Cemetery (3), Odd Fellows Cemetery (4), Sherman City Cemetery (5), Freeman Cemetery (6), North Brinton Cemetery (7). Display/hide their locations on the map
Lakes: Turbush Lake (A), Twin Lakes (B), Lost Lake (C), Long Lake (D), Pike Lake (E), Littlefield Lake (F), Little Silver Lake (G), Boyles Creek (H). Display/hide their locations on the map
Creeks: Three Lake Creek (A), Halford Creek (B), Tanner Creek (C), Hemlock Creek (D), Sucker Creek (E), Shingle Creek (F), Sherman Creek (G), Delaney Creek (H). Display/hide their locations on the map
Parks in zip code 48632 include: Coldwater Township Park (1), Shingle Lake Park (2), Sherman City Historical Marker (3), Sherman City Union Church Historical Marker (4). Display/hide their locations on the map
Size of family households: 885 2-persons, 166 3-persons, 231 4-persons, 64 5-persons, 42 6-persons, 28 7-or-more-persons
Size of nonfamily households: 561 1-person, 85 2-persons, 5 4-persons
533 married couples with children.
188 single-parent households (65 men, 123 women).
96.9% of residents of 48632 zip code speak English at home.
1.5% of residents speak Spanish at home (74% very well, 8% well, 18% not at all).
1.8% of residents speak other Indo-European language at home (53% very well, 27% well, 20% not well).
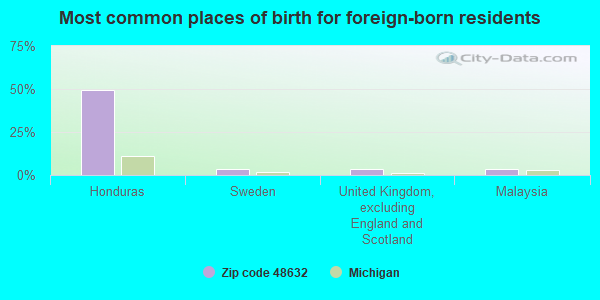
Foreign born population: 88 (1.8%) (44.0% of them are naturalized citizens)
This zip code:
1.8%
Whole state:
6.9%
49%Honduras
3%Sweden
3%United Kingdom, excluding England and Scotland
3%Malaysia
18%English
16%German
9%American
7%Italian
6%Irish
4%Polish
4%European
Year of entry for the foreign-born population
92010 or later
422000 to 2009
141990 to 1999
24Before 1990
Facilities with environmental interests located in this zip code:
BODYWORKZ (7475 W STEVENSON LAKE RD in LAKE, MI)
(Resource Conservation and Recovery Act (tracking hazardous waste)) Organizations: JOHN E. HUBEL (CONTACT/OPERATOR)
GREENSCAPE (8360 W LUDINGTON DR in LAKE, MI)
(Resource Conservation and Recovery Act (tracking hazardous waste)) Organizations: BRIAN CATALDO (CONTACT/OPERATOR)
FARWELL AREA SCHOOLS (SOUTHEAST CORNER OF BIG MUD LA in LAKE, MI)
(Resource Conservation and Recovery Act (tracking hazardous waste)) Alternative names: FARWELL AREA SCHOOLS (E)
Housing units lacking complete plumbing facilities: 1.4% Housing units lacking complete kitchen facilities: 1.4%
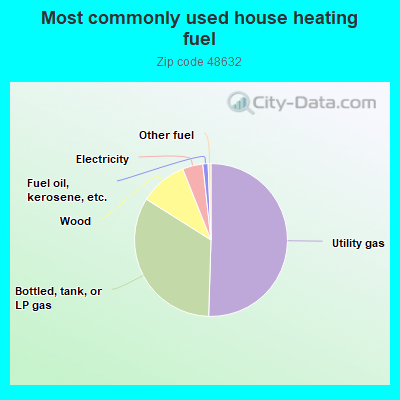
50.4%Utility gas
33.4%Bottled, tank, or LP gas
10.0%Wood
4.3%Electricity
1.1%Fuel oil, kerosene, etc.
0.6%Other fuel
Population in 1990: 7,779.
Place of birth for U.S.-born residents:
This state: 4,229
Northeast: 138
Midwest: 191
South: 235
West: 126
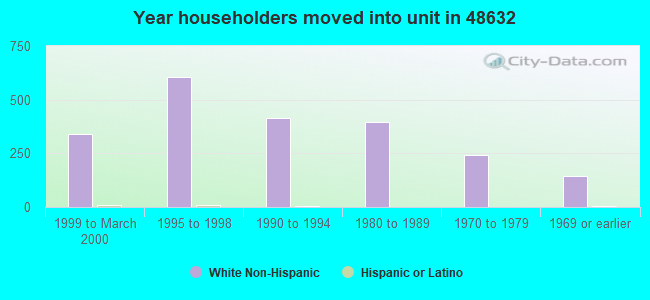
60% of the 48632 zip code residents lived in the same house 5 years ago. Out of people who lived in different houses, 21% lived in this county. Out of people who lived in different counties, 50% lived in Michigan.
91% of the 48632 zip code residents lived in the same house 1 year ago. Out of people who lived in different houses, 22% moved from this county. Out of people who lived in different houses, 55% moved from different county within same state. Out of people who lived in different houses, 18% moved from different state. Out of people who lived in different houses, 7% moved from abroad.
Private vs. public school enrollment:
Students in private schools in grades 1 to 8 (elementary and middle school): 73
Here:
19.1%
Michigan:
12.4%
Students in private schools in grades 9 to 12 (high school): 17
Here:
7.9%
Michigan:
9.8%
Students in private undergraduate colleges: 49
Here:
32.6%
Michigan:
14.9%
Occupation by median earnings in the past 12 months ($)
99,211Architecture and engineering occupations
86,338Computer and mathematical occupations
84,944Arts, design, entertainment, sports, and media occupations
69,381Transportation occupations
65,497Management occupations
57,572Installation, maintenance, and repair occupations
Top industries in this zip code by the number of employees in 2005:
Other Services (except Public Administration): Civic and Social Organizations (5-9 employees: 3 establishments, 1-4 employees: 1 establishment)
Health Care and Social Assistance: Nursing Care Facilities (10-19: 1)
Accommodation and Food Services: Full-Service Restaurants (5-9: 2)
Construction: Site Preparation Contractors (5-9: 1)
Construction: Residential Remodelers (1-4: 3)
Accommodation and Food Services: Recreational and Vacation Camps (except Campgrounds) (1-4: 2)
2002 - 2018 National Fire Incident Reporting System (NFIRS) incidents
According to the data from the years 2002 - 2018 the average number of fire incidents per year is 31. The highest number of fires - 52 took place in 2003, and the least - 7 in 2018. The data has a dropping trend.
When looking into fire subcategories, the most incidents belonged to: Structure Fires (43.6%), and Outside Fires (36.9%).
Fire incident types reported to NFIRS in Zip Code 48632
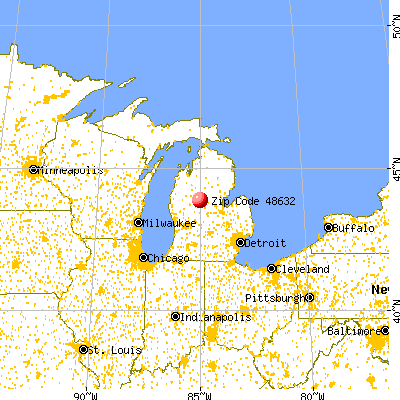


 Nearest zip codes: 48633, 49679, 48622, 49305, 48893, 49631.


 According to the data from the years 2002 - 2018 the average number of fire incidents per year is 31. The highest number of fires - 52 took place in 2003, and the least - 7 in 2018. The data has a dropping trend.
 When looking into fire subcategories, the most incidents belonged to: Structure Fires (43.6%), and Outside Fires (36.9%).