Estimated zip code population in 2022: 5,261 Zip code population in 2010: 5,212 Zip code population in 2000: 4,748
Houses and condos: 2,665 Renter-occupied apartments: 178
% of renters here:
8%
State:
27%
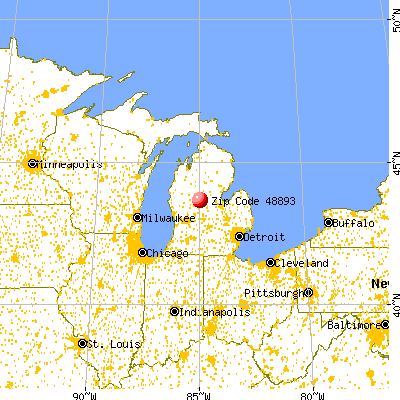
March 2022 cost of living index in zip code 48893: 81.0 (low, U.S. average is 100)
Land area: 51.3 sq. mi. Water area: 2.2 sq. mi.
Population density: 103 people per square mile
(very low).
OSM Map
General Map
Google Map
MSN Map
OSM Map
General Map
Google Map
MSN Map
OSM Map
General Map
Google Map
MSN Map
OSM Map
General Map
Google Map
MSN Map
Please wait while loading the map...
Real estate property taxes paid for housing units in 2022:
This zip code:
0.9% ($1,548)
Michigan:
1.2% ($2,746)
Median real estate property taxes paid for housing units with mortgages in 2022: $1,769 (0.9%) Median real estate property taxes paid for housing units with no mortgage in 2022: $1,360 (1.0%)
Business Search- 14 Million verified businesses
Males: 2,659
(50.5%)
Females: 2,602
(49.5%)
For population 25 years and over in 48893:
High school or higher: 92.6%
Bachelor's degree or higher: 18.1%
Graduate or professional degree: 5.6%
Unemployed: 2.0%
Mean travel time to work (commute): 27.6 minutes
For population 15 years and over in 48893:
Never married: 25.4%
Now married: 54.1%
Separated: 0.2%
Widowed: 7.1%
Divorced: 13.2%
Zip code 48893 compared to state average:
Unemployed percentage below state average.
Black race population percentage significantly below state average.
Hispanic race population percentage significantly below state average.
Median age above state average.
Foreign-born population percentage significantly below state average.
Renting percentage significantly below state average.
Length of stay since moving in significantly above state average.
House age below state average.
Number of college students below state average.
Percentage of population with a bachelor's degree or higher below state average.
Averages for the 2020 tax year for zip code 48893, filed in 2021:
Average Adjusted Gross Income (AGI) in 2020: $58,153 (Individual Income Tax Returns)
Here:
$58,153
State:
$68,945
Salary/wage: $47,423 (reported on 75.9% of returns)
Here:
$47,423
State:
$57,142
(% of AGI for various income ranges: 975.2% for AGIs below $25k, 2849.3% for AGIs $25k-50k, 5433.4% for AGIs $50k-75k, 7660.0% for AGIs $75k-100k, 14253.3% for AGIs $100k-200k)
Taxable interest for individuals: $1,572 (reported on 31.9% of returns)
This zip code:
$1,572
Michigan:
$1,630
(% of AGI for various income ranges: 15.9% for AGIs below $25k, 18.0% for AGIs $25k-50k, 67.6% for AGIs $50k-75k, 92.5% for AGIs $75k-100k, 142.9% for AGIs $100k-200k)
Ordinary dividends: $4,479 (reported on 20.2% of returns)
Here:
$4,479
State:
$6,972
(% of AGI for various income ranges: 26.1% for AGIs below $25k, 29.1% for AGIs $25k-50k, 94.8% for AGIs $50k-75k, 83.0% for AGIs $75k-100k, 365.2% for AGIs $100k-200k)
Net capital gain/loss in AGI: +$7,195 (reported on 16.0% of returns)
Here:
+$7,195
State:
+$20,064
(% of AGI for various income ranges: 7.5% for AGIs below $25k, 31.7% for AGIs $25k-50k, 109.3% for AGIs $50k-75k, 200.0% for AGIs $75k-100k, 495.2% for AGIs $100k-200k)
Profit/loss from business: +$6,675 (reported on 14.0% of returns)
Here:
+$6,675
State:
+$11,172
(% of AGI for various income ranges: 51.4% for AGIs below $25k, 103.0% for AGIs $25k-50k, 127.2% for AGIs $50k-75k, 127.0% for AGIs $75k-100k, 339.0% for AGIs $100k-200k)
Taxable individual retirement arrangement distribution: $15,612 (reported on 13.2% of returns)
48893:
$15,612
Michigan:
$19,803
(% of AGI for various income ranges: 90.7% for AGIs below $25k, 115.7% for AGIs $25k-50k, 330.0% for AGIs $50k-75k, 503.0% for AGIs $75k-100k, 1053.3% for AGIs $100k-200k)
Total itemized deductions: $37,029 (reported on 2.7% of returns)
Here:
$37,029
State:
$34,117
(% of AGI for various income ranges: 134.6% for AGIs $25k-50k, 888.1% for AGIs $100k-200k)
Charity contributions: $12,340 (reported on 1.9% of returns)
Here:
$12,340
State:
$13,548
(% of AGI for various income ranges: 293.8% for AGIs $100k-200k)
Taxes paid: $7,257 (reported on 2.7% of returns)
48893:
$7,257
State:
$7,972
(% of AGI for various income ranges: 23.3% for AGIs $25k-50k, 86.7% for AGIs $100k-200k)
Earned income credit: $2,041 (reported on 14.4% of returns)
Here:
$2,041
State:
$2,251
(% of AGI for various income ranges: 63.6% for AGIs below $25k, 73.9% for AGIs $25k-50k)
Percentage of individuals using paid preparers for their 2020 taxes: 95.3%
Here:
95%
State:
93%
(% for various income ranges: 95.2% for AGIs below $25k, 94.0% for AGIs $25k-50k, 95.0% for AGIs $50k-75k, 96.3% for AGIs $75k-100k, 97.0% for AGIs $100k-200k, 100.0% for AGIs over 200k)
Averages for the 2012 tax year for zip code 48893, filed in 2013:
Average Adjusted Gross Income (AGI) in 2012: $46,200 (Individual Income Tax Returns)
Here:
$46,200
State:
$55,609
Salary/wage: $38,017 (reported on 79.2% of returns)
Here:
$38,017
State:
$46,782
(% of AGI for various income ranges: 67.1% for AGIs below $25k, 69.8% for AGIs $25k-50k, 67.6% for AGIs $50k-75k, 65.9% for AGIs $75k-100k, 67.9% for AGIs $100k-200k, 38.4% for AGIs over 200k)
Taxable interest for individuals: $1,641 (reported on 31.7% of returns)
This zip code:
$1,641
Michigan:
$1,491
(% of AGI for various income ranges: 1.2% for AGIs below $25k, 1.0% for AGIs $25k-50k, 0.7% for AGIs $50k-75k, 1.4% for AGIs $75k-100k, 1.0% for AGIs $100k-200k, 2.0% for AGIs over 200k)
Ordinary dividends: $2,660 (reported on 21.7% of returns)
Here:
$2,660
State:
$6,225
(% of AGI for various income ranges: 1.4% for AGIs below $25k, 1.1% for AGIs $25k-50k, 0.9% for AGIs $50k-75k, 1.6% for AGIs $75k-100k, 1.9% for AGIs $100k-200k)
Net capital gain/loss in AGI: +$4,763 (reported on 14.6% of returns)
Here:
+$4,763
State:
+$9,326
(% of AGI for various income ranges: 0.3% for AGIs $25k-50k, 0.9% for AGIs $50k-75k, 0.7% for AGIs $75k-100k, 5.3% for AGIs $100k-200k)
Profit/loss from business: +$4,613 (reported on 12.9% of returns)
Here:
+$4,613
State:
+$11,523
(% of AGI for various income ranges: 4.0% for AGIs below $25k, 1.8% for AGIs $25k-50k, 0.8% for AGIs $50k-75k, 1.4% for AGIs $75k-100k, 0.4% for AGIs $100k-200k)
Taxable individual retirement arrangement distribution: $11,627 (reported on 12.5% of returns)
48893:
$11,627
Michigan:
$15,298
(% of AGI for various income ranges: 3.3% for AGIs below $25k, 3.2% for AGIs $25k-50k, 3.3% for AGIs $50k-75k, 3.1% for AGIs $75k-100k, 4.2% for AGIs $100k-200k)
Total itemized deductions: $18,071 (21% of AGI, reported on 23.3% of returns)
Here:
$18,071
State:
$21,628
Here:
21.1% of AGI
State:
18.4% of AGI
(% of AGI for various income ranges: 7.4% for AGIs below $25k, 7.3% for AGIs $25k-50k, 8.4% for AGIs $50k-75k, 8.4% for AGIs $75k-100k, 11.8% for AGIs $100k-200k, 11.7% for AGIs over 200k)
Charity contributions: $3,483 (reported on 17.5% of returns)
Here:
$3,483
State:
$4,225
(% of AGI for various income ranges: 0.5% for AGIs below $25k, 0.7% for AGIs $25k-50k, 0.8% for AGIs $50k-75k, 1.2% for AGIs $75k-100k, 1.9% for AGIs $100k-200k, 3.7% for AGIs over 200k)
Taxes paid: $6,138 (reported on 23.3% of returns)
48893:
$6,138
State:
$8,327
(% of AGI for various income ranges: 1.5% for AGIs below $25k, 2.0% for AGIs $25k-50k, 2.5% for AGIs $50k-75k, 3.0% for AGIs $75k-100k, 4.6% for AGIs $100k-200k, 5.6% for AGIs over 200k)
Earned income credit: $2,126 (reported on 17.9% of returns)
Here:
$2,126
State:
$2,306
(% of AGI for various income ranges: 6.4% for AGIs below $25k, 0.8% for AGIs $25k-50k)
Percentage of individuals using paid preparers for their 2012 taxes: 60.4%
Here:
60%
State:
57%
(% for various income ranges: 51.5% for AGIs below $25k, 62.3% for AGIs $25k-50k, 71.8% for AGIs $50k-75k, 71.4% for AGIs $75k-100k, 63.2% for AGIs $100k-200k, 66.7% for AGIs over 200k)
Averages for the 2004 tax year for zip code 48893, filed in 2005:
Average Adjusted Gross Income (AGI) in 2004: $40,904 (Individual Income Tax Returns)
Here:
$40,904
State:
$48,204
Salary/wage: $33,710 (reported on 81.5% of returns)
Here:
$33,710
State:
$42,791
(% of AGI for various income ranges: 84.0% for AGIs below $10k, 67.9% for AGIs $10k-25k, 73.8% for AGIs $25k-50k, 80.1% for AGIs $50k-75k, 67.4% for AGIs $75k-100k, 46.5% for AGIs over 100k)
Taxable interest for individuals: $1,532 (reported on 45.8% of returns)
This zip code:
$1,532
Michigan:
$1,725
(% of AGI for various income ranges: 3.7% for AGIs below $10k, 2.6% for AGIs $10k-25k, 1.3% for AGIs $25k-50k, 1.1% for AGIs $50k-75k, 1.5% for AGIs $75k-100k, 2.2% for AGIs over 100k)
Taxable dividends: $2,203 (reported on 24.5% of returns)
Here:
$2,203
State:
$3,420
(% of AGI for various income ranges: 2.8% for AGIs below $10k, 1.6% for AGIs $10k-25k, 1.2% for AGIs $25k-50k, 1.0% for AGIs $50k-75k, 0.7% for AGIs $75k-100k, 2.0% for AGIs over 100k)
Net capital gain/loss: +$4,416 (reported on 19.2% of returns)
Here:
+$4,416
State:
+$8,532
(% of AGI for various income ranges: -0.4% for AGIs below $10k, 0.8% for AGIs $10k-25k, 1.0% for AGIs $25k-50k, 1.1% for AGIs $50k-75k, 1.9% for AGIs $75k-100k, 4.9% for AGIs over 100k)
Profit/loss from business: +$4,275 (reported on 14.2% of returns)
Here:
+$4,275
State:
+$9,547
(% of AGI for various income ranges: 0.5% for AGIs below $10k, 2.9% for AGIs $10k-25k, 1.2% for AGIs $25k-50k, 0.9% for AGIs $50k-75k, 0.8% for AGIs $75k-100k, 2.3% for AGIs over 100k)
IRA payment deduction: $2,855 (reported on 2.3% of returns)
48893:
$2,855
Michigan:
$2,875
Total itemized deductions: $15,490 (21% of AGI, reported on 28.1% of returns)
Here:
$15,490
State:
$18,509
Here:
21.0% of AGI
State:
20.7% of AGI
(% of AGI for various income ranges: 12.8% for AGIs below $10k, 7.8% for AGIs $10k-25k, 9.4% for AGIs $25k-50k, 11.2% for AGIs $50k-75k, 12.7% for AGIs $75k-100k, 11.1% for AGIs over 100k)
Charity contributions deductions: $2,677 (3% of AGI, reported on 23.3% of returns)
Here:
$2,677
State:
$3,365
Here:
3.4% of AGI
State:
3.6% of AGI
(% of AGI for various income ranges: 0.8% for AGIs below $10k, 1.0% for AGIs $10k-25k, 0.8% for AGIs $25k-50k, 1.1% for AGIs $50k-75k, 1.7% for AGIs $75k-100k, 2.8% for AGIs over 100k)
Total tax: $5,619 (reported on 73.3% of returns)
48893:
$5,619
State:
$7,691
(% of AGI for various income ranges: 2.2% for AGIs below $10k, 3.6% for AGIs $10k-25k, 6.2% for AGIs $25k-50k, 8.1% for AGIs $50k-75k, 10.1% for AGIs $75k-100k, 19.3% for AGIs over 100k)
Earned income credit: $1,707 (reported on 15.1% of returns)
Here:
$1,707
State:
$1,737
Percentage of individuals using paid preparers for their 2004 taxes: 63.4%
Here:
63%
State:
60%
(% for various income ranges: 53.6% for AGIs below $10k, 64.8% for AGIs $10k-25k, 63.1% for AGIs $25k-50k, 65.0% for AGIs $50k-75k, 72.2% for AGIs $75k-100k, 77.1% for AGIs over 100k)
Likely homosexual households (counted as self-reported same-sex unmarried-partner households)
Lesbian couples: 0.1% of all households
Gay men: 0.0% of all households
Household received Food Stamps/SNAP in the past 12 months: 278 Household did not receive Food Stamps/SNAP in the past 12 months: 1,838
Women who had a birth in the past 12 months: 21 (21 now married, 0 unmarried) Women who did not have a birth in the past 12 months: 781 (392 now married, 387 unmarried)
Housing units in zip code 48893 with a mortgage: 1,010 (84 second mortgage, 6 home equity loan, 68 both second mortgage and home equity loan) Houses without a mortgage: 25
Median monthly owner costs for units with a mortgage: $1,150 Median monthly owner costs for units without a mortgage: $450
Residents with income below the poverty level in 2022:
This zip code:
15.3%
Whole state:
13.4%
Residents with income below 50% of the poverty level in 2022:
This zip code:
12.1%
Whole state:
6.9%
Median number of rooms in houses and condos:
Here:
6.6
State:
6.5
Median number of rooms in apartments:
Here:
4.5
State:
4.3
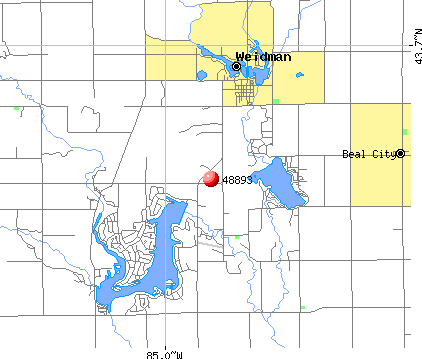
Notable locations in this zip code not listed on our city pages
Notable locations in zip code 48893: Gammy Woods Campground (A), Pines Golf Course (B), Weidman Public Library (C), Nottawa / Sherman Township Fire Department (D). Display/hide their locations on the map
Churches in zip code 48893 include: Weidman United Methodist Church (A), Weidman Baptist Church (B), Forest Hill Church (C), Weidman Church (D). Display/hide their locations on the map
Lakes and reservoirs: Riley Lake (A), Long Lake (B), Perch Lake (C), Hoffman Lake (D), Coldwater Lake (E), Sister Lakes (F), Scott Lake (G), Rounds Lake (H). Display/hide their locations on the map
In group quarters: 24 (-1 institutionalized population)
Size of family households: 776 2-persons, 207 3-persons, 212 4-persons, 133 5-persons, 110 6-persons, 38 7-or-more-persons
Size of nonfamily households: 542 1-person, 91 2-persons, 3 4-persons
642 married couples with children.
188 single-parent households (122 men, 66 women).
98.4% of residents of 48893 zip code speak English at home.
0.6% of residents speak Spanish at home (100% very well).
0.3% of residents speak other Indo-European language at home (85% very well, 15% well).
0.8% of residents speak Asian or Pacific Island language at home (100% very well).
0.1% of residents speak other language at home (100% very well).
Foreign born population: 46 (0.9%) (91.7% of them are naturalized citizens)
This zip code:
0.9%
Whole state:
6.9%
57%Malaysia
17%Barbados
13%Germany
7%India
2%France
30%German
12%American
11%French
11%English
7%Irish
3%European
2%Polish
Year of entry for the foreign-born population
02010 or later
32000 to 2009
01990 to 1999
45Before 1990
Facilities with environmental interests located in this zip code:
ANR PIPELINE COMPANY COLDWATER DEHY PLANT (10550 COLEMAN ROAD in WEIDMAN, MI)
CRITERIA AND HAZARDOUS AIR POLLUTANT INVENTORY (Inventory of air pollution sources) Business SIC classification: NATURAL GAS TRANSMISSION
Housing units lacking complete plumbing facilities: 0.2% Housing units lacking complete kitchen facilities: 0.6%
57.2%Utility gas
20.5%Bottled, tank, or LP gas
11.1%Wood
5.3%Electricity
3.0%Other fuel
2.6%Fuel oil, kerosene, etc.
Population in 1990: 708. Population change in the 1990s: +4,040 (+570.6%).
Place of birth for U.S.-born residents:
This state: 4,708
Northeast: 54
Midwest: 148
South: 190
West: 98
60% of the 48893 zip code residents lived in the same house 5 years ago. Out of people who lived in different houses, 56% lived in this county. Out of people who lived in different counties, 50% lived in Michigan.
91% of the 48893 zip code residents lived in the same house 1 year ago. Out of people who lived in different houses, 16% moved from this county. Out of people who lived in different houses, 55% moved from different county within same state. Out of people who lived in different houses, 26% moved from different state. Out of people who lived in different houses, 6% moved from abroad.
Private vs. public school enrollment:
Students in private schools in grades 1 to 8 (elementary and middle school): 33
Here:
5.3%
Michigan:
12.4%
Students in private schools in grades 9 to 12 (high school): 4
Here:
1.5%
Michigan:
9.8%
Students in private undergraduate colleges:
Here:
0.0%
Michigan:
14.9%
Occupation by median earnings in the past 12 months ($)
124,950Arts, design, entertainment, sports, and media occupations
72,265Health diagnosing and treating practitioners and other technical occupations
62,307Business and financial operations occupations
55,220Installation, maintenance, and repair occupations
51,390Management occupations
51,175Transportation occupations
Top industries in this zip code by the number of employees in 2005:
Other Services (except Public Administration): Religious Organizations (20-49: 1, 5-9: 1)
Construction: New Single-Family Housing Construction (except Operative Builders) (10-19: 1, 1-4: 10)
Finance and Insurance: Real Estate Credit (20-49: 1)
People in group quarters in 2010:
19 people in group homes intended for adults
People in group quarters in 2000:
9 people in homes for the mentally retarded
7 people in unknown juvenile institutions
5 people in other group homes
3 people in agriculture workers' dormitories on farms
2 people in other noninstitutional group quarters
2002 - 2018 National Fire Incident Reporting System (NFIRS) incidents
Based on the data from the years 2002 - 2018 the average number of fires per year is 25. The highest number of fire incidents - 45 took place in 2015, and the least - 12 in 2013. The data has a decreasing trend.
When looking into fire subcategories, the most reports belonged to: Structure Fires (55.3%), and Outside Fires (25.1%).
Fire incident types reported to NFIRS in Zip Code 48893


 Nearest zip codes: 49340, 48632, 48896, 48622, 49310, 49305.


 Based on the data from the years 2002 - 2018 the average number of fires per year is 25. The highest number of fire incidents - 45 took place in 2015, and the least - 12 in 2013. The data has a decreasing trend.
 When looking into fire subcategories, the most reports belonged to: Structure Fires (55.3%), and Outside Fires (25.1%).