Estimated zip code population in 2022: 9,861 Zip code population in 2010: 10,293 Zip code population in 2000: 10,087
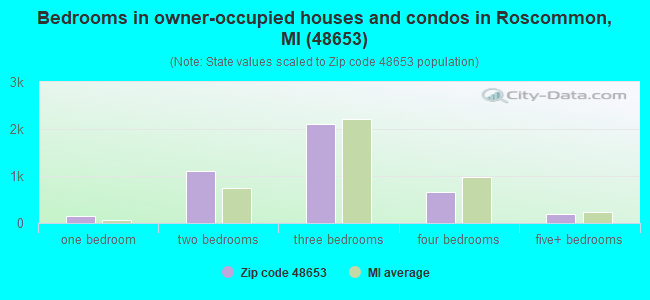
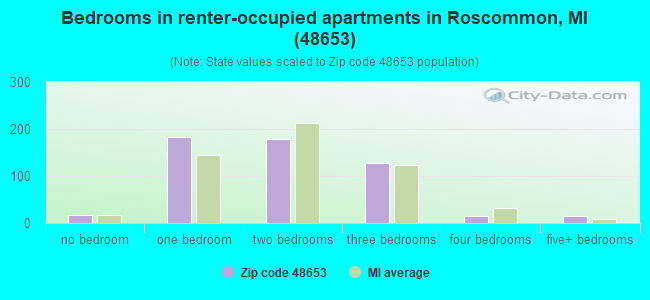
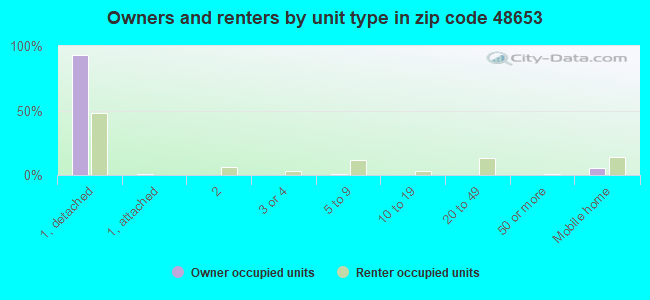
Houses and condos: 9,798 Renter-occupied apartments: 534
% of renters here:
11%
State:
27%
March 2022 cost of living index in zip code 48653: 80.6 (low, U.S. average is 100)
Land area: 251.6 sq. mi. Water area: 19.4 sq. mi.
Population density: 39 people per square mile
(very low).
OSM Map
General Map
Google Map
MSN Map
OSM Map
General Map
Google Map
MSN Map
OSM Map
General Map
Google Map
MSN Map
OSM Map
General Map
Google Map
MSN Map
Please wait while loading the map...
Real estate property taxes paid for housing units in 2022:
This zip code:
1.0% ($1,635)
Michigan:
1.2% ($2,746)
Median real estate property taxes paid for housing units with mortgages in 2022: $1,720 (1.0%) Median real estate property taxes paid for housing units with no mortgage in 2022: $1,544 (1.1%)
Averages for the 2020 tax year for zip code 48653, filed in 2021:
Average Adjusted Gross Income (AGI) in 2020: $56,194 (Individual Income Tax Returns)
Here:
$56,194
State:
$68,945
Salary/wage: $44,660 (reported on 65.8% of returns)
Here:
$44,660
State:
$57,142
(% of AGI for various income ranges: 837.7% for AGIs below $25k, 2714.7% for AGIs $25k-50k, 5139.2% for AGIs $50k-75k, 7503.6% for AGIs $75k-100k, 13539.0% for AGIs $100k-200k, 103815.0% for AGIs over 200k)
Taxable interest for individuals: $1,195 (reported on 35.0% of returns)
This zip code:
$1,195
Michigan:
$1,630
(% of AGI for various income ranges: 23.8% for AGIs below $25k, 23.2% for AGIs $25k-50k, 67.8% for AGIs $50k-75k, 75.7% for AGIs $75k-100k, 157.1% for AGIs $100k-200k, 2615.0% for AGIs over 200k)
Ordinary dividends: $4,727 (reported on 19.0% of returns)
Here:
$4,727
State:
$6,972
(% of AGI for various income ranges: 33.1% for AGIs below $25k, 48.9% for AGIs $25k-50k, 108.8% for AGIs $50k-75k, 222.5% for AGIs $75k-100k, 347.4% for AGIs $100k-200k, 6635.0% for AGIs over 200k)
Net capital gain/loss in AGI: +$10,384 (reported on 17.4% of returns)
Here:
+$10,384
State:
+$20,064
(% of AGI for various income ranges: 3.1% for AGIs below $25k, 35.8% for AGIs $25k-50k, 101.0% for AGIs $50k-75k, 303.2% for AGIs $75k-100k, 746.8% for AGIs $100k-200k, 23990.0% for AGIs over 200k)
Profit/loss from business: +$11,585 (reported on 12.1% of returns)
Here:
+$11,585
State:
+$11,172
(% of AGI for various income ranges: 90.9% for AGIs below $25k, 162.5% for AGIs $25k-50k, 170.0% for AGIs $50k-75k, 253.9% for AGIs $75k-100k, 496.8% for AGIs $100k-200k, 5975.0% for AGIs over 200k)
Taxable individual retirement arrangement distribution: $18,359 (reported on 15.5% of returns)
48653:
$18,359
Michigan:
$19,803
(% of AGI for various income ranges: 100.1% for AGIs below $25k, 183.5% for AGIs $25k-50k, 405.3% for AGIs $50k-75k, 705.0% for AGIs $75k-100k, 1521.9% for AGIs $100k-200k, 12085.0% for AGIs over 200k)
Total itemized deductions: $30,394 (reported on 3.5% of returns)
Here:
$30,394
State:
$34,117
(% of AGI for various income ranges: 103.9% for AGIs $25k-50k, 214.1% for AGIs $50k-75k, 243.2% for AGIs $75k-100k, 475.8% for AGIs $100k-200k, 4980.0% for AGIs over 200k)
Charity contributions: $5,808 (reported on 2.7% of returns)
Here:
$5,808
State:
$13,548
(% of AGI for various income ranges: 10.0% for AGIs $25k-50k, 14.5% for AGIs $50k-75k, 36.1% for AGIs $75k-100k, 90.3% for AGIs $100k-200k, 1050.0% for AGIs over 200k)
Taxes paid: $6,871 (reported on 3.5% of returns)
48653:
$6,871
State:
$7,972
(% of AGI for various income ranges: 20.9% for AGIs $25k-50k, 34.5% for AGIs $50k-75k, 63.9% for AGIs $75k-100k, 116.1% for AGIs $100k-200k, 1330.0% for AGIs over 200k)
Earned income credit: $2,102 (reported on 13.3% of returns)
Here:
$2,102
State:
$2,251
(% of AGI for various income ranges: 68.6% for AGIs below $25k, 62.0% for AGIs $25k-50k)
Percentage of individuals using paid preparers for their 2020 taxes: 92.0%
Here:
92%
State:
93%
(% for various income ranges: 90.6% for AGIs below $25k, 92.7% for AGIs $25k-50k, 91.9% for AGIs $50k-75k, 93.2% for AGIs $75k-100k, 92.7% for AGIs $100k-200k, 100.0% for AGIs over 200k)
Averages for the 2012 tax year for zip code 48653, filed in 2013:
Average Adjusted Gross Income (AGI) in 2012: $44,016 (Individual Income Tax Returns)
Here:
$44,016
State:
$55,609
Salary/wage: $34,200 (reported on 71.8% of returns)
Here:
$34,200
State:
$46,782
(% of AGI for various income ranges: 52.2% for AGIs below $25k, 56.0% for AGIs $25k-50k, 58.9% for AGIs $50k-75k, 56.1% for AGIs $75k-100k, 57.6% for AGIs $100k-200k, 51.2% for AGIs over 200k)
Taxable interest for individuals: $1,356 (reported on 40.9% of returns)
This zip code:
$1,356
Michigan:
$1,491
(% of AGI for various income ranges: 1.7% for AGIs below $25k, 1.4% for AGIs $25k-50k, 1.0% for AGIs $50k-75k, 0.8% for AGIs $75k-100k, 1.2% for AGIs $100k-200k, 1.6% for AGIs over 200k)
Ordinary dividends: $3,806 (reported on 21.9% of returns)
Here:
$3,806
State:
$6,225
(% of AGI for various income ranges: 1.9% for AGIs below $25k, 1.5% for AGIs $25k-50k, 1.4% for AGIs $50k-75k, 1.6% for AGIs $75k-100k, 2.2% for AGIs $100k-200k, 3.2% for AGIs over 200k)
Net capital gain/loss in AGI: +$6,495 (reported on 17.4% of returns)
Here:
+$6,495
State:
+$9,326
(% of AGI for various income ranges: 0.3% for AGIs $50k-75k, 0.9% for AGIs $75k-100k, 2.7% for AGIs $100k-200k, 14.1% for AGIs over 200k)
Profit/loss from business: +$8,788 (reported on 13.5% of returns)
Here:
+$8,788
State:
+$11,523
(% of AGI for various income ranges: 6.2% for AGIs below $25k, 1.8% for AGIs $25k-50k, 2.9% for AGIs $50k-75k, 2.5% for AGIs $75k-100k, 1.3% for AGIs $100k-200k, 2.9% for AGIs over 200k)
Taxable individual retirement arrangement distribution: $11,812 (reported on 16.9% of returns)
48653:
$11,812
Michigan:
$15,298
(% of AGI for various income ranges: 5.4% for AGIs below $25k, 5.3% for AGIs $25k-50k, 4.0% for AGIs $50k-75k, 5.0% for AGIs $75k-100k, 6.7% for AGIs $100k-200k)
Total itemized deductions: $19,298 (22% of AGI, reported on 24.2% of returns)
Here:
$19,298
State:
$21,628
Here:
22.2% of AGI
State:
18.4% of AGI
(% of AGI for various income ranges: 10.4% for AGIs below $25k, 9.2% for AGIs $25k-50k, 9.4% for AGIs $50k-75k, 11.8% for AGIs $75k-100k, 12.8% for AGIs $100k-200k, 10.0% for AGIs over 200k)
Charity contributions: $2,794 (reported on 18.3% of returns)
Here:
$2,794
State:
$4,225
(% of AGI for various income ranges: 0.8% for AGIs below $25k, 1.0% for AGIs $25k-50k, 1.0% for AGIs $50k-75k, 1.4% for AGIs $75k-100k, 1.5% for AGIs $100k-200k, 1.1% for AGIs over 200k)
Taxes paid: $6,759 (reported on 23.9% of returns)
48653:
$6,759
State:
$8,327
(% of AGI for various income ranges: 2.1% for AGIs below $25k, 2.2% for AGIs $25k-50k, 2.8% for AGIs $50k-75k, 4.2% for AGIs $75k-100k, 4.9% for AGIs $100k-200k, 6.2% for AGIs over 200k)
Earned income credit: $2,042 (reported on 16.5% of returns)
Here:
$2,042
State:
$2,306
(% of AGI for various income ranges: 5.0% for AGIs below $25k, 0.8% for AGIs $25k-50k)
Percentage of individuals using paid preparers for their 2012 taxes: 58.0%
Here:
58%
State:
57%
(% for various income ranges: 53.7% for AGIs below $25k, 60.0% for AGIs $25k-50k, 59.7% for AGIs $50k-75k, 63.9% for AGIs $75k-100k, 65.5% for AGIs $100k-200k, 83.3% for AGIs over 200k)
Averages for the 2004 tax year for zip code 48653, filed in 2005:
Average Adjusted Gross Income (AGI) in 2004: $34,849 (Individual Income Tax Returns)
Here:
$34,849
State:
$48,204
Salary/wage: $28,312 (reported on 76.1% of returns)
Here:
$28,312
State:
$42,791
(% of AGI for various income ranges: 105.5% for AGIs below $10k, 53.7% for AGIs $10k-25k, 61.0% for AGIs $25k-50k, 66.5% for AGIs $50k-75k, 64.0% for AGIs $75k-100k, 56.6% for AGIs over 100k)
Taxable interest for individuals: $1,563 (reported on 52.4% of returns)
This zip code:
$1,563
Michigan:
$1,725
(% of AGI for various income ranges: 8.5% for AGIs below $10k, 3.8% for AGIs $10k-25k, 2.1% for AGIs $25k-50k, 2.1% for AGIs $50k-75k, 1.7% for AGIs $75k-100k, 1.9% for AGIs over 100k)
Taxable dividends: $2,764 (reported on 26.2% of returns)
Here:
$2,764
State:
$3,420
(% of AGI for various income ranges: 4.9% for AGIs below $10k, 2.2% for AGIs $10k-25k, 1.6% for AGIs $25k-50k, 1.6% for AGIs $50k-75k, 2.7% for AGIs $75k-100k, 2.4% for AGIs over 100k)
Net capital gain/loss: +$3,923 (reported on 20.7% of returns)
Here:
+$3,923
State:
+$8,532
(% of AGI for various income ranges: -3.3% for AGIs below $10k, -0.9% for AGIs $10k-25k, 0.7% for AGIs $25k-50k, 1.5% for AGIs $50k-75k, 1.6% for AGIs $75k-100k, 8.6% for AGIs over 100k)
Profit/loss from business: +$5,578 (reported on 14.6% of returns)
Here:
+$5,578
State:
+$9,547
(% of AGI for various income ranges: -9.4% for AGIs below $10k, 4.7% for AGIs $10k-25k, 2.4% for AGIs $25k-50k, 0.9% for AGIs $50k-75k, 2.9% for AGIs $75k-100k, 3.2% for AGIs over 100k)
IRA payment deduction: $2,641 (reported on 2.0% of returns)
48653:
$2,641
Michigan:
$2,875
(% of AGI for various income ranges: 0.2% for AGIs $10k-25k, 0.2% for AGIs $25k-50k, 0.2% for AGIs $50k-75k, 0.1% for AGIs over 100k)
Total itemized deductions: $15,801 (25% of AGI, reported on 26.2% of returns)
Here:
$15,801
State:
$18,509
Here:
24.5% of AGI
State:
20.7% of AGI
(% of AGI for various income ranges: 18.0% for AGIs below $10k, 11.3% for AGIs $10k-25k, 11.3% for AGIs $25k-50k, 10.9% for AGIs $50k-75k, 13.7% for AGIs $75k-100k, 12.2% for AGIs over 100k)
Charity contributions deductions: $2,293 (3% of AGI, reported on 22.2% of returns)
Here:
$2,293
State:
$3,365
Here:
3.4% of AGI
State:
3.6% of AGI
(% of AGI for various income ranges: 0.8% for AGIs below $10k, 1.0% for AGIs $10k-25k, 1.3% for AGIs $25k-50k, 1.3% for AGIs $50k-75k, 2.3% for AGIs $75k-100k, 1.6% for AGIs over 100k)
Total tax: $4,597 (reported on 70.7% of returns)
48653:
$4,597
State:
$7,691
(% of AGI for various income ranges: 2.8% for AGIs below $10k, 3.4% for AGIs $10k-25k, 6.4% for AGIs $25k-50k, 8.6% for AGIs $50k-75k, 10.8% for AGIs $75k-100k, 17.5% for AGIs over 100k)
Earned income credit: $1,601 (reported on 14.8% of returns)
Here:
$1,601
State:
$1,737
Percentage of individuals using paid preparers for their 2004 taxes: 61.8%
Here:
62%
State:
60%
(% for various income ranges: 53.6% for AGIs below $10k, 62.0% for AGIs $10k-25k, 64.6% for AGIs $25k-50k, 65.1% for AGIs $50k-75k, 65.7% for AGIs $75k-100k, 72.7% for AGIs over 100k)
Likely homosexual households (counted as self-reported same-sex unmarried-partner households)
Lesbian couples: 0.2% of all households
Gay men: 0.0% of all households
Household received Food Stamps/SNAP in the past 12 months: 612 Household did not receive Food Stamps/SNAP in the past 12 months: 4,117
Women who had a birth in the past 12 months: 60 (53 now married, 7 unmarried) Women who did not have a birth in the past 12 months: 1,406 (731 now married, 671 unmarried)
Housing units in zip code 48653 with a mortgage: 2,214 (166 second mortgage, 156 both second mortgage and home equity loan) Houses without a mortgage: 32
Median monthly owner costs for units with a mortgage: $1,095 Median monthly owner costs for units without a mortgage: $411
Residents with income below the poverty level in 2022:
This zip code:
11.2%
Whole state:
13.4%
Residents with income below 50% of the poverty level in 2022:
This zip code:
5.2%
Whole state:
6.9%
Median number of rooms in houses and condos:
Here:
5.9
State:
6.5
Median number of rooms in apartments:
Here:
4.0
State:
4.3
Notable locations in this zip code not listed on our city pages
Notable locations in zip code 48653: Bell Top Lodge (A), Leykaufs Cabins (B), Forest Dunes Golf Club (C), Kefalake Camp (D), Pere Cheney Station (E), Northern Block and Supply Company (F), Moore Station (G), Higgin Hills RV Park (H), Houghton Lake State Game Farm (I), Great Circle Campground (J), Roscommon Station (K), North Higgins Lake State Park West Campground (L), North Higgins Lake State Park East Campground (M), South Higgns Lake State Park West Campground (N), South Higgins Lake State Park East Campground (O), Burning Oak Country Club (P), Ye Olde Country Club (Q), Higgins Lake Campground (R), Nine Mile Hill Rest Area (S), Higgins Lake Rest Area (T). Display/hide their locations on the map
Churches in zip code 48653 include: Gerrish Church (A), Saint Huberts Church (B), South Branch Church (C), Higgins Lake Baptist Church (D), Church of Jesus Christ of Latter Day Saints (E), Immanuel Baptist Church (F), Good Shepherd United Methodist Church (G), Saint Martin Lutheran Church (H), Roscommon Baptist Church (I). Display/hide their locations on the map
Cemeteries: Markey Cemetery (1), Cheney Cemetery (2), Oakwood Cemetery (3), Heidemann Cemetery (4), Gerrish Township Cemetery (5), Higgins Township Cemetery (6), Richfield Cemetery (7). Display/hide their locations on the map
Lakes, reservoirs, and swamps: Marl Lake (A), Hiscock Lake (B), Hunters Lake (C), Kellogg Lake (D), Mud Lake (E), Higgins Lake (F), West Lake (G), Bambi Lake (H). Display/hide their locations on the map
Streams, rivers, and creeks: Asum Creek (A), Beaver Creek (B), Big Creek (C), The Cut (D), Thayer Creek (E), Hickey Creek (F), Hudson Creek (G), Sauger Creek (H), Robinson Creek (I). Display/hide their locations on the map
Parks in zip code 48653 include: Lyon Township Park (1), North Higgins Lake State Park (2), Marguerite Gahagan Nature Preserve (3), Pioneer House Historical Marker (4), Terney House Historical Marker (5), Gerrish Historical Marker (6), American Legion Park (7), Backus Creek State Game Area (8), South Higgins Lake State Park (9). Display/hide their locations on the map
In group quarters: 123 (-1 institutionalized population)
Size of family households: 1,955 2-persons, 425 3-persons, 419 4-persons, 48 5-persons, 38 6-persons, 35 7-or-more-persons
Size of nonfamily households: 1,646 1-person, 182 2-persons, 5 3-persons
1,018 married couples with children.
271 single-parent households (84 men, 187 women).
99.4% of residents of 48653 zip code speak English at home.
0.2% of residents speak Spanish at home (60% very well, 40% not well).
0.6% of residents speak other Indo-European language at home (91% very well, 2% well, 7% not well).
0.3% of residents speak Asian or Pacific Island language at home (17% very well, 83% not well).
0.1% of residents speak other language at home (100% very well).
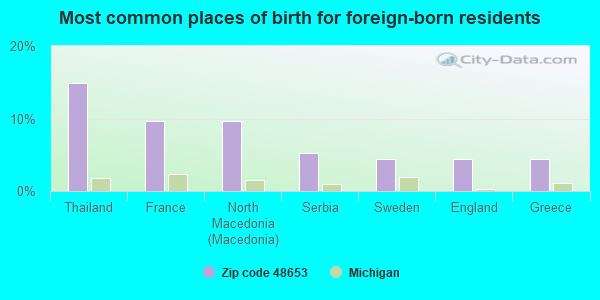
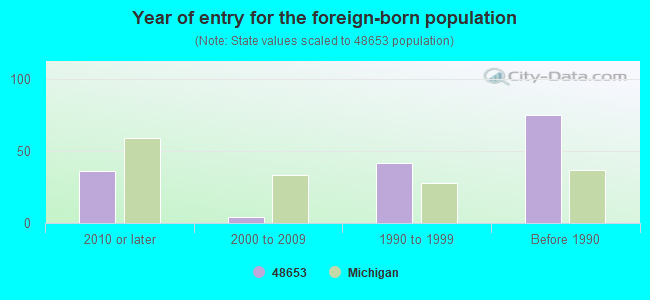
Foreign born population: 135 (1.4%) (74.9% of them are naturalized citizens)
This zip code:
1.4%
Whole state:
6.9%
15%Thailand
10%France
10%North Macedonia (Macedonia)
5%Serbia
4%Sweden
4%England
4%Greece
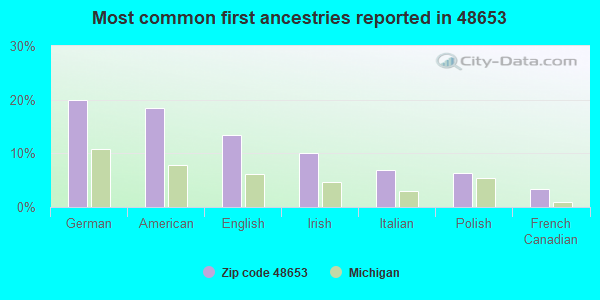
20%German
18%American
13%English
10%Irish
7%Italian
6%Polish
3%French Canadian
Year of entry for the foreign-born population
362010 or later
42000 to 2009
421990 to 1999
75Before 1990
Major facilities with environmental interests located in this zip code:
MI DEPT/TRANSPORTATION BRIDGE (US-27 UNDER MILITARY RD in ROSCOMMON, MI)
(Resource Conservation and Recovery Act (tracking hazardous waste)) Organizations: MICH DEPT OF TRANSPORTATION (CONTACT/OPERATOR)
Alternative names: MIDOT BRIDGE US-27 UNDER MILITARY RD
FICK CF AND SONS THE SUNNY SPOT (308 N 5TH ST in ROSCOMMON, MI)
(Resource Conservation and Recovery Act (tracking hazardous waste)) Organizations: FICK CHARLES F (CONTACT/OWNER)
DTE ENERGY/MICHCON (CO RD 100 1PT 5MI W M18 in ROSCOMMON, MI)
(Resource Conservation and Recovery Act (tracking hazardous waste)) Organizations: MICHIGAN CONSOLIDATED GAS CO (CONTACT/OWNER)
Alternative names: MICHCON ROSCOMMON GATE
EVERGREEN PARK GROCERY INC (9961 E HIGGINS LAKE DR in ROSCOMMON, MI)
(Resource Conservation and Recovery Act (tracking hazardous waste))
BIG MACS MARKET (9953 W HIGGINS LAKE DR in ROSCOMMON, MI)
(Resource Conservation and Recovery Act (tracking hazardous waste))
MI DEPT/NATURAL RESOURCES (11543 N MAIN ST in ROSCOMMON, MI)
(Resource Conservation and Recovery Act (tracking hazardous waste)) Alternative names: MIDNR BARBIER BULK OIL
Housing units lacking complete plumbing facilities: 2.3% Housing units lacking complete kitchen facilities: 2.5%
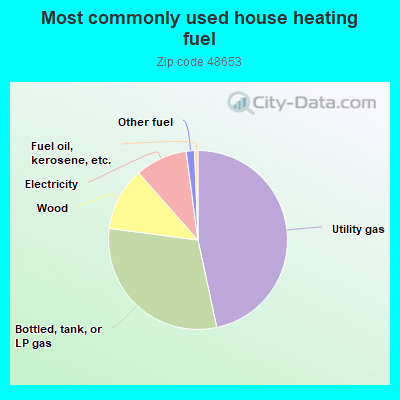
46.6%Utility gas
30.4%Bottled, tank, or LP gas
11.4%Wood
9.4%Electricity
1.5%Other fuel
0.6%Fuel oil, kerosene, etc.
Population in 1990: 8,311. Population change in the 1990s: +1,776 (+21.4%).
Place of birth for U.S.-born residents:
This state: 8,327
Northeast: 203
Midwest: 551
South: 385
West: 225
60% of the 48653 zip code residents lived in the same house 5 years ago. Out of people who lived in different houses, 32% lived in this county. Out of people who lived in different counties, 50% lived in Michigan.
89% of the 48653 zip code residents lived in the same house 1 year ago. Out of people who lived in different houses, 22% moved from this county. Out of people who lived in different houses, 57% moved from different county within same state. Out of people who lived in different houses, 17% moved from different state. Out of people who lived in different houses, 5% moved from abroad.
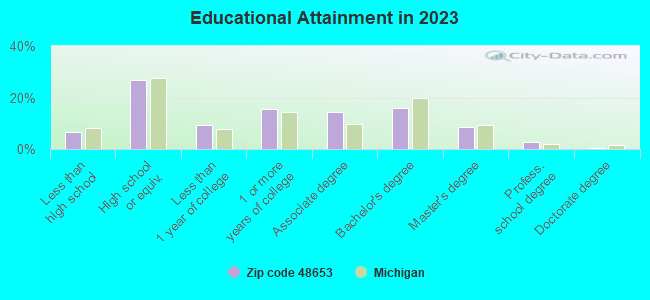
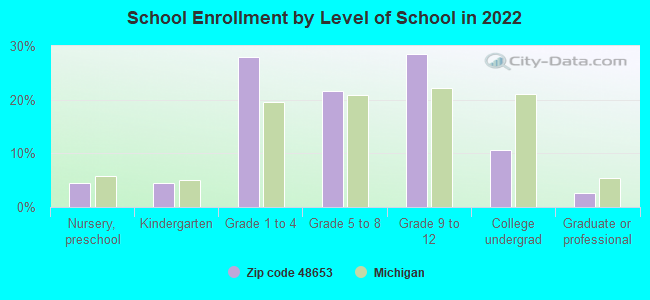
Private vs. public school enrollment:
Students in private schools in grades 1 to 8 (elementary and middle school): 199
Here:
32.1%
Michigan:
12.4%
Students in private schools in grades 9 to 12 (high school): 27
Here:
7.7%
Michigan:
9.8%
Students in private undergraduate colleges: 15
Here:
11.6%
Michigan:
14.9%
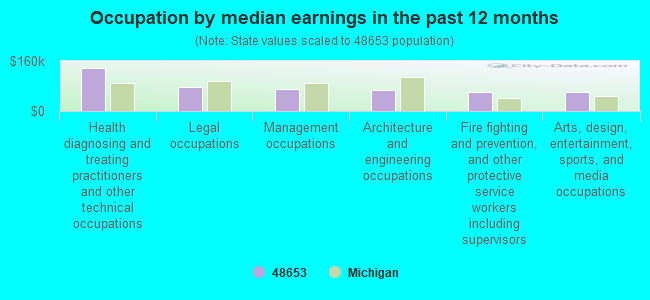
Occupation by median earnings in the past 12 months ($)
137,457Health diagnosing and treating practitioners and other technical occupations
77,099Legal occupations
70,399Management occupations
66,094Architecture and engineering occupations
60,819Fire fighting and prevention, and other protective service workers including supervisors
60,357Arts, design, entertainment, sports, and media occupations
Companies with federal contracts located in this zip code (ROSCOMMON, MI):
NORTHERN MICHIGAN ENTERPRISES (115 RED ARROW TRL; small business) : $182,000 in 12 contractsfrom 2000 to 2006
Contracts for Other Housekeeping Services, Food Services, Badges and Insignia, Custodial Janitorial Services by Army Signed by year:2000: $50,000; 2001: $30,000; 2002: $10,500; 2003: $10,800; 2004: $22,000; 2005: $46,000; 2006: $12,700.
Biggest contracts:
$50,000 with Army for Other Housekeeping Services. Signed on 2000-07-07. Completion date: 2000-08-05.
$30,000 with Army for Food Services. Signed on 2001-05-24. Completion date: 2001-07-28.
$12,000 with Army for Badges and Insignia. Signed on 2006-06-01. Completion date: 2006-06-23.
$11,500 with Army for Other Housekeeping Services. Signed on 2005-05-11. Completion date: 2005-06-25.
TIME EMERGENCEY EQUIPMENT L L (2415 WEST SUNSET DR; small business)
$15,886 with Army for Safety and Rescue Equipment. Signed on 2003-12-22. Completion date: 2004-01-30.
C&S SECURITY INC (134 SURFSIDE DRIVE)
$15,885 with Bureau of Prisoners/Federal Prison System for Hardware, Commercial. Taking place in CA. Signed on 2005-06-27. Completion date: 2005-07-27.
TIME EMERGENCY EQUIPMENT INC (2415 W SUNSET DR; small business)
$3,972 with Army for Chain and Wire Rope. Signed on 2006-05-12. Completion date: 2006-05-19.
Top industries in this zip code by the number of employees in 2005:
Health Care and Social Assistance: Nursing Care Facilities (50-99 employees: 2 establishments)
Accommodation and Food Services: Limited-Service Restaurants (20-49: 3, 10-19: 1)
Other Services (except Public Administration): Religious Organizations (5-9: 5, 1-4: 5)
Construction: New Single-Family Housing Construction (except Operative Builders) (10-19: 1, 5-9: 2, 1-4: 8)
Health Care and Social Assistance: Child Day Care Services (10-19: 2, 1-4: 2)
People in group quarters in 2010:
104 people in nursing facilities/skilled-nursing facilities
60 people in local jails and other municipal confinement facilities
8 people in correctional facilities intended for juveniles
People in group quarters in 2000:
92 people in nursing homes
80 people in local jails and other confinement facilities (including police lockups)
4 people in other noninstitutional group quarters
Fatal accident statistics in 2014:
Fatal accident count: 1
Vehicles involved in fatal accidents: 2
Fatal accidents caused by drunken drivers: 0
Fatalities: 1
Persons involved in fatal accidents: 2
Pedestrians involved in fatal accidents: 0
Fatal accident statistics in 2013:
Fatal accident count: 2
Vehicles involved in fatal accidents: 2
Fatal accidents caused by drunken drivers: 1
Fatalities: 2
Persons involved in fatal accidents: 2
Pedestrians involved in fatal accidents: 0
2002 - 2018 National Fire Incident Reporting System (NFIRS) incidents
Based on the data from the years 2002 - 2018 the average number of fire incidents per year is 44. The highest number of reported fires - 83 took place in 2002, and the least - 30 in 2013. The data has a decreasing trend.
When looking into fire subcategories, the most incidents belonged to: Structure Fires (49.6%), and Outside Fires (31.6%).
Fire incident types reported to NFIRS in Zip Code 48653
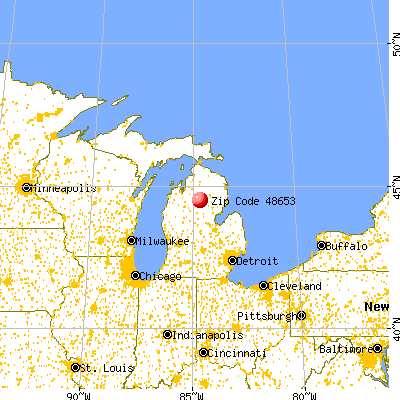


 Nearest zip codes: 48627, 49738, 48656, 48651, 48630, 48629.


 Based on the data from the years 2002 - 2018 the average number of fire incidents per year is 44. The highest number of reported fires - 83 took place in 2002, and the least - 30 in 2013. The data has a decreasing trend.
 When looking into fire subcategories, the most incidents belonged to: Structure Fires (49.6%), and Outside Fires (31.6%).