Estimated zip code population in 2022: 37
Zip code population in 2010: 63
Zip code population in 2000: 25
Houses and condos: 38
Renter-occupied apartments: 2
| % of renters here: | 15% |
| State: | 27% |
80.2
(low, U.S. average is 100)
Land area: 2.0
sq. mi.
Water area: 0.0
sq. mi.
| Population density: 18 people per square mile | | (very low). |
![Age and Sex of Residents in zip code 48743]()
- OSM Map
- General Map
- Google Map
- MSN Map
- OSM Map
- General Map
- Google Map
- MSN Map
- OSM Map
- General Map
- Google Map
- MSN Map
- OSM Map
- General Map
- Google Map
- MSN Map
Please wait while loading the map...
Business Search - 14 Million verified businesses
| Males: 22 |  (60.5%) (60.5%) |
| Females: 14 |  (39.5%) (39.5%) |
For population 25 years and over in 48743:
- High school or higher: 73.1%
- Bachelor's degree or higher: 0.0%
- Graduate or professional degree: 0.0%
- Unemployed: 75.6%
For population 15 years and over in 48743:
- Never married: 8.0%
- Now married: 37.2%
- Separated: 25.4%
- Widowed: 19.8%
- Divorced: 9.6%
Zip code 48743 compared to state average:
- Median household income significantly below state average.
- Median house value significantly below state average.
- Unemployed percentage significantly above state average.
- Black race population percentage significantly below state average.
- Hispanic race population percentage significantly below state average.
- Median age above state average.
- Foreign-born population percentage significantly below state average.
- Renting percentage below state average.
- Length of stay since moving in significantly above state average.
- Number of rooms per house below state average.
- Number of college students significantly below state average.
- Percentage of population with a bachelor's degree or higher significantly below state average.
Data:
100%
rural population.
Median resident age:| This zip code: | 47.8 years |
| Michigan median age: | 40.3 years |
Average household size:| This zip code: | 2.0 people |
| Michigan: | 2.4 people |
Averages for the 2004 tax year for zip code 48743, filed in 2005:
Average Adjusted Gross Income (AGI) in 2004: $26,000 (Individual Income Tax Returns)
| Here: | $26,000 |
| State: | $48,204 |
Salary/wage: $12,429 (reported on 68.3% of returns)
| Here: | $12,429 |
| State: | $42,791 |
Taxable interest for individuals: $812 (reported on 58.5% of returns)
| This zip code: | $812 |
| Michigan: | $1,725 |
Taxable dividends: $704 (reported on 32.9% of returns)
Total itemized deductions: $11,500 (36% of AGI, reported on 12.2% of returns)
| Here: | $11,500 |
| State: | $18,509 |
| Here: | 35.7% of AGI |
| State: | 20.7% of AGI |
Total tax: $2,754 (reported on 69.5% of returns)
Earned income credit: $933 (reported on 18.3% of returns)
Percentage of individuals using paid preparers for their 2004 taxes: 76.8%
Estimated median household income in 2022: | This zip code: | $2,444 |
| Michigan: | $66,986 |
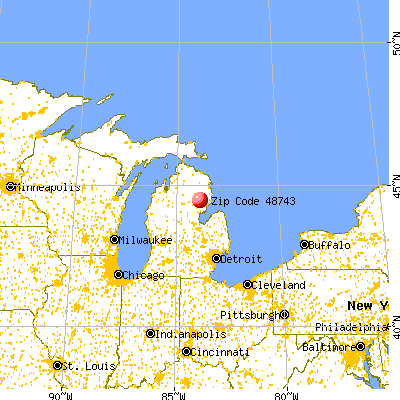
![48743 map]() Nearest zip codes: 48739
Nearest zip codes: 48739,
48761,
48635,
48770,
48737,
48756.
Percentage of family households:| This zip code: | 0.0% |
| Michigan: | 43.3% |
Percentage of households with unmarried partners:| This zip code: | 0.0% |
| Michigan: | 45.7% |
No gay or lesbian households reported
Household received Food Stamps/SNAP in the past 12 months: 17
Household did not receive Food Stamps/SNAP in the past 12 months: 3
Women who did not have a birth in the past 12 months: 11 (0 now married, 12 unmarried)
Housing units in zip code 48743 with a mortgage: 13
Residents with income below the poverty level in 2022:
| This zip code: | 50.8% |
| Whole state: | 13.4% |

- Year house built (houses)
- 02020 or later
- 02010 to 2019
- 02000 to 2009
- 01990 to 1999
- 01980 to 1989
- 191970 to 1979
- 01960 to 1969
- 161950 to 1959
- 01940 to 1949
- 31939 or earlier
![Zip code 48743 satellite photo by USGS]()
Zip code 48743 household income distribution in 2022
![Zip code 48743 household income distribution in 2022]()
- 14Less than $10,000
- 3$30,000 to $34,999
- 2$75,000 to $99,999
Estimated median house (or condo) value in 2022 for:
- White Non-Hispanic householders: $224,400
Mean price in 2022:
Detached houses: $250,399| Here: | $250,399 |
| State: | $280,038 |
Housing units in structures:
Unemployment: 75.6%
Household type by relationship:
Households: 37
- Male householders: 19 (14 living alone), Female householders: 0 (0 living alone)
3 spouses (3 opposite-sex spouses), 0 unmarried partners, (0 opposite-sex unmarried partners), 11 children (11 natural, 0 adopted, 0 stepchildren), 0 grandchildren, 0 brothers or sisters, 0 parents, 0 foster children, 0 other relatives, 5 non-relatives
Size of family households: 5 3-persons
Size of nonfamily households: 13 1-person
102.7% of residents of 48743 zip code speak English at home.
Foreign born population: 0 (0.0%)

- 36%German
- 28%Irish
- 22%American
- 8%English

- 69.8%Wood
- 32.2%Bottled, tank, or LP gas
Population in 1990: 349.
Place of birth for U.S.-born residents:
- This state: 34
- Midwest: 3
100% of the 48743 zip code residents lived in the same house 5 years ago.
82% of the 48743 zip code residents lived in the same house 1 year ago.
Out of people who lived in different houses, 86% moved from this county.
Top industries in this zip code by the number of employees in 2005:
- Accommodation and Food Services: Full-Service Restaurants (10-19 employees: 1 establishment)
- Construction: New Single-Family Housing Construction (except Operative Builders) (1-4: 1)
- Construction: Electrical Contractors (1-4: 1)
- Real Estate and Rental and Leasing: Video Tape and Disc Rental (1-4: 1)
- Accommodation and Food Services: Drinking Places (Alcoholic Beverages) (1-4: 1)
| Most common first names in zip code 48743 among deceased individuals |
| Name | Count | Lived (average) |
|---|
| James | 4 | 81.5 years |
| John | 4 | 78.0 years |
| Joseph | 4 | 73.8 years |
| Donald | 3 | 71.3 years |
| Charles | 3 | 69.7 years |
| Marie | 3 | 69.0 years |
| Robert | 3 | 62.4 years |
| Clifford | 2 | 60.5 years |
| Grace | 2 | 80.6 years |
| Jerry | 2 | 81.0 years |
| Most common last names in zip code 48743 among deceased individuals |
| Last name | Count | Lived (average) |
|---|
| Hoeppner | 3 | 67.7 years |
| Peters | 3 | 71.0 years |
| Robichaud | 3 | 76.0 years |
| Williams | 3 | 75.6 years |
| Doherty | 2 | 69.5 years |
| Baker | 2 | 72.1 years |
| Dunham | 2 | 65.0 years |
| Lawrence | 2 | 78.0 years |
| Dyer | 2 | 85.5 years |
| Lusch | 2 | 79.0 years |
 100% rural population.

 Nearest zip codes: 48739, 48761, 48635, 48770, 48737, 48756.


