Estimated zip code population in 2022: 1,821 Zip code population in 2010: 1,891 Zip code population in 2000: 2,028
Houses and condos: 1,005 Renter-occupied apartments: 117
% of renters here:
17%
State:
27%
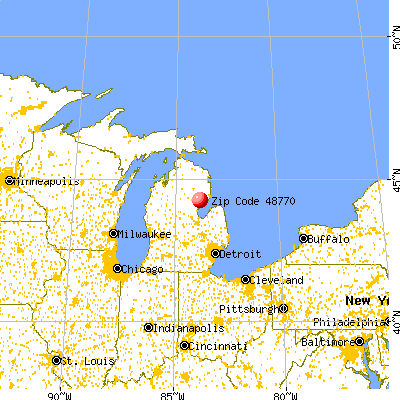
March 2022 cost of living index in zip code 48770: 79.7 (low, U.S. average is 100)
Land area: 67.8 sq. mi. Water area: 0.1 sq. mi.
Population density: 27 people per square mile
(very low).
OSM Map
General Map
Google Map
MSN Map
OSM Map
General Map
Google Map
MSN Map
OSM Map
General Map
Google Map
MSN Map
OSM Map
General Map
Google Map
MSN Map
Please wait while loading the map...
Real estate property taxes paid for housing units in 2022:
This zip code:
1.0% ($1,123)
Michigan:
1.2% ($2,746)
Median real estate property taxes paid for housing units with mortgages in 2022: $1,214 (1.0%) Median real estate property taxes paid for housing units with no mortgage in 2022: $1,046 (1.1%)
Business Search- 14 Million verified businesses
Males: 877
(48.2%)
Females: 944
(51.8%)
For population 25 years and over in 48770:
High school or higher: 85.1%
Bachelor's degree or higher: 9.9%
Graduate or professional degree: 3.1%
Unemployed: 6.4%
Mean travel time to work (commute): 37.1 minutes
For population 15 years and over in 48770:
Never married: 28.9%
Now married: 49.3%
Separated: 1.5%
Widowed: 6.3%
Divorced: 13.9%
Zip code 48770 compared to state average:
Median house value below state average.
Black race population percentage significantly below state average.
Hispanic race population percentage significantly below state average.
Median age above state average.
Foreign-born population percentage significantly below state average.
Renting percentage below state average.
Length of stay since moving in significantly above state average.
Number of college students below state average.
Percentage of population with a bachelor's degree or higher significantly below state average.
Averages for the 2020 tax year for zip code 48770, filed in 2021:
Average Adjusted Gross Income (AGI) in 2020: $39,874 (Individual Income Tax Returns)
Here:
$39,874
State:
$68,945
Salary/wage: $33,553 (reported on 71.2% of returns)
Here:
$33,553
State:
$57,142
(% of AGI for various income ranges: 844.4% for AGIs below $25k, 2825.8% for AGIs $25k-50k, 5628.6% for AGIs $50k-75k, 7650.0% for AGIs $75k-100k, 15483.3% for AGIs $100k-200k)
Taxable interest for individuals: $718 (reported on 21.2% of returns)
This zip code:
$718
Michigan:
$1,630
(% of AGI for various income ranges: 13.2% for AGIs below $25k, 15.3% for AGIs $25k-50k, 32.9% for AGIs $50k-75k, 123.3% for AGIs $100k-200k)
Ordinary dividends: $1,543 (reported on 8.8% of returns)
Here:
$1,543
State:
$6,972
(% of AGI for various income ranges: 7.6% for AGIs below $25k, 20.5% for AGIs $25k-50k, 125.0% for AGIs $75k-100k)
Net capital gain/loss in AGI: +$5,188 (reported on 10.0% of returns)
Here:
+$5,188
State:
+$20,064
(% of AGI for various income ranges: 85.3% for AGIs $25k-50k, 843.3% for AGIs $100k-200k)
Profit/loss from business: +$12,850 (reported on 15.0% of returns)
Here:
+$12,850
State:
+$11,172
(% of AGI for various income ranges: 143.6% for AGIs below $25k, 200.0% for AGIs $25k-50k, 1147.1% for AGIs $50k-75k)
Taxable individual retirement arrangement distribution: $10,014 (reported on 8.8% of returns)
48770:
$10,014
Michigan:
$19,803
(% of AGI for various income ranges: 53.6% for AGIs below $25k, 121.6% for AGIs $25k-50k, 840.0% for AGIs $75k-100k)
Earned income credit: $2,550 (reported on 20.0% of returns)
Here:
$2,550
State:
$2,251
(% of AGI for various income ranges: 95.6% for AGIs below $25k, 88.9% for AGIs $25k-50k)
Percentage of individuals using paid preparers for their 2020 taxes: 96.2%
Here:
96%
State:
93%
(% for various income ranges: 94.4% for AGIs below $25k, 95.7% for AGIs $25k-50k, 100.0% for AGIs $50k-75k, 100.0% for AGIs $75k-100k, 100.0% for AGIs $100k-200k)
Averages for the 2012 tax year for zip code 48770, filed in 2013:
Average Adjusted Gross Income (AGI) in 2012: $33,979 (Individual Income Tax Returns)
Here:
$33,979
State:
$55,609
Salary/wage: $28,100 (reported on 77.6% of returns)
Here:
$28,100
State:
$46,782
(% of AGI for various income ranges: 60.2% for AGIs below $25k, 68.4% for AGIs $25k-50k, 66.5% for AGIs $50k-75k, 60.0% for AGIs $75k-100k, 63.4% for AGIs $100k-200k)
Taxable interest for individuals: $655 (reported on 26.3% of returns)
This zip code:
$655
Michigan:
$1,491
(% of AGI for various income ranges: 1.0% for AGIs below $25k, 0.8% for AGIs $25k-50k, 0.3% for AGIs $50k-75k, 0.3% for AGIs $100k-200k)
Ordinary dividends: $843 (reported on 9.2% of returns)
Here:
$843
State:
$6,225
Net capital gain/loss in AGI: +$2,586 (reported on 9.2% of returns)
Here:
+$2,586
State:
+$9,326
(% of AGI for various income ranges: 0.5% for AGIs $25k-50k, 4.1% for AGIs $75k-100k)
Profit/loss from business: +$4,727 (reported on 14.5% of returns)
Here:
+$4,727
State:
+$11,523
(% of AGI for various income ranges: 5.8% for AGIs below $25k, 2.7% for AGIs $25k-50k, 1.3% for AGIs $50k-75k)
Taxable individual retirement arrangement distribution: $7,250 (reported on 7.9% of returns)
48770:
$7,250
Michigan:
$15,298
(% of AGI for various income ranges: 2.0% for AGIs below $25k, 1.7% for AGIs $25k-50k, 4.4% for AGIs $50k-75k)
Total itemized deductions: $17,350 (26% of AGI, reported on 13.2% of returns)
Here:
$17,350
State:
$21,628
Here:
26.3% of AGI
State:
18.4% of AGI
(% of AGI for various income ranges: 8.5% for AGIs $25k-50k, 13.4% for AGIs $50k-75k, 8.9% for AGIs $100k-200k)
Charity contributions: $1,200 (reported on 9.2% of returns)
Here:
$1,200
State:
$4,225
Taxes paid: $4,390 (reported on 13.2% of returns)
48770:
$4,390
State:
$8,327
(% of AGI for various income ranges: 1.6% for AGIs $25k-50k, 3.2% for AGIs $50k-75k, 3.0% for AGIs $100k-200k)
Earned income credit: $2,363 (reported on 25.0% of returns)
Here:
$2,363
State:
$2,306
(% of AGI for various income ranges: 7.4% for AGIs below $25k, 1.5% for AGIs $25k-50k)
Percentage of individuals using paid preparers for their 2012 taxes: 64.5%
Here:
64%
State:
57%
(% for various income ranges: 57.5% for AGIs below $25k, 72.2% for AGIs $25k-50k, 55.6% for AGIs $50k-75k, 80.0% for AGIs $75k-100k, 100.0% for AGIs $100k-200k)
Averages for the 2004 tax year for zip code 48770, filed in 2005:
Average Adjusted Gross Income (AGI) in 2004: $31,043 (Individual Income Tax Returns)
Here:
$31,043
State:
$48,204
Salary/wage: $25,753 (reported on 82.8% of returns)
Here:
$25,753
State:
$42,791
(% of AGI for various income ranges: 95.0% for AGIs below $10k, 65.6% for AGIs $10k-25k, 75.1% for AGIs $25k-50k, 78.1% for AGIs $50k-75k, 79.4% for AGIs $75k-100k, 42.8% for AGIs over 100k)
Taxable interest for individuals: $591 (reported on 40.6% of returns)
This zip code:
$591
Michigan:
$1,725
(% of AGI for various income ranges: 5.1% for AGIs below $10k, 1.3% for AGIs $10k-25k, 0.8% for AGIs $25k-50k, 0.5% for AGIs $50k-75k, 0.3% for AGIs $75k-100k, 0.3% for AGIs over 100k)
Taxable dividends: $818 (reported on 10.8% of returns)
Here:
$818
State:
$3,420
(% of AGI for various income ranges: 0.9% for AGIs below $10k, 0.5% for AGIs $10k-25k, 0.2% for AGIs $25k-50k, 0.4% for AGIs $50k-75k, 0.3% for AGIs $75k-100k)
Net capital gain/loss: +$2,633 (reported on 9.7% of returns)
Here:
+$2,633
State:
+$8,532
(% of AGI for various income ranges: -1.6% for AGIs below $10k, 0.2% for AGIs $10k-25k, 1.9% for AGIs $25k-50k, 1.7% for AGIs $50k-75k)
Profit/loss from business: +$4,042 (reported on 17.5% of returns)
Here:
+$4,042
State:
+$9,547
(% of AGI for various income ranges: 8.8% for AGIs below $10k, 8.4% for AGIs $10k-25k, -0.2% for AGIs $25k-50k, 4.7% for AGIs $75k-100k)
IRA payment deduction: $3,643 (reported on 1.7% of returns)
48770:
$3,643
Michigan:
$2,875
Total itemized deductions: $16,007 (21% of AGI, reported on 17.0% of returns)
Here:
$16,007
State:
$18,509
Here:
21.2% of AGI
State:
20.7% of AGI
(% of AGI for various income ranges: 4.4% for AGIs $10k-25k, 9.4% for AGIs $25k-50k, 10.9% for AGIs $50k-75k, 17.1% for AGIs $75k-100k, 5.6% for AGIs over 100k)
Charity contributions deductions: $1,942 (2% of AGI, reported on 14.8% of returns)
Here:
$1,942
State:
$3,365
Here:
2.4% of AGI
State:
3.6% of AGI
(% of AGI for various income ranges: 0.6% for AGIs $10k-25k, 0.7% for AGIs $25k-50k, 0.9% for AGIs $50k-75k, 2.2% for AGIs $75k-100k, 0.9% for AGIs over 100k)
Total tax: $4,377 (reported on 67.4% of returns)
48770:
$4,377
State:
$7,691
(% of AGI for various income ranges: 2.4% for AGIs below $10k, 3.9% for AGIs $10k-25k, 5.4% for AGIs $25k-50k, 7.5% for AGIs $50k-75k, 8.1% for AGIs $75k-100k, 23.7% for AGIs over 100k)
Earned income credit: $1,773 (reported on 20.1% of returns)
Here:
$1,773
State:
$1,737
Percentage of individuals using paid preparers for their 2004 taxes: 67.6%
Here:
68%
State:
60%
(% for various income ranges: 62.7% for AGIs below $10k, 62.7% for AGIs $10k-25k, 73.0% for AGIs $25k-50k, 74.7% for AGIs $50k-75k, 71.1% for AGIs $75k-100k, 91.3% for AGIs over 100k)
Household received Food Stamps/SNAP in the past 12 months: 167 Household did not receive Food Stamps/SNAP in the past 12 months: 542
Women who had a birth in the past 12 months: 16 (8 now married, 7 unmarried) Women who did not have a birth in the past 12 months: 374 (146 now married, 227 unmarried)
Housing units in zip code 48770 with a mortgage: 253 (27 second mortgage, 19 both second mortgage and home equity loan) Houses without a mortgage: 5
Median monthly owner costs for units with a mortgage: $1,024 Median monthly owner costs for units without a mortgage: $418
Residents with income below the poverty level in 2022:
This zip code:
18.3%
Whole state:
13.4%
Residents with income below 50% of the poverty level in 2022:
This zip code:
8.5%
Whole state:
6.9%
Median number of rooms in houses and condos:
Here:
6.4
State:
6.5
Median number of rooms in apartments:
Here:
4.3
State:
4.3
Notable locations in this zip code not listed on our city pages
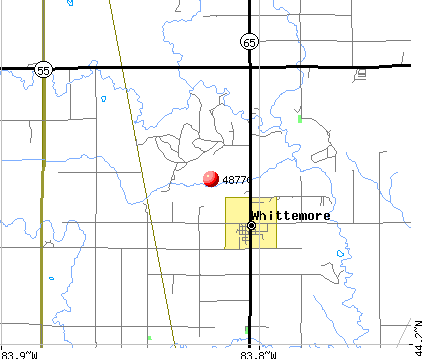
Notable locations in zip code 48770: Whittemore Speedway (A), Burleigh - Reno - Whittemore Fire Department (B), Whittemore City Hall (C), Whittemore Branch Library (D). Display/hide their locations on the map
Churches in zip code 48770 include: Whittemore Baptist Church (A), Whittemore United Methodist Church (B), Saint James Catholic Church (C), Good News Ministries Lutheran Church (D), Reno Church (E). Display/hide their locations on the map
Creeks: Hope Creek (A), Hall Creek (B), Johnson Creek (C), Latter Creek (D), Whitney Creek (E), Buchanan Creek (F), Porterfield Creek (G), Crainer Creek (H), Mongo Creek (I). Display/hide their locations on the map
Size of family households: 232 2-persons, 92 3-persons, 66 4-persons, 28 5-persons, 5 6-persons, 27 7-or-more-persons
Size of nonfamily households: 216 1-person, 31 2-persons, 4 3-persons
223 married couples with children.
118 single-parent households (49 men, 69 women).
95.8% of residents of 48770 zip code speak English at home.
0.2% of residents speak Spanish at home (100% very well).
3.1% of residents speak other Indo-European language at home (79% very well, 17% well, 4% not well).
0.6% of residents speak Asian or Pacific Island language at home (100% very well).
0.1% of residents speak other language at home (100% very well).
Foreign born population: 2 (0.2%) (34.5% of them are naturalized citizens)
This zip code:
0.2%
Whole state:
6.9%
33%Sweden
33%United Kingdom, excluding England and Scotland
33%Taiwan
31%English
24%German
15%American
5%Italian
4%Irish
2%Polish
2%Scottish
Year of entry for the foreign-born population
02010 or later
12000 to 2009
01990 to 1999
0Before 1990
Major facilities with environmental interests located in this zip code:
EARLY CHILDHOOD CENTER (8970 PRESCOTT ROAD in WHITTEMORE, MI)
(National Center for Education Statistics) - STATE ID-07705 Organizations: WHITTEMORE-PRESCOTT AREA SCHOOLS (SCHOOL DISTRICT)
MI DEPT/ENVIRONMENTAL QUALITY (118 S BULLOCK in WHITTEMORE, MI)
(Resource Conservation and Recovery Act (tracking hazardous waste)) Organizations: MI DEPT/NATURAL RESOURCES REAL ESTATE (CONTACT/OPERATOR)
Alternative names: MI DEPT/ENVIRONMENTAL QUALITY RRD
MI DEPT/TRANSPORTATION BRIDGE (M-65 OVER JOHNSON CREEK in WHITTEMORE, MI)
(Resource Conservation and Recovery Act (tracking hazardous waste)) Organizations: MICH DEPT OF TRANSPORTATION (CONTACT/OPERATOR)
Alternative names: MIDOT BRIDGE M-65 OVER JOHNSON CREEK
(Resource Conservation and Recovery Act (tracking hazardous waste)) Organizations: MICHIGAN CONSOLIDATED GAS CO (CONTACT/OWNER)
Alternative names: MICHCON WHITTMORE GATE
MI DEPT/ENVIRONMENTAL QUALITY (215 S BULLOCK in WHITTEMORE, MI)
(Resource Conservation and Recovery Act (tracking hazardous waste)) Alternative names: GRAHAM OIL CO
Housing units lacking complete plumbing facilities: 3.5% Housing units lacking complete kitchen facilities: 4.4%
30.6%Bottled, tank, or LP gas
28.8%Utility gas
24.9%Wood
9.3%Electricity
4.2%Other fuel
2.6%Fuel oil, kerosene, etc.
Population in 1990: 1,754. Population change in the 1990s: +274 (+15.6%).
Place of birth for U.S.-born residents:
This state: 1,564
Northeast: 10
Midwest: 165
South: 52
West: 24
66% of the 48770 zip code residents lived in the same house 5 years ago. Out of people who lived in different houses, 52% lived in this county. Out of people who lived in different counties, 50% lived in Michigan.
94% of the 48770 zip code residents lived in the same house 1 year ago. Out of people who lived in different houses, 22% moved from this county. Out of people who lived in different houses, 67% moved from different county within same state. Out of people who lived in different houses, 11% moved from different state.
Private vs. public school enrollment:
Students in private schools in grades 1 to 8 (elementary and middle school): 41
Here:
22.7%
Michigan:
12.4%
Students in private schools in grades 9 to 12 (high school):
Here:
0.0%
Michigan:
9.8%
Students in private undergraduate colleges: 4
Here:
9.3%
Michigan:
14.9%
Occupation by median earnings in the past 12 months ($)
116,952Business and financial operations occupations
76,624Health diagnosing and treating practitioners and other technical occupations
63,422Education, training, and library occupations
44,992Construction and extraction occupations
44,802Management occupations
44,395Installation, maintenance, and repair occupations
Top industries in this zip code by the number of employees in 2005:
Mining: All Other Nonmetallic Mineral Mining (10-19 employees: 1 establishment)
Accommodation and Food Services: Limited-Service Restaurants (5-9: 1, 1-4: 1)
Accommodation and Food Services: Full-Service Restaurants (5-9: 1, 1-4: 1)
Accommodation and Food Services: Food Service Contractors (5-9: 1)
Construction: New Single-Family Housing Construction (except Operative Builders) (1-4: 3)
Other Services (except Public Administration): Religious Organizations (1-4: 2)
Other Services (except Public Administration): Pet Care (except Veterinary) Services (1-4: 1)
Fatal accident statistics in 2013:
Fatal accident count: 1
Vehicles involved in fatal accidents: 1
Fatal accidents caused by drunken drivers: 0
Fatalities: 1
Persons involved in fatal accidents: 1
Pedestrians involved in fatal accidents: 0
Fatal accident statistics in 2012:
Fatal accident count: 1
Vehicles involved in fatal accidents: 1
Fatal accidents caused by drunken drivers: 1
Fatalities: 1
Persons involved in fatal accidents: 1
Pedestrians involved in fatal accidents: 0
2002 - 2018 National Fire Incident Reporting System (NFIRS) incidents
According to the data from the years 2002 - 2018 the average number of fire incidents per year is 13. The highest number of fires - 25 took place in 2003, and the least - 3 in 2014. The data has an increasing trend.
When looking into fire subcategories, the most incidents belonged to: Structure Fires (43.7%), and Outside Fires (39.6%).
Fire incident types reported to NFIRS in Zip Code 48770


 Nearest zip codes: 48739, 48765, 48766, 48756, 48743, 48763.


 According to the data from the years 2002 - 2018 the average number of fire incidents per year is 13. The highest number of fires - 25 took place in 2003, and the least - 3 in 2014. The data has an increasing trend.
 When looking into fire subcategories, the most incidents belonged to: Structure Fires (43.7%), and Outside Fires (39.6%).