Estimated zip code population in 2022: 1,715 Zip code population in 2010: 1,494 Zip code population in 2000: 1,542
Houses and condos: 693 Renter-occupied apartments: 48
% of renters here:
8%
State:
27%
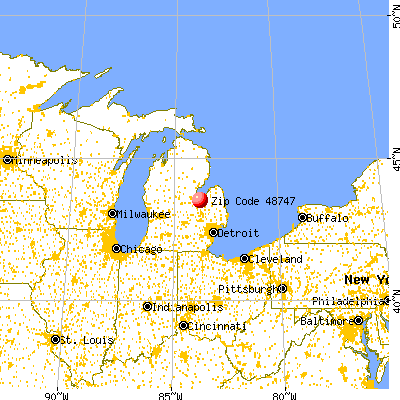
March 2022 cost of living index in zip code 48747: 80.0 (low, U.S. average is 100)
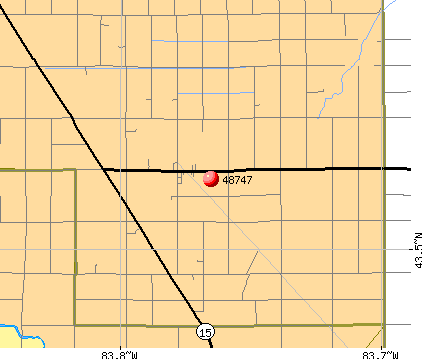
Land area: 30.8 sq. mi. Water area: 0.0 sq. mi.
Population density: 56 people per square mile
(very low).
OSM Map
General Map
Google Map
MSN Map
OSM Map
General Map
Google Map
MSN Map
OSM Map
General Map
Google Map
MSN Map
OSM Map
General Map
Google Map
MSN Map
Please wait while loading the map...
Real estate property taxes paid for housing units in 2022:
This zip code:
1.5% ($1,911)
Michigan:
1.2% ($2,746)
Median real estate property taxes paid for housing units with mortgages in 2022: $2,133 (1.4%) Median real estate property taxes paid for housing units with no mortgage in 2022: $1,631 (1.4%)
Business Search- 14 Million verified businesses
Males: 854
(49.8%)
Females: 861
(50.2%)
For population 25 years and over in 48747:
High school or higher: 93.8%
Bachelor's degree or higher: 22.2%
Graduate or professional degree: 5.5%
Unemployed: 4.7%
Mean travel time to work (commute): 27.8 minutes
For population 15 years and over in 48747:
Never married: 28.4%
Now married: 57.3%
Separated: 0.7%
Widowed: 5.6%
Divorced: 7.9%
Zip code 48747 compared to state average:
Median house value below state average.
Black race population percentage significantly below state average.
Foreign-born population percentage significantly below state average.
Renting percentage significantly below state average.
Length of stay since moving in significantly above state average.
Estimated median house/condo value in 2022: $131,114
48747:
$131,114
Michigan:
$224,400
According to our research of Michigan and other state lists, there were 4 registered sex offenders living in 48747 zip code as of May 28, 2024. The ratio of all residents to sex offenders in zip code 48747 is 346 to 1. The ratio of registered sex offenders to all residents in this zip code is near the state average.
Median resident age:
This zip code:
43.2 years
Michigan median age:
40.3 years
Average household size:
This zip code:
2.7 people
Michigan:
2.4 people
Averages for the 2020 tax year for zip code 48747, filed in 2021:
Average Adjusted Gross Income (AGI) in 2020: $60,862 (Individual Income Tax Returns)
Here:
$60,862
State:
$68,945
Salary/wage: $56,530 (reported on 78.1% of returns)
Here:
$56,530
State:
$57,142
(% of AGI for various income ranges: 1044.3% for AGIs below $25k, 2961.7% for AGIs $25k-50k, 5552.5% for AGIs $50k-75k, 8124.3% for AGIs $75k-100k, 21346.2% for AGIs $100k-200k)
Taxable interest for individuals: $817 (reported on 39.7% of returns)
This zip code:
$817
Michigan:
$1,630
(% of AGI for various income ranges: 25.0% for AGIs below $25k, 48.3% for AGIs $25k-50k, 17.5% for AGIs $50k-75k, 52.9% for AGIs $75k-100k, 116.3% for AGIs $100k-200k)
Ordinary dividends: $1,308 (reported on 16.4% of returns)
Here:
$1,308
State:
$6,972
(% of AGI for various income ranges: 39.2% for AGIs $25k-50k, 43.8% for AGIs $50k-75k, 93.8% for AGIs $100k-200k)
Net capital gain/loss in AGI: +$2,291 (reported on 15.1% of returns)
Here:
+$2,291
State:
+$20,064
(% of AGI for various income ranges: 41.2% for AGIs $50k-75k, 280.0% for AGIs $100k-200k)
Profit/loss from business: +$2,814 (reported on 9.6% of returns)
Here:
+$2,814
State:
+$11,172
(% of AGI for various income ranges: 52.1% for AGIs below $25k, 85.0% for AGIs $50k-75k, 70.0% for AGIs $100k-200k)
Taxable individual retirement arrangement distribution: $16,775 (reported on 11.0% of returns)
48747:
$16,775
Michigan:
$19,803
(% of AGI for various income ranges: 285.0% for AGIs $25k-50k, 442.5% for AGIs $50k-75k, 922.9% for AGIs $75k-100k)
Earned income credit: $2,150 (reported on 8.2% of returns)
Here:
$2,150
State:
$2,251
(% of AGI for various income ranges: 58.6% for AGIs below $25k, 39.2% for AGIs $25k-50k)
Percentage of individuals using paid preparers for their 2020 taxes: 94.5%
Here:
95%
State:
93%
(% for various income ranges: 95.5% for AGIs below $25k, 93.8% for AGIs $25k-50k, 90.9% for AGIs $50k-75k, 100.0% for AGIs $75k-100k, 93.3% for AGIs $100k-200k)
Averages for the 2012 tax year for zip code 48747, filed in 2013:
Average Adjusted Gross Income (AGI) in 2012: $50,140 (Individual Income Tax Returns)
Here:
$50,140
State:
$55,609
Salary/wage: $41,414 (reported on 86.7% of returns)
Here:
$41,414
State:
$46,782
(% of AGI for various income ranges: 59.8% for AGIs below $25k, 63.0% for AGIs $25k-50k, 77.6% for AGIs $50k-75k, 76.4% for AGIs $75k-100k, 72.9% for AGIs $100k-200k)
Taxable interest for individuals: $1,081 (reported on 41.3% of returns)
This zip code:
$1,081
Michigan:
$1,491
(% of AGI for various income ranges: 3.0% for AGIs below $25k, 0.7% for AGIs $25k-50k, 1.0% for AGIs $50k-75k, 0.9% for AGIs $75k-100k, 0.4% for AGIs $100k-200k)
Ordinary dividends: $1,469 (reported on 21.3% of returns)
Here:
$1,469
State:
$6,225
(% of AGI for various income ranges: 1.7% for AGIs below $25k, 0.4% for AGIs $25k-50k, 0.9% for AGIs $50k-75k, 0.6% for AGIs $100k-200k)
Net capital gain/loss in AGI: +$60 (reported on 13.3% of returns)
Here:
+$60
State:
+$9,326
(% of AGI for various income ranges: 0.4% for AGIs $100k-200k)
Profit/loss from business: +$3,600 (reported on 9.3% of returns)
Here:
+$3,600
State:
+$11,523
Taxable individual retirement arrangement distribution: $8,320 (reported on 13.3% of returns)
48747:
$8,320
Michigan:
$15,298
(% of AGI for various income ranges: 3.2% for AGIs below $25k, 6.4% for AGIs $25k-50k, 4.2% for AGIs $75k-100k)
Total itemized deductions: $16,563 (19% of AGI, reported on 25.3% of returns)
Here:
$16,563
State:
$21,628
Here:
19.0% of AGI
State:
18.4% of AGI
(% of AGI for various income ranges: 9.7% for AGIs $25k-50k, 8.0% for AGIs $50k-75k, 10.4% for AGIs $75k-100k, 9.0% for AGIs $100k-200k)
Charity contributions: $2,029 (reported on 22.7% of returns)
Here:
$2,029
State:
$4,225
(% of AGI for various income ranges: 1.0% for AGIs below $25k, 1.1% for AGIs $50k-75k, 1.4% for AGIs $75k-100k, 1.0% for AGIs $100k-200k)
Taxes paid: $6,121 (reported on 25.3% of returns)
48747:
$6,121
State:
$8,327
(% of AGI for various income ranges: 2.3% for AGIs $25k-50k, 2.5% for AGIs $50k-75k, 3.8% for AGIs $75k-100k, 4.3% for AGIs $100k-200k)
Earned income credit: $2,162 (reported on 10.7% of returns)
Here:
$2,162
State:
$2,306
(% of AGI for various income ranges: 4.0% for AGIs below $25k, 0.6% for AGIs $25k-50k)
Percentage of individuals using paid preparers for their 2012 taxes: 72.0%
Here:
72%
State:
57%
(% for various income ranges: 65.4% for AGIs below $25k, 73.7% for AGIs $25k-50k, 76.9% for AGIs $50k-75k, 87.5% for AGIs $75k-100k, 66.7% for AGIs $100k-200k)
Averages for the 2004 tax year for zip code 48747, filed in 2005:
Average Adjusted Gross Income (AGI) in 2004: $39,157 (Individual Income Tax Returns)
Here:
$39,157
State:
$48,204
Salary/wage: $36,761 (reported on 85.0% of returns)
Here:
$36,761
State:
$42,791
(% of AGI for various income ranges: 98.4% for AGIs below $10k, 66.4% for AGIs $10k-25k, 71.6% for AGIs $25k-50k, 80.9% for AGIs $50k-75k, 93.9% for AGIs $75k-100k, 74.9% for AGIs over 100k)
Taxable interest for individuals: $1,124 (reported on 60.3% of returns)
This zip code:
$1,124
Michigan:
$1,725
(% of AGI for various income ranges: 6.5% for AGIs below $10k, 3.8% for AGIs $10k-25k, 2.2% for AGIs $25k-50k, 1.8% for AGIs $50k-75k, 0.4% for AGIs $75k-100k, 1.1% for AGIs over 100k)
Taxable dividends: $1,000 (reported on 22.0% of returns)
Here:
$1,000
State:
$3,420
(% of AGI for various income ranges: 1.8% for AGIs below $10k, 1.4% for AGIs $10k-25k, 0.5% for AGIs $25k-50k, 0.6% for AGIs $50k-75k, 0.3% for AGIs $75k-100k, 0.3% for AGIs over 100k)
Net capital gain/loss: +$3,718 (reported on 16.6% of returns)
Here:
+$3,718
State:
+$8,532
(% of AGI for various income ranges: -3.5% for AGIs below $10k, -0.3% for AGIs $10k-25k, 0.0% for AGIs $25k-50k, 1.1% for AGIs $50k-75k, -0.2% for AGIs $75k-100k, 8.3% for AGIs over 100k)
Profit/loss from business: +$2,563 (reported on 11.0% of returns)
Here:
+$2,563
State:
+$9,547
(% of AGI for various income ranges: 2.5% for AGIs below $10k, 2.9% for AGIs $10k-25k, 1.0% for AGIs $25k-50k, 0.2% for AGIs $50k-75k, 0.6% for AGIs $75k-100k)
Total itemized deductions: $13,337 (21% of AGI, reported on 32.0% of returns)
Here:
$13,337
State:
$18,509
Here:
20.7% of AGI
State:
20.7% of AGI
(% of AGI for various income ranges: 9.8% for AGIs $10k-25k, 11.5% for AGIs $25k-50k, 11.4% for AGIs $50k-75k, 11.6% for AGIs $75k-100k, 10.4% for AGIs over 100k)
Charity contributions deductions: $1,983 (3% of AGI, reported on 29.7% of returns)
Here:
$1,983
State:
$3,365
Here:
3.1% of AGI
State:
3.6% of AGI
(% of AGI for various income ranges: 1.7% for AGIs $10k-25k, 1.4% for AGIs $25k-50k, 1.4% for AGIs $50k-75k, 1.7% for AGIs $75k-100k, 1.6% for AGIs over 100k)
Total tax: $4,791 (reported on 74.0% of returns)
48747:
$4,791
State:
$7,691
(% of AGI for various income ranges: 1.8% for AGIs below $10k, 4.2% for AGIs $10k-25k, 7.3% for AGIs $25k-50k, 8.8% for AGIs $50k-75k, 9.8% for AGIs $75k-100k, 14.4% for AGIs over 100k)
Earned income credit: $1,575 (reported on 9.3% of returns)
Here:
$1,575
State:
$1,737
Percentage of individuals using paid preparers for their 2004 taxes: 73.0%
Here:
73%
State:
60%
(% for various income ranges: 68.2% for AGIs below $10k, 74.1% for AGIs $10k-25k, 73.1% for AGIs $25k-50k, 77.8% for AGIs $50k-75k, 72.0% for AGIs $75k-100k, 74.4% for AGIs over 100k)
Likely homosexual households (counted as self-reported same-sex unmarried-partner households)
Lesbian couples: 0.5% of all households
Gay men: 0.0% of all households
Household received Food Stamps/SNAP in the past 12 months: 63 Household did not receive Food Stamps/SNAP in the past 12 months: 580
Women who had a birth in the past 12 months: 18 (9 now married, 8 unmarried) Women who did not have a birth in the past 12 months: 289 (171 now married, 117 unmarried)
Housing units in zip code 48747 with a mortgage: 286 (23 second mortgage, 24 both second mortgage and home equity loan) Houses without a mortgage: 8
Median monthly owner costs for units with a mortgage: $1,401 Median monthly owner costs for units without a mortgage: $468
Residents with income below the poverty level in 2022:
This zip code:
7.2%
Whole state:
13.4%
Residents with income below 50% of the poverty level in 2022:
This zip code:
2.2%
Whole state:
6.9%
Median number of rooms in houses and condos:
Here:
6.5
State:
6.5
Median number of rooms in apartments:
Here:
7.0
State:
4.3
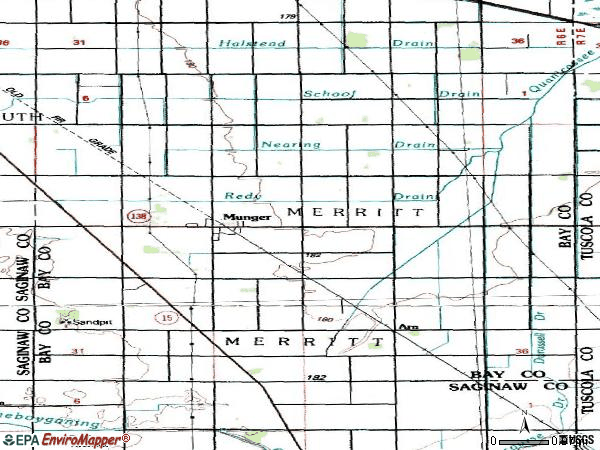
Notable locations in this zip code not listed on our city pages
Notable locations in zip code 48747: Arn Station (A), Munger Station (B), Merritt Township Fire Department Station 22 (C). Display/hide their locations on the map
Churches in zip code 48747 include: Community Bible Church (A), Saint Norbert Church (B), Trinity-Saint James Lutheran Church (C). Display/hide their locations on the map
In group quarters: 1 (-1 institutionalized population)
Size of family households: 236 2-persons, 81 3-persons, 75 4-persons, 44 5-persons, 24 6-persons, 19 7-or-more-persons
Size of nonfamily households: 142 1-person, 20 2-persons
229 married couples with children.
62 single-parent households (27 men, 35 women).
98.9% of residents of 48747 zip code speak English at home.
0.9% of residents speak Spanish at home (33% very well, 33% well, 33% not well).
Foreign born population: 19 (1.2%) (51.3% of them are naturalized citizens)
This zip code:
1.2%
Whole state:
6.9%
50%Bhutan
45%Honduras
47%German
13%Polish
6%European
5%English
5%Irish
4%French Canadian
3%American
Year of entry for the foreign-born population
02010 or later
02000 to 2009
01990 to 1999
18Before 1990
Facilities with environmental interests located in this zip code:
AGRICO FARM CENTER (361 CASS AVENUE ROAD in MUNGER, MI)
COMPLIANCE ACTIVITY (Tracking inspections of insecticide, fungicide, and rodenticide, and toxic substances) (Resource Conservation and Recovery Act (tracking hazardous waste)) Organizations: CROP PRODUCTION SERVICES INC (CONTACT/OPERATOR)
Alternative names: CPS FARM CENTER
BORDEN CHEMICAL SMITH-DOUGLASS DIV (107 S FARLEY in MUNGER, MI)
(Resource Conservation and Recovery Act (tracking hazardous waste)) Organizations: SMITH DOUBLASS DIVISION (CONTACT/OPERATOR)
, BORDEN CHEMICALS (CONTACT/OWNER)
GOLLIN BLOCK AND SUPPLY CO (136 E MUNGER RD in MUNGER, MI)
(Resource Conservation and Recovery Act (tracking hazardous waste)) Business NAICS classification: CONCRETE BLOCK AND BRICK MANUFACTURING.
4D INC (136 E. MUNGER RD. in MUNGER, MI)
CRITERIA AND HAZARDOUS AIR POLLUTANT INVENTORY (Inventory of air pollution sources) TRI REPORTER (Tracking of toxic chemicals releasing facilities) Business SIC classification: CONCRETE BLOCK AND BRICK
Housing units lacking complete kitchen facilities: 0.9%
50.0%Bottled, tank, or LP gas
31.1%Utility gas
8.6%Fuel oil, kerosene, etc.
6.0%Wood
2.7%Electricity
2.1%Other fuel
Population in 1990: 1,898.
Place of birth for U.S.-born residents:
This state: 1,592
Northeast: 31
Midwest: 21
South: 34
West: 11
77% of the 48747 zip code residents lived in the same house 5 years ago. Out of people who lived in different houses, 58% lived in this county. Out of people who lived in different counties, 50% lived in Michigan.
97% of the 48747 zip code residents lived in the same house 1 year ago. Out of people who lived in different houses, 78% moved from this county. Out of people who lived in different houses, 9% moved from different county within same state. Out of people who lived in different houses, 16% moved from different state.
Private vs. public school enrollment:
Students in private schools in grades 1 to 8 (elementary and middle school): 5
Here:
5.1%
Michigan:
12.4%
Students in private schools in grades 9 to 12 (high school): 28
Here:
20.1%
Michigan:
9.8%
Students in private undergraduate colleges: 3
Here:
6.1%
Michigan:
14.9%
Occupation by median earnings in the past 12 months ($)
102,930Architecture and engineering occupations
85,932Construction and extraction occupations
81,797Installation, maintenance, and repair occupations
77,880Health diagnosing and treating practitioners and other technical occupations
67,129Life, physical, and social science occupations
66,585Education, training, and library occupations
Top industries in this zip code by the number of employees in 2005:
Other Services (except Public Administration): Religious Organizations (5-9 employees: 2 establishments)
Finance and Insurance: Insurance Agencies and Brokerages (5-9: 1)
Other Services (except Public Administration): Commercial and Industrial Machinery and Equipment (except Automotive and Electronic) Repair and Maintenance (5-9: 1)
Accommodation and Food Services: Drinking Places (Alcoholic Beverages) (1-4: 2)
Wholesale Trade: Wholesale Trade Agents and Brokers (1-4: 2)
Construction: Other Heavy and Civil Engineering Construction (1-4: 1)
Accommodation and Food Services: Full-Service Restaurants (1-4: 1)
People in group quarters in 2000:
101 people in agriculture workers' dormitories on farms
Fatal accident statistics in 2013:
Fatal accident count: 1
Vehicles involved in fatal accidents: 1
Fatal accidents caused by drunken drivers: 1
Fatalities: 1
Persons involved in fatal accidents: 1
Pedestrians involved in fatal accidents: 0
Fatal accident statistics in 2012:
Fatal accident count: 1
Vehicles involved in fatal accidents: 1
Fatal accidents caused by drunken drivers: 1
Fatalities: 1
Persons involved in fatal accidents: 3
Pedestrians involved in fatal accidents: 0
Home Mortgage Disclosure Act Aggregated Statistics For Year 2009 (Based on 2 partial tracts)
A) FHA, FSA/RHS & VA Home Purchase Loans
B) Conventional Home Purchase Loans
C) Refinancings
D) Home Improvement Loans
F) Non-occupant Loans on < 5 Family Dwellings (A B C & D)
G) Loans On Manufactured Home Dwelling (A B C & D)
Number
Average Value
Number
Average Value
Number
Average Value
Number
Average Value
Number
Average Value
Number
Average Value
LOANS ORIGINATED
14
$89,900
20
$70,644
88
$108,935
14
$41,594
2
$50,460
0
$0
APPLICATIONS APPROVED, NOT ACCEPTED
0
$0
1
$30,160
12
$125,763
3
$9,280
0
$0
0
$0
APPLICATIONS DENIED
2
$81,780
2
$139,200
42
$109,537
2
$20,880
0
$0
0
$0
APPLICATIONS WITHDRAWN
3
$85,453
0
$0
20
$117,044
0
$0
0
$0
1
$131,080
FILES CLOSED FOR INCOMPLETENESS
2
$72,500
0
$0
1
$121,800
0
$0
0
$0
0
$0
Aggregated Statistics For Year 2008 (Based on 2 partial tracts)
A) FHA, FSA/RHS & VA Home Purchase Loans
B) Conventional Home Purchase Loans
C) Refinancings
D) Home Improvement Loans
F) Non-occupant Loans on < 5 Family Dwellings (A B C & D)
G) Loans On Manufactured Home Dwelling (A B C & D)
Number
Average Value
Number
Average Value
Number
Average Value
Number
Average Value
Number
Average Value
Number
Average Value
LOANS ORIGINATED
15
$92,413
32
$85,550
59
$112,540
23
$24,663
5
$57,536
1
$158,920
APPLICATIONS APPROVED, NOT ACCEPTED
1
$131,080
1
$135,720
2
$139,780
0
$0
0
$0
0
$0
APPLICATIONS DENIED
2
$131,080
7
$62,309
42
$102,715
10
$43,616
3
$84,680
7
$73,743
APPLICATIONS WITHDRAWN
2
$153,120
2
$151,960
9
$144,356
1
$29,000
0
$0
0
$0
FILES CLOSED FOR INCOMPLETENESS
0
$0
1
$185,600
0
$0
0
$0
1
$185,600
0
$0
Aggregated Statistics For Year 2007 (Based on 2 partial tracts)
A) FHA, FSA/RHS & VA Home Purchase Loans
B) Conventional Home Purchase Loans
C) Refinancings
D) Home Improvement Loans
F) Non-occupant Loans on < 5 Family Dwellings (A B C & D)
G) Loans On Manufactured Home Dwelling (A B C & D)
Number
Average Value
Number
Average Value
Number
Average Value
Number
Average Value
Number
Average Value
Number
Average Value
LOANS ORIGINATED
15
$99,296
51
$95,165
97
$82,683
26
$25,118
7
$90,646
6
$91,447
APPLICATIONS APPROVED, NOT ACCEPTED
0
$0
8
$115,855
13
$104,578
8
$33,205
1
$23,200
0
$0
APPLICATIONS DENIED
0
$0
7
$121,303
55
$96,407
7
$22,703
7
$120,640
5
$109,736
APPLICATIONS WITHDRAWN
1
$232,000
5
$91,872
22
$110,042
6
$47,560
0
$0
1
$139,200
FILES CLOSED FOR INCOMPLETENESS
0
$0
3
$85,453
6
$73,273
1
$5,800
1
$104,400
0
$0
Aggregated Statistics For Year 2006 (Based on 2 partial tracts)
A) FHA, FSA/RHS & VA Home Purchase Loans
B) Conventional Home Purchase Loans
C) Refinancings
D) Home Improvement Loans
F) Non-occupant Loans on < 5 Family Dwellings (A B C & D)
G) Loans On Manufactured Home Dwelling (A B C & D)
Number
Average Value
Number
Average Value
Number
Average Value
Number
Average Value
Number
Average Value
Number
Average Value
LOANS ORIGINATED
5
$98,136
61
$87,076
113
$82,309
29
$44,960
8
$65,250
3
$130,307
APPLICATIONS APPROVED, NOT ACCEPTED
0
$0
6
$76,753
17
$117,911
1
$71,920
2
$49,300
0
$0
APPLICATIONS DENIED
0
$0
13
$85,037
64
$95,809
22
$36,118
0
$0
5
$73,776
APPLICATIONS WITHDRAWN
1
$103,240
5
$112,288
35
$111,360
3
$95,120
1
$88,160
1
$174,000
FILES CLOSED FOR INCOMPLETENESS
1
$114,840
0
$0
16
$122,090
1
$70,760
0
$0
0
$0
Aggregated Statistics For Year 2005 (Based on 2 partial tracts)
A) FHA, FSA/RHS & VA Home Purchase Loans
B) Conventional Home Purchase Loans
C) Refinancings
D) Home Improvement Loans
F) Non-occupant Loans on < 5 Family Dwellings (A B C & D)
G) Loans On Manufactured Home Dwelling (A B C & D)
Number
Average Value
Number
Average Value
Number
Average Value
Number
Average Value
Number
Average Value
Number
Average Value
LOANS ORIGINATED
10
$123,540
56
$82,319
133
$96,254
34
$27,396
9
$84,680
5
$80,272
APPLICATIONS APPROVED, NOT ACCEPTED
0
$0
7
$69,931
27
$97,569
5
$24,592
0
$0
2
$128,180
APPLICATIONS DENIED
1
$80,040
15
$75,477
92
$100,227
12
$36,057
0
$0
8
$82,940
APPLICATIONS WITHDRAWN
3
$98,213
3
$82,747
46
$103,366
1
$236,640
0
$0
1
$81,200
FILES CLOSED FOR INCOMPLETENESS
0
$0
3
$91,640
27
$126,526
1
$20,880
0
$0
1
$164,720
Aggregated Statistics For Year 2004 (Based on 2 partial tracts)
A) FHA, FSA/RHS & VA Home Purchase Loans
B) Conventional Home Purchase Loans
C) Refinancings
D) Home Improvement Loans
F) Non-occupant Loans on < 5 Family Dwellings (A B C & D)
G) Loans On Manufactured Home Dwelling (A B C & D)
Number
Average Value
Number
Average Value
Number
Average Value
Number
Average Value
Number
Average Value
Number
Average Value
LOANS ORIGINATED
12
$94,153
68
$108,938
169
$89,279
35
$36,258
3
$91,640
10
$66,584
APPLICATIONS APPROVED, NOT ACCEPTED
0
$0
10
$101,732
28
$109,206
1
$197,200
1
$98,600
2
$129,920
APPLICATIONS DENIED
6
$63,993
15
$107,029
80
$98,440
16
$43,718
5
$107,416
5
$38,048
APPLICATIONS WITHDRAWN
0
$0
3
$148,480
35
$93,662
2
$50,460
2
$83,520
0
$0
FILES CLOSED FOR INCOMPLETENESS
0
$0
2
$110,780
27
$106,161
0
$0
0
$0
0
$0
Aggregated Statistics For Year 2003 (Based on 2 partial tracts)
A) FHA, FSA/RHS & VA Home Purchase Loans
B) Conventional Home Purchase Loans
C) Refinancings
D) Home Improvement Loans
F) Non-occupant Loans on < 5 Family Dwellings (A B C & D)
Number
Average Value
Number
Average Value
Number
Average Value
Number
Average Value
Number
Average Value
LOANS ORIGINATED
7
$104,731
51
$99,214
362
$83,908
31
$29,524
9
$41,116
APPLICATIONS APPROVED, NOT ACCEPTED
0
$0
7
$90,811
28
$97,606
7
$48,554
0
$0
APPLICATIONS DENIED
1
$56,840
8
$53,215
77
$83,053
9
$18,302
0
$0
APPLICATIONS WITHDRAWN
0
$0
5
$80,504
30
$85,144
0
$0
1
$71,920
FILES CLOSED FOR INCOMPLETENESS
0
$0
0
$0
7
$73,743
0
$0
0
$0
Aggregated Statistics For Year 2002 (Based on 2 partial tracts)
A) FHA, FSA/RHS & VA Home Purchase Loans
B) Conventional Home Purchase Loans
C) Refinancings
D) Home Improvement Loans
F) Non-occupant Loans on < 5 Family Dwellings (A B C & D)
Number
Average Value
Number
Average Value
Number
Average Value
Number
Average Value
Number
Average Value
LOANS ORIGINATED
16
$92,872
60
$106,585
281
$85,786
29
$20,360
2
$75,400
APPLICATIONS APPROVED, NOT ACCEPTED
0
$0
6
$146,547
22
$106,087
3
$15,467
0
$0
APPLICATIONS DENIED
1
$131,080
8
$150,075
59
$87,216
6
$46,400
2
$58,000
APPLICATIONS WITHDRAWN
2
$94,540
3
$121,800
29
$92,800
0
$0
0
$0
FILES CLOSED FOR INCOMPLETENESS
0
$0
1
$147,320
8
$90,625
0
$0
0
$0
Aggregated Statistics For Year 2001 (Based on 2 partial tracts)
A) FHA, FSA/RHS & VA Home Purchase Loans
B) Conventional Home Purchase Loans
C) Refinancings
D) Home Improvement Loans
F) Non-occupant Loans on < 5 Family Dwellings (A B C & D)
Number
Average Value
Number
Average Value
Number
Average Value
Number
Average Value
Number
Average Value
LOANS ORIGINATED
12
$86,613
57
$92,169
203
$78,783
67
$23,737
10
$43,848
APPLICATIONS APPROVED, NOT ACCEPTED
0
$0
6
$75,400
28
$78,217
8
$26,390
1
$109,040
APPLICATIONS DENIED
1
$98,600
15
$53,128
60
$78,667
17
$11,191
1
$49,880
APPLICATIONS WITHDRAWN
2
$101,500
6
$127,793
41
$67,506
1
$11,600
1
$56,840
FILES CLOSED FOR INCOMPLETENESS
1
$89,320
0
$0
8
$78,010
0
$0
0
$0
Aggregated Statistics For Year 2000 (Based on 2 partial tracts)
A) FHA, FSA/RHS & VA Home Purchase Loans
B) Conventional Home Purchase Loans
C) Refinancings
D) Home Improvement Loans
F) Non-occupant Loans on < 5 Family Dwellings (A B C & D)
Number
Average Value
Number
Average Value
Number
Average Value
Number
Average Value
Number
Average Value
LOANS ORIGINATED
9
$83,262
80
$73,268
92
$65,868
56
$19,575
2
$46,400
APPLICATIONS APPROVED, NOT ACCEPTED
2
$84,680
5
$77,488
20
$93,496
8
$23,055
1
$30,160
APPLICATIONS DENIED
2
$78,300
17
$49,129
48
$74,095
16
$17,328
1
$92,800
APPLICATIONS WITHDRAWN
1
$73,080
1
$69,600
31
$85,728
5
$54,752
0
$0
FILES CLOSED FOR INCOMPLETENESS
0
$0
2
$30,160
6
$66,313
0
$0
0
$0
Aggregated Statistics For Year 1999 (Based on 1 partial tract)
A) FHA, FSA/RHS & VA Home Purchase Loans
B) Conventional Home Purchase Loans
C) Refinancings
D) Home Improvement Loans
F) Non-occupant Loans on < 5 Family Dwellings (A B C & D)
Detailed PMIC statistics for the following Tracts:2853.00
2002 - 2018 National Fire Incident Reporting System (NFIRS) incidents
Based on the data from the years 2002 - 2018 the average number of fire incidents per year is 8. The highest number of reported fires - 14 took place in 2017, and the least - 0 in 2015. The data has a decreasing trend.
When looking into fire subcategories, the most incidents belonged to: Outside Fires (41.4%), and Structure Fires (35.0%).
Fire incident types reported to NFIRS in Zip Code 48747


 Nearest zip codes: 48708, 48732, 48757, 48734, 48601, 48733.


 Based on the data from the years 2002 - 2018 the average number of fire incidents per year is 8. The highest number of reported fires - 14 took place in 2017, and the least - 0 in 2015. The data has a decreasing trend.
 When looking into fire subcategories, the most incidents belonged to: Outside Fires (41.4%), and Structure Fires (35.0%).