Estimated zip code population in 2022: 1,569 Zip code population in 2010: 1,758 Zip code population in 2000: 2,005
Houses and condos: 787 Renter-occupied apartments: 119
% of renters here:
17%
State:
27%
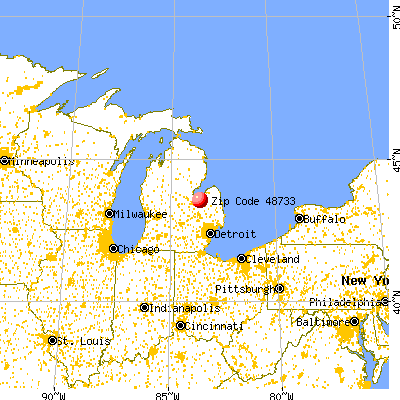
March 2022 cost of living index in zip code 48733: 80.5 (low, U.S. average is 100)
Land area: 49.1 sq. mi. Water area: 1.0 sq. mi.
Population density: 32 people per square mile
(very low).
OSM Map
General Map
Google Map
MSN Map
OSM Map
General Map
Google Map
MSN Map
OSM Map
General Map
Google Map
MSN Map
OSM Map
General Map
Google Map
MSN Map
Please wait while loading the map...
Real estate property taxes paid for housing units in 2022:
This zip code:
1.6% ($1,547)
Michigan:
1.2% ($2,746)
Median real estate property taxes paid for housing units with mortgages in 2022: $1,544 (1.7%) Median real estate property taxes paid for housing units with no mortgage in 2022: $1,562 (1.4%)
Business Search- 14 Million verified businesses
Males: 706
(45.0%)
Females: 862
(55.0%)
For population 25 years and over in 48733:
High school or higher: 88.4%
Bachelor's degree or higher: 13.3%
Graduate or professional degree: 4.3%
Unemployed: 2.4%
Mean travel time to work (commute): 23.2 minutes
For population 15 years and over in 48733:
Never married: 24.0%
Now married: 49.4%
Separated: 1.5%
Widowed: 9.2%
Divorced: 15.9%
Zip code 48733 compared to state average:
Median house value significantly below state average.
Unemployed percentage below state average.
Black race population percentage significantly below state average.
Median age above state average.
Foreign-born population percentage significantly below state average.
Renting percentage below state average.
Length of stay since moving in significantly above state average.
House age above state average.
Number of college students below state average.
Percentage of population with a bachelor's degree or higher significantly below state average.
Averages for the 2020 tax year for zip code 48733, filed in 2021:
Average Adjusted Gross Income (AGI) in 2020: $49,049 (Individual Income Tax Returns)
Here:
$49,049
State:
$68,945
Salary/wage: $39,783 (reported on 76.2% of returns)
Here:
$39,783
State:
$57,142
(% of AGI for various income ranges: 1013.5% for AGIs below $25k, 3483.3% for AGIs $25k-50k, 6224.4% for AGIs $50k-75k, 10436.0% for AGIs $75k-100k, 15860.0% for AGIs $100k-200k)
Taxable interest for individuals: $772 (reported on 29.8% of returns)
This zip code:
$772
Michigan:
$1,630
(% of AGI for various income ranges: 14.0% for AGIs below $25k, 25.0% for AGIs $25k-50k, 74.4% for AGIs $50k-75k, 16.0% for AGIs $75k-100k, 112.5% for AGIs $100k-200k)
Ordinary dividends: $1,531 (reported on 15.5% of returns)
Here:
$1,531
State:
$6,972
(% of AGI for various income ranges: 5.0% for AGIs below $25k, 21.7% for AGIs $25k-50k, 53.3% for AGIs $50k-75k, 255.0% for AGIs $100k-200k)
Net capital gain/loss in AGI: +$3,782 (reported on 13.1% of returns)
Here:
+$3,782
State:
+$20,064
(% of AGI for various income ranges: 26.1% for AGIs $25k-50k, 85.6% for AGIs $50k-75k, 730.0% for AGIs $100k-200k)
Profit/loss from business: +$6,920 (reported on 11.9% of returns)
Here:
+$6,920
State:
+$11,172
(% of AGI for various income ranges: 115.0% for AGIs below $25k, 60.6% for AGIs $25k-50k, 46.7% for AGIs $50k-75k, 622.0% for AGIs $75k-100k)
Taxable individual retirement arrangement distribution: $8,022 (reported on 10.7% of returns)
48733:
$8,022
Michigan:
$19,803
(% of AGI for various income ranges: 51.5% for AGIs below $25k, 197.8% for AGIs $25k-50k, 526.0% for AGIs $75k-100k)
Earned income credit: $2,118 (reported on 13.1% of returns)
Here:
$2,118
State:
$2,251
(% of AGI for various income ranges: 64.0% for AGIs below $25k, 58.3% for AGIs $25k-50k)
Percentage of individuals using paid preparers for their 2020 taxes: 94.0%
Here:
94%
State:
93%
(% for various income ranges: 92.9% for AGIs below $25k, 96.2% for AGIs $25k-50k, 92.3% for AGIs $50k-75k, 88.9% for AGIs $75k-100k, 100.0% for AGIs $100k-200k)
Averages for the 2012 tax year for zip code 48733, filed in 2013:
Average Adjusted Gross Income (AGI) in 2012: $43,625 (Individual Income Tax Returns)
Here:
$43,625
State:
$55,609
Salary/wage: $30,901 (reported on 84.0% of returns)
Here:
$30,901
State:
$46,782
(% of AGI for various income ranges: 57.6% for AGIs below $25k, 61.6% for AGIs $25k-50k, 71.1% for AGIs $50k-75k, 69.1% for AGIs $75k-100k, 42.1% for AGIs $100k-200k)
Taxable interest for individuals: $1,382 (reported on 34.6% of returns)
This zip code:
$1,382
Michigan:
$1,491
(% of AGI for various income ranges: 1.7% for AGIs below $25k, 1.6% for AGIs $25k-50k, 0.5% for AGIs $50k-75k, 1.3% for AGIs $75k-100k, 0.7% for AGIs $100k-200k)
Ordinary dividends: $1,612 (reported on 19.8% of returns)
Here:
$1,612
State:
$6,225
(% of AGI for various income ranges: 0.7% for AGIs below $25k, 0.7% for AGIs $25k-50k, 0.9% for AGIs $50k-75k, 1.1% for AGIs $100k-200k)
Net capital gain/loss in AGI: +$1,236 (reported on 13.6% of returns)
Here:
+$1,236
State:
+$9,326
(% of AGI for various income ranges: 0.3% for AGIs $25k-50k, 0.2% for AGIs $50k-75k, 1.0% for AGIs $100k-200k)
Profit/loss from business: +$4,500 (reported on 12.3% of returns)
Here:
+$4,500
State:
+$11,523
(% of AGI for various income ranges: 5.6% for AGIs below $25k, 1.5% for AGIs $25k-50k, 1.2% for AGIs $50k-75k)
Taxable individual retirement arrangement distribution: $8,662 (reported on 9.9% of returns)
48733:
$8,662
Michigan:
$15,298
(% of AGI for various income ranges: 1.9% for AGIs below $25k, 4.1% for AGIs $25k-50k, 4.5% for AGIs $75k-100k)
Total itemized deductions: $16,414 (20% of AGI, reported on 17.3% of returns)
Here:
$16,414
State:
$21,628
Here:
20.3% of AGI
State:
18.4% of AGI
(% of AGI for various income ranges: 7.7% for AGIs $25k-50k, 6.9% for AGIs $50k-75k, 6.8% for AGIs $75k-100k, 7.8% for AGIs $100k-200k)
Charity contributions: $3,645 (reported on 13.6% of returns)
Here:
$3,645
State:
$4,225
(% of AGI for various income ranges: 1.1% for AGIs $25k-50k, 1.2% for AGIs $50k-75k, 1.1% for AGIs $75k-100k, 1.7% for AGIs $100k-200k)
Taxes paid: $4,964 (reported on 17.3% of returns)
48733:
$4,964
State:
$8,327
(% of AGI for various income ranges: 1.8% for AGIs $25k-50k, 1.7% for AGIs $50k-75k, 2.4% for AGIs $75k-100k, 2.9% for AGIs $100k-200k)
Earned income credit: $1,800 (reported on 19.8% of returns)
Here:
$1,800
State:
$2,306
(% of AGI for various income ranges: 4.8% for AGIs below $25k, 1.1% for AGIs $25k-50k)
Percentage of individuals using paid preparers for their 2012 taxes: 70.4%
Here:
70%
State:
57%
(% for various income ranges: 64.7% for AGIs below $25k, 72.7% for AGIs $25k-50k, 75.0% for AGIs $50k-75k, 71.4% for AGIs $75k-100k, 83.3% for AGIs $100k-200k)
Averages for the 2004 tax year for zip code 48733, filed in 2005:
Average Adjusted Gross Income (AGI) in 2004: $35,959 (Individual Income Tax Returns)
Here:
$35,959
State:
$48,204
Salary/wage: $29,798 (reported on 83.0% of returns)
Here:
$29,798
State:
$42,791
(% of AGI for various income ranges: 87.3% for AGIs below $10k, 59.9% for AGIs $10k-25k, 70.1% for AGIs $25k-50k, 75.2% for AGIs $50k-75k, 79.7% for AGIs $75k-100k, 49.5% for AGIs over 100k)
Taxable interest for individuals: $1,478 (reported on 52.6% of returns)
This zip code:
$1,478
Michigan:
$1,725
(% of AGI for various income ranges: 8.4% for AGIs below $10k, 3.7% for AGIs $10k-25k, 2.1% for AGIs $25k-50k, 1.4% for AGIs $50k-75k, 1.3% for AGIs $75k-100k, 2.2% for AGIs over 100k)
Taxable dividends: $2,276 (reported on 23.0% of returns)
Here:
$2,276
State:
$3,420
(% of AGI for various income ranges: 2.5% for AGIs below $10k, 1.0% for AGIs $10k-25k, 0.6% for AGIs $25k-50k, 0.6% for AGIs $50k-75k, 0.5% for AGIs $75k-100k, 5.7% for AGIs over 100k)
Net capital gain/loss: +$973 (reported on 17.5% of returns)
Here:
+$973
State:
+$8,532
(% of AGI for various income ranges: -0.6% for AGIs below $10k, -0.5% for AGIs $10k-25k, 0.4% for AGIs $25k-50k, 0.2% for AGIs $50k-75k, 1.2% for AGIs $75k-100k, 1.2% for AGIs over 100k)
Profit/loss from business: +$2,756 (reported on 14.9% of returns)
Here:
+$2,756
State:
+$9,547
(% of AGI for various income ranges: 3.9% for AGIs below $10k, 1.3% for AGIs $10k-25k, 2.1% for AGIs $25k-50k, -0.1% for AGIs $50k-75k, 1.9% for AGIs $75k-100k)
IRA payment deduction: $3,778 (reported on 3.2% of returns)
48733:
$3,778
Michigan:
$2,875
Total itemized deductions: $13,360 (23% of AGI, reported on 21.8% of returns)
Here:
$13,360
State:
$18,509
Here:
23.3% of AGI
State:
20.7% of AGI
(% of AGI for various income ranges: 9.5% for AGIs $10k-25k, 7.9% for AGIs $25k-50k, 8.5% for AGIs $50k-75k, 7.6% for AGIs $75k-100k, 8.4% for AGIs over 100k)
Charity contributions deductions: $2,573 (4% of AGI, reported on 18.4% of returns)
Here:
$2,573
State:
$3,365
Here:
4.2% of AGI
State:
3.6% of AGI
(% of AGI for various income ranges: 1.2% for AGIs $10k-25k, 0.9% for AGIs $25k-50k, 1.4% for AGIs $50k-75k, 1.3% for AGIs $75k-100k, 2.1% for AGIs over 100k)
Total tax: $4,214 (reported on 74.6% of returns)
48733:
$4,214
State:
$7,691
(% of AGI for various income ranges: 2.5% for AGIs below $10k, 3.8% for AGIs $10k-25k, 6.4% for AGIs $25k-50k, 8.8% for AGIs $50k-75k, 11.2% for AGIs $75k-100k, 15.5% for AGIs over 100k)
Earned income credit: $1,638 (reported on 15.3% of returns)
Here:
$1,638
State:
$1,737
Percentage of individuals using paid preparers for their 2004 taxes: 70.0%
Here:
70%
State:
60%
(% for various income ranges: 68.0% for AGIs below $10k, 65.8% for AGIs $10k-25k, 73.1% for AGIs $25k-50k, 69.2% for AGIs $50k-75k, 69.5% for AGIs $75k-100k, 90.3% for AGIs over 100k)
Household received Food Stamps/SNAP in the past 12 months: 90 Household did not receive Food Stamps/SNAP in the past 12 months: 592
Women who had a birth in the past 12 months: 13 (13 now married, 0 unmarried) Women who did not have a birth in the past 12 months: 359 (138 now married, 220 unmarried)
Housing units in zip code 48733 with a mortgage: 261 (12 second mortgage, 11 both second mortgage and home equity loan) Median monthly owner costs for units with a mortgage: $921 Median monthly owner costs for units without a mortgage: $504
Residents with income below the poverty level in 2022:
This zip code:
11.2%
Whole state:
13.4%
Residents with income below 50% of the poverty level in 2022:
This zip code:
8.2%
Whole state:
6.9%
Median number of rooms in houses and condos:
Here:
6.3
State:
6.5
Median number of rooms in apartments:
Here:
6.0
State:
4.3
Notable locations in this zip code not listed on our city pages
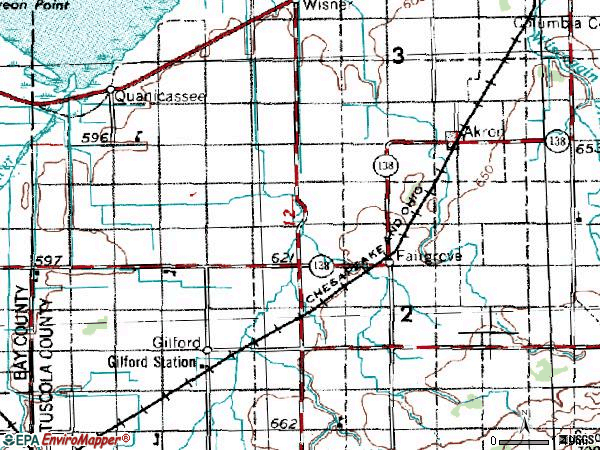
Notable locations in zip code 48733: Gilford Station (A), Fairgrove Station (B), Fairgrove Mobile Medical Response (C), Fairgrove Township Library (D), Fairgrove Fire Department (E), Fairgrove Police Department (F). Display/hide their locations on the map
Churches in zip code 48733 include: Church of the Nazarene (A), Fairgrove Church (B), Grace Church (C), Saint Jude Church (D), First Presbyterian Church (E), United Methodist Church (F). Display/hide their locations on the map
Parks in zip code 48733 include: Vanderbilt Park (1), Gilford Park (2), Gilford United Methodist Church Historical Marker (3), Gilford Park (4). Display/hide their locations on the map
In group quarters: 6 (-1 institutionalized population)
Size of family households: 228 2-persons, 64 3-persons, 80 4-persons, 16 5-persons, 6 6-persons, 10 7-or-more-persons
Size of nonfamily households: 247 1-person, 31 2-persons
214 married couples with children.
49 single-parent households (49 women).
94.5% of residents of 48733 zip code speak English at home.
4.8% of residents speak Spanish at home (42% very well, 10% well, 49% not at all).
0.8% of residents speak other Indo-European language at home (100% very well).
0.3% of residents speak other language at home (100% very well).
Foreign born population: 43 (2.8%) (32.9% of them are naturalized citizens)
This zip code:
2.8%
Whole state:
6.9%
52%Barbados
9%Honduras
7%Japan
7%Cabo Verde
2%France
29%German
19%English
12%American
5%Polish
4%Irish
3%French Canadian
1%French
Year of entry for the foreign-born population
302010 or later
02000 to 2009
61990 to 1999
15Before 1990
Facilities with environmental interests located in this zip code:
AKRON-FAIRGROVE JR/SR HIGH SCHOOL (2800 N. THOMAS ROAD in FAIRGROVE, MI)
(National Center for Education Statistics) - STATE ID-00034 Organizations: AKRON-FAIRGROVE SCHOOLS (SCHOOL DISTRICT)
AGRICO FARM CENTER (7 HINSON ROAD in FAIRGROVE, MI)
COMPLIANCE ACTIVITY (Tracking inspections of insecticide, fungicide, and rodenticide, and toxic substances) (Resource Conservation and Recovery Act (tracking hazardous waste)) Organizations: CROP PRODUCTION SERVICES INC (CONTACT/OPERATOR)
Alternative names: CROP PRODUCTION SERV
FAIRGROVE OIL CO (1788 MAIN ST in FAIRGROVE, MI)
(Resource Conservation and Recovery Act (tracking hazardous waste))
AKRON FAIRGROVE BUS GARAGE (2800 N THOMAS RD in FAIRGROVE, MI)
Conditionally Exempt Small Quantity Generators, less than 100 kg/month of hazardous waste (Resource Conservation and Recovery Act (tracking hazardous waste)) Organizations: AKRON FAIRGROVE SCHOOLS (CONTACT/OWNER)
Housing units lacking complete plumbing facilities: 1.3% Housing units lacking complete kitchen facilities: 1.1%
44.9%Bottled, tank, or LP gas
33.3%Utility gas
8.8%Electricity
5.7%Fuel oil, kerosene, etc.
5.2%Wood
2.2%Other fuel
Population in 1990: 3,175.
Place of birth for U.S.-born residents:
This state: 1,420
Northeast: 5
Midwest: 15
South: 57
West: 13
73% of the 48733 zip code residents lived in the same house 5 years ago. Out of people who lived in different houses, 69% lived in this county. Out of people who lived in different counties, 50% lived in Michigan.
95% of the 48733 zip code residents lived in the same house 1 year ago. Out of people who lived in different houses, 47% moved from this county. Out of people who lived in different houses, 31% moved from different county within same state. Out of people who lived in different houses, 18% moved from different state. Out of people who lived in different houses, 7% moved from abroad.
Private vs. public school enrollment:
Students in private schools in grades 1 to 8 (elementary and middle school): 6
Here:
4.9%
Michigan:
12.4%
Students in private schools in grades 9 to 12 (high school): 7
Here:
7.6%
Michigan:
9.8%
Students in private undergraduate colleges:
Here:
0.0%
Michigan:
14.9%
Occupation by median earnings in the past 12 months ($)
64,122Business and financial operations occupations
61,062Health technologists and technicians
60,154Health diagnosing and treating practitioners and other technical occupations
56,181Education, training, and library occupations
52,694Construction and extraction occupations
50,696Life, physical, and social science occupations
Top industries in this zip code by the number of employees in 2005:
Other Services (except Public Administration): Funeral Homes and Funeral Services (10-19 employees: 1 establishment)
Other Services (except Public Administration): Religious Organizations (5-9: 1, 1-4: 2)
Wholesale Trade: Grain and Field Bean Merchant Wholesalers (5-9: 1)
Accommodation and Food Services: Limited-Service Restaurants (5-9: 1)
Accommodation and Food Services: Full-Service Restaurants (5-9: 1)
Arts, Entertainment, and Recreation: Marinas (5-9: 1)
Construction: Site Preparation Contractors (1-4: 2)
People in group quarters in 2010:
8 people in group homes intended for adults
People in group quarters in 2000:
22 people in agriculture workers' dormitories on farms
12 people in homes for the mentally retarded
7 people in other group homes
2 people in unknown juvenile institutions
2 people in other noninstitutional group quarters
2002 - 2018 National Fire Incident Reporting System (NFIRS) incidents
Based on the data from the years 2002 - 2018 the average number of fire incidents per year is 9. The highest number of reported fires - 22 took place in 2005, and the least - 1 in 2016. The data has a decreasing trend.
When looking into fire subcategories, the most incidents belonged to: Structure Fires (53.4%), and Outside Fires (35.1%).
Fire incident types reported to NFIRS in Zip Code 48733


 Nearest zip codes: 48701, 48757, 48768, 48747, 48767, 48723.


 Based on the data from the years 2002 - 2018 the average number of fire incidents per year is 9. The highest number of reported fires - 22 took place in 2005, and the least - 1 in 2016. The data has a decreasing trend.
 When looking into fire subcategories, the most incidents belonged to: Structure Fires (53.4%), and Outside Fires (35.1%).