Estimated zip code population in 2022: 2,070 Zip code population in 2010: 2,162 Zip code population in 2000: 2,298
Houses and condos: 1,010 Renter-occupied apartments: 127
% of renters here:
14%
State:
27%
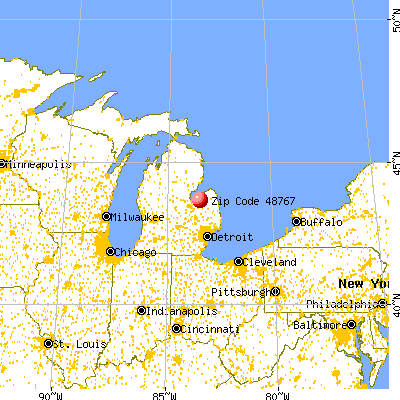
March 2022 cost of living index in zip code 48767: 80.6 (low, U.S. average is 100)
Land area: 74.4 sq. mi. Water area: 10.4 sq. mi.
Population density: 28 people per square mile
(very low).
OSM Map
General Map
Google Map
MSN Map
OSM Map
General Map
Google Map
MSN Map
OSM Map
General Map
Google Map
MSN Map
OSM Map
General Map
Google Map
MSN Map
Please wait while loading the map...
Real estate property taxes paid for housing units in 2022:
This zip code:
1.2% ($1,618)
Michigan:
1.2% ($2,746)
Median real estate property taxes paid for housing units with mortgages in 2022: $1,882 (1.4%) Median real estate property taxes paid for housing units with no mortgage in 2022: $1,416 (1.1%)
Business Search- 14 Million verified businesses
Males: 1,099
(53.1%)
Females: 970
(46.9%)
For population 25 years and over in 48767:
High school or higher: 93.1%
Bachelor's degree or higher: 12.4%
Graduate or professional degree: 2.9%
Unemployed: 0.8%
Mean travel time to work (commute): 25.4 minutes
For population 15 years and over in 48767:
Never married: 22.4%
Now married: 58.4%
Separated: 0.2%
Widowed: 5.6%
Divorced: 13.4%
Zip code 48767 compared to state average:
Median house value below state average.
Unemployed percentage significantly below state average.
Black race population percentage significantly below state average.
Median age significantly above state average.
Foreign-born population percentage significantly below state average.
Renting percentage below state average.
Length of stay since moving in significantly above state average.
House age above state average.
Percentage of population with a bachelor's degree or higher significantly below state average.
Estimated median house/condo value in 2022: $132,007
48767:
$132,007
Michigan:
$224,400
According to our research of Michigan and other state lists, there were 7 registered sex offenders living in 48767 zip code as of May 28, 2024. The ratio of all residents to sex offenders in zip code 48767 is 279 to 1. The ratio of registered sex offenders to all residents in this zip code is near the state average.
Median resident age:
This zip code:
49.8 years
Michigan median age:
40.3 years
Average household size:
This zip code:
2.3 people
Michigan:
2.4 people
Averages for the 2020 tax year for zip code 48767, filed in 2021:
Average Adjusted Gross Income (AGI) in 2020: $58,221 (Individual Income Tax Returns)
Here:
$58,221
State:
$68,945
Salary/wage: $47,987 (reported on 75.8% of returns)
Here:
$47,987
State:
$57,142
(% of AGI for various income ranges: 977.4% for AGIs below $25k, 3214.7% for AGIs $25k-50k, 5792.0% for AGIs $50k-75k, 9470.0% for AGIs $75k-100k, 18052.2% for AGIs $100k-200k)
Taxable interest for individuals: $812 (reported on 34.3% of returns)
This zip code:
$812
Michigan:
$1,630
(% of AGI for various income ranges: 18.4% for AGIs below $25k, 18.2% for AGIs $25k-50k, 62.0% for AGIs $50k-75k, 85.7% for AGIs $75k-100k, 97.8% for AGIs $100k-200k)
Ordinary dividends: $1,728 (reported on 18.2% of returns)
Here:
$1,728
State:
$6,972
(% of AGI for various income ranges: 10.0% for AGIs below $25k, 23.5% for AGIs $25k-50k, 56.0% for AGIs $50k-75k, 128.6% for AGIs $75k-100k, 117.8% for AGIs $100k-200k)
Net capital gain/loss in AGI: +$3,772 (reported on 18.2% of returns)
Here:
+$3,772
State:
+$20,064
(% of AGI for various income ranges: 14.1% for AGIs $25k-50k, 182.0% for AGIs $50k-75k, 145.7% for AGIs $75k-100k, 413.3% for AGIs $100k-200k)
Profit/loss from business: +$5,382 (reported on 11.1% of returns)
Here:
+$5,382
State:
+$11,172
(% of AGI for various income ranges: 50.0% for AGIs below $25k, 85.3% for AGIs $25k-50k, 36.0% for AGIs $50k-75k, 351.1% for AGIs $100k-200k)
Taxable individual retirement arrangement distribution: $11,227 (reported on 11.1% of returns)
48767:
$11,227
Michigan:
$19,803
(% of AGI for various income ranges: 147.9% for AGIs below $25k, 220.0% for AGIs $50k-75k, 475.7% for AGIs $75k-100k, 445.6% for AGIs $100k-200k)
Earned income credit: $1,683 (reported on 12.1% of returns)
Here:
$1,683
State:
$2,251
(% of AGI for various income ranges: 53.7% for AGIs below $25k, 58.8% for AGIs $25k-50k)
Percentage of individuals using paid preparers for their 2020 taxes: 92.9%
Here:
93%
State:
93%
(% for various income ranges: 93.5% for AGIs below $25k, 91.3% for AGIs $25k-50k, 93.3% for AGIs $50k-75k, 91.7% for AGIs $75k-100k, 94.4% for AGIs $100k-200k)
Averages for the 2012 tax year for zip code 48767, filed in 2013:
Average Adjusted Gross Income (AGI) in 2012: $50,107 (Individual Income Tax Returns)
Here:
$50,107
State:
$55,609
Salary/wage: $40,790 (reported on 80.8% of returns)
Here:
$40,790
State:
$46,782
(% of AGI for various income ranges: 59.2% for AGIs below $25k, 68.6% for AGIs $25k-50k, 73.1% for AGIs $50k-75k, 70.1% for AGIs $75k-100k, 59.3% for AGIs $100k-200k)
Taxable interest for individuals: $985 (reported on 40.4% of returns)
This zip code:
$985
Michigan:
$1,491
(% of AGI for various income ranges: 1.7% for AGIs below $25k, 1.1% for AGIs $25k-50k, 1.1% for AGIs $50k-75k, 0.6% for AGIs $75k-100k, 0.4% for AGIs $100k-200k)
Ordinary dividends: $1,395 (reported on 21.2% of returns)
Here:
$1,395
State:
$6,225
(% of AGI for various income ranges: 1.1% for AGIs below $25k, 1.0% for AGIs $25k-50k, 0.3% for AGIs $50k-75k, 0.7% for AGIs $75k-100k, 0.4% for AGIs $100k-200k)
Net capital gain/loss in AGI: +$2,107 (reported on 15.2% of returns)
Here:
+$2,107
State:
+$9,326
(% of AGI for various income ranges: 0.5% for AGIs $25k-50k, 0.3% for AGIs $75k-100k, 1.5% for AGIs $100k-200k)
Profit/loss from business: +$3,108 (reported on 12.1% of returns)
Here:
+$3,108
State:
+$11,523
(% of AGI for various income ranges: 2.9% for AGIs below $25k, 0.9% for AGIs $25k-50k, 1.6% for AGIs $50k-75k)
Taxable individual retirement arrangement distribution: $9,525 (reported on 12.1% of returns)
48767:
$9,525
Michigan:
$15,298
(% of AGI for various income ranges: 3.6% for AGIs below $25k, 2.4% for AGIs $25k-50k, 1.8% for AGIs $50k-75k, 6.7% for AGIs $75k-100k)
Total itemized deductions: $17,044 (19% of AGI, reported on 18.2% of returns)
Here:
$17,044
State:
$21,628
Here:
19.3% of AGI
State:
18.4% of AGI
(% of AGI for various income ranges: 6.7% for AGIs below $25k, 4.4% for AGIs $25k-50k, 4.8% for AGIs $50k-75k, 4.4% for AGIs $75k-100k, 8.8% for AGIs $100k-200k)
Charity contributions: $4,580 (reported on 15.2% of returns)
Here:
$4,580
State:
$4,225
(% of AGI for various income ranges: 0.7% for AGIs $25k-50k, 1.4% for AGIs $50k-75k, 0.9% for AGIs $75k-100k, 2.3% for AGIs $100k-200k)
Taxes paid: $5,517 (reported on 18.2% of returns)
48767:
$5,517
State:
$8,327
(% of AGI for various income ranges: 1.1% for AGIs below $25k, 1.2% for AGIs $25k-50k, 1.3% for AGIs $50k-75k, 1.5% for AGIs $75k-100k, 3.3% for AGIs $100k-200k)
Earned income credit: $1,760 (reported on 10.1% of returns)
Here:
$1,760
State:
$2,306
(% of AGI for various income ranges: 3.1% for AGIs below $25k, 0.5% for AGIs $25k-50k)
Percentage of individuals using paid preparers for their 2012 taxes: 69.7%
Here:
70%
State:
57%
(% for various income ranges: 65.7% for AGIs below $25k, 70.8% for AGIs $25k-50k, 70.6% for AGIs $50k-75k, 80.0% for AGIs $75k-100k, 69.2% for AGIs $100k-200k)
Averages for the 2004 tax year for zip code 48767, filed in 2005:
Average Adjusted Gross Income (AGI) in 2004: $36,145 (Individual Income Tax Returns)
Here:
$36,145
State:
$48,204
Salary/wage: $33,024 (reported on 83.1% of returns)
Here:
$33,024
State:
$42,791
(% of AGI for various income ranges: 95.7% for AGIs below $10k, 67.7% for AGIs $10k-25k, 71.3% for AGIs $25k-50k, 79.8% for AGIs $50k-75k, 84.3% for AGIs $75k-100k, 72.4% for AGIs over 100k)
Taxable interest for individuals: $1,282 (reported on 51.7% of returns)
This zip code:
$1,282
Michigan:
$1,725
(% of AGI for various income ranges: 4.5% for AGIs below $10k, 3.4% for AGIs $10k-25k, 1.7% for AGIs $25k-50k, 1.4% for AGIs $50k-75k, 0.8% for AGIs $75k-100k, 2.4% for AGIs over 100k)
Taxable dividends: $904 (reported on 21.5% of returns)
Here:
$904
State:
$3,420
(% of AGI for various income ranges: 2.7% for AGIs below $10k, 0.8% for AGIs $10k-25k, 0.7% for AGIs $25k-50k, 0.5% for AGIs $50k-75k, 0.2% for AGIs $75k-100k, 0.1% for AGIs over 100k)
Net capital gain/loss: +$4,142 (reported on 16.5% of returns)
Here:
+$4,142
State:
+$8,532
(% of AGI for various income ranges: -4.6% for AGIs below $10k, -0.2% for AGIs $10k-25k, 1.0% for AGIs $25k-50k, 0.4% for AGIs $50k-75k, 0.7% for AGIs $75k-100k, 10.6% for AGIs over 100k)
Profit/loss from business: +$2,968 (reported on 14.6% of returns)
Here:
+$2,968
State:
+$9,547
(% of AGI for various income ranges: -3.4% for AGIs below $10k, 2.9% for AGIs $10k-25k, 2.7% for AGIs $25k-50k, -0.1% for AGIs $50k-75k, 0.9% for AGIs $75k-100k)
Profit/loss from farming: +$984 (reported on 5.8% of returns)
Here:
+$984
State:
-$4,492
(% of AGI for various income ranges: 6.2% for AGIs below $10k, 0.0% for AGIs $25k-50k, 0.0% for AGIs $50k-75k, 0.3% for AGIs $75k-100k)
IRA payment deduction: $3,103 (reported on 2.7% of returns)
48767:
$3,103
Michigan:
$2,875
Total itemized deductions: $14,728 (24% of AGI, reported on 22.4% of returns)
Here:
$14,728
State:
$18,509
Here:
23.8% of AGI
State:
20.7% of AGI
(% of AGI for various income ranges: 11.1% for AGIs $10k-25k, 6.8% for AGIs $25k-50k, 7.4% for AGIs $50k-75k, 10.4% for AGIs $75k-100k, 14.8% for AGIs over 100k)
Charity contributions deductions: $2,554 (4% of AGI, reported on 18.9% of returns)
Here:
$2,554
State:
$3,365
Here:
3.9% of AGI
State:
3.6% of AGI
(% of AGI for various income ranges: 0.9% for AGIs $10k-25k, 0.8% for AGIs $25k-50k, 1.2% for AGIs $50k-75k, 1.7% for AGIs $75k-100k, 2.6% for AGIs over 100k)
Total tax: $3,974 (reported on 75.3% of returns)
48767:
$3,974
State:
$7,691
(% of AGI for various income ranges: 2.5% for AGIs below $10k, 4.4% for AGIs $10k-25k, 7.2% for AGIs $25k-50k, 7.7% for AGIs $50k-75k, 10.2% for AGIs $75k-100k, 13.3% for AGIs over 100k)
Earned income credit: $1,775 (reported on 11.2% of returns)
Here:
$1,775
State:
$1,737
Percentage of individuals using paid preparers for their 2004 taxes: 65.9%
Here:
66%
State:
60%
(% for various income ranges: 53.6% for AGIs below $10k, 66.5% for AGIs $10k-25k, 68.9% for AGIs $25k-50k, 73.8% for AGIs $50k-75k, 73.1% for AGIs $75k-100k, 60.0% for AGIs over 100k)
Household received Food Stamps/SNAP in the past 12 months: 62 Household did not receive Food Stamps/SNAP in the past 12 months: 838
Women who had a birth in the past 12 months: 9 (4 now married, 4 unmarried) Women who did not have a birth in the past 12 months: 344 (184 now married, 158 unmarried)
Housing units in zip code 48767 with a mortgage: 345 (40 second mortgage, 28 both second mortgage and home equity loan) Median monthly owner costs for units with a mortgage: $1,190 Median monthly owner costs for units without a mortgage: $496
Residents with income below the poverty level in 2022:
This zip code:
6.7%
Whole state:
13.4%
Residents with income below 50% of the poverty level in 2022:
This zip code:
3.4%
Whole state:
6.9%
Median number of rooms in houses and condos:
Here:
6.9
State:
6.5
Median number of rooms in apartments:
Here:
5.7
State:
4.3
Notable locations in this zip code not listed on our city pages
Notable locations in zip code 48767: Thomas Marina (A), Sunset Bay Marina Incorporated (B), Unionville Station (C), Colling Station (D), Columbia Corners (E), Unionville Town Hall (F), Akron - Columbia - Wisner Township Unionville Fire Department (G), Akron - Columbia - Wisner Township Unionville Ambulance Service (H), Columbia Township Library (I). Display/hide their locations on the map
Churches in zip code 48767 include: Colling Nazarene Church (A), Saint Paul Lutheran Church (B), Seventh Day Adventist Church (C), Colwood Church (D), Moravian Church (E), Saint Peters Church (F). Display/hide their locations on the map
Cemeteries: Columbia Township Cemetery (1), Moravian Cemetery (2), Columbia Cemetery (3), Hickory Highland Cemetery (4), Saint Peters Cemetery (5). Display/hide their locations on the map
In group quarters: 11 (-1 institutionalized population)
Size of family households: 359 2-persons, 83 3-persons, 89 4-persons, 31 5-persons, 22 6-persons, 4 7-or-more-persons
Size of nonfamily households: 261 1-person, 53 2-persons, 4 4-persons
265 married couples with children.
107 single-parent households (58 men, 49 women).
98.6% of residents of 48767 zip code speak English at home.
0.7% of residents speak Spanish at home (31% very well, 69% well).
0.9% of residents speak other Indo-European language at home (94% very well, 6% well).
Foreign born population: 10 (0.5%) (55.8% of them are naturalized citizens)
This zip code:
0.5%
Whole state:
6.9%
36%North Macedonia (Macedonia)
9%France
60%German
7%Polish
5%American
5%English
4%Irish
3%Hungarian
2%French Canadian
Year of entry for the foreign-born population
32010 or later
52000 to 2009
01990 to 1999
4Before 1990
Facilities with environmental interests located in this zip code:
MI DEPT/ENVIRONMENTAL QUALITY (WEST OF 51170 15TH AVE in UNIONVILLE, MI)
(Resource Conservation and Recovery Act (tracking hazardous waste)) Alternative names: MI DEPT/DEQ (E)
Housing units lacking complete plumbing facilities: 1.5% Housing units lacking complete kitchen facilities: 0.8%
40.9%Bottled, tank, or LP gas
37.1%Utility gas
7.9%Electricity
5.9%Wood
3.7%Fuel oil, kerosene, etc.
3.4%No fuel used
1.5%Other fuel
Population in 1990: 2,111. Population change in the 1990s: +187 (+8.9%).
Place of birth for U.S.-born residents:
This state: 1,898
Northeast: 9
Midwest: 54
South: 45
West: 43
74% of the 48767 zip code residents lived in the same house 5 years ago. Out of people who lived in different houses, 60% lived in this county. Out of people who lived in different counties, 50% lived in Michigan.
94% of the 48767 zip code residents lived in the same house 1 year ago. Out of people who lived in different houses, 22% moved from this county. Out of people who lived in different houses, 61% moved from different county within same state. Out of people who lived in different houses, 16% moved from different state. Out of people who lived in different houses, 3% moved from abroad.
Private vs. public school enrollment:
Students in private schools in grades 1 to 8 (elementary and middle school): 34
Here:
27.8%
Michigan:
12.4%
Students in private schools in grades 9 to 12 (high school): 3
Here:
3.7%
Michigan:
9.8%
Students in private undergraduate colleges: 11
Here:
11.6%
Michigan:
14.9%
Occupation by median earnings in the past 12 months ($)
85,899Business and financial operations occupations
84,789Health diagnosing and treating practitioners and other technical occupations
66,707Construction and extraction occupations
65,566Community and social service occupations
57,752Management occupations
50,824Installation, maintenance, and repair occupations
Top industries in this zip code by the number of employees in 2005:
Health Care and Social Assistance: Home Health Care Services (20-49 employees: 1 establishment)
Health Care and Social Assistance: Ambulance Services (10-19: 1)
Health Care and Social Assistance: Offices of Physical, Occupational and Speech Therapists, and Audiologists (10-19: 1)
Finance and Insurance: Insurance Agencies and Brokerages (5-9: 1, 1-4: 1)
Other Services (except Public Administration): General Automotive Repair (5-9: 1, 1-4: 1)
Educational Services: Elementary and Secondary Schools (5-9: 1)
Health Care and Social Assistance: Services for the Elderly and Persons with Disabilities (5-9: 1)
People in group quarters in 2010:
15 people in group homes intended for adults
People in group quarters in 2000:
14 people in other group homes
8 people in agriculture workers' dormitories on farms
3 people in nursing homes
Fatal accident statistics in 2013:
Fatal accident count: 1
Vehicles involved in fatal accidents: 2
Fatal accidents caused by drunken drivers: 2
Fatalities: 1
Persons involved in fatal accidents: 2
Pedestrians involved in fatal accidents: 0
2002 - 2018 National Fire Incident Reporting System (NFIRS) incidents
According to the data from the years 2002 - 2018 the average number of fire incidents per year is 12. The highest number of fires - 30 took place in 2008, and the least - 2 in 2004. The data has an increasing trend.
When looking into fire subcategories, the most incidents belonged to: Structure Fires (54.9%), and Outside Fires (29.9%).
Fire incident types reported to NFIRS in Zip Code 48767


+$984
-$4,492
(% of AGI for various income ranges: 6.2% for AGIs below $10k, 0.0% for AGIs $25k-50k, 0.0% for AGIs $50k-75k, 0.3% for AGIs $75k-100k)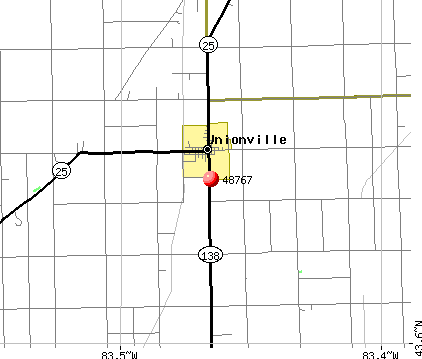 Nearest zip codes: 48759, 48701, 48733, 48723, 48735, 48720.


 According to the data from the years 2002 - 2018 the average number of fire incidents per year is 12. The highest number of fires - 30 took place in 2008, and the least - 2 in 2004. The data has an increasing trend.
 When looking into fire subcategories, the most incidents belonged to: Structure Fires (54.9%), and Outside Fires (29.9%).